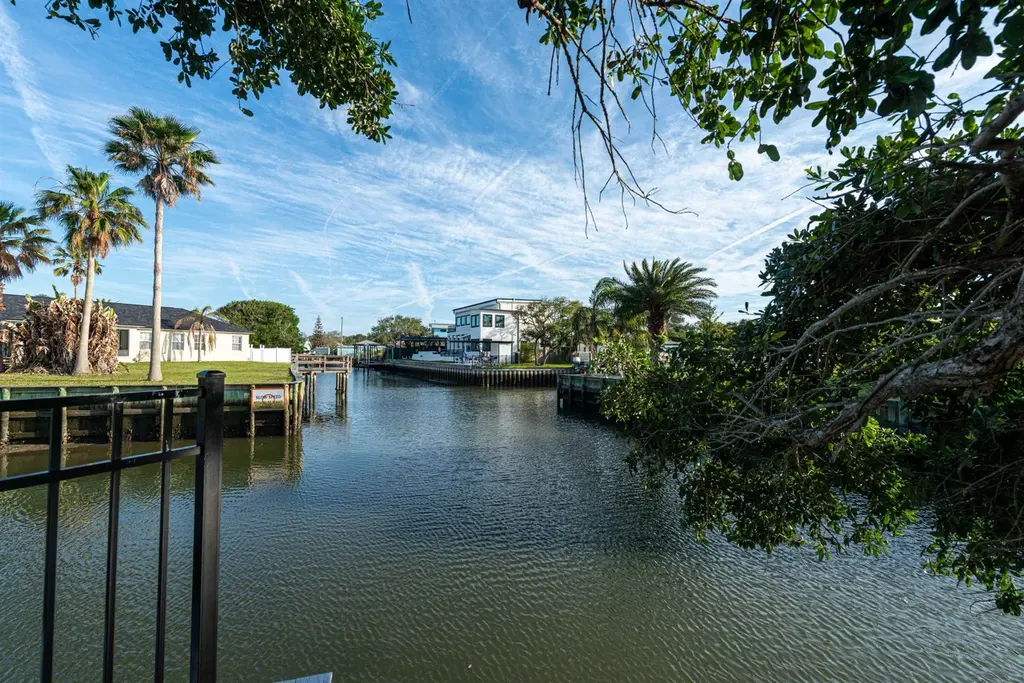
 🌊 Lakefront
299 Pizarro Rd · Butler Beach, FL
Flood risk 9/10 · Severe
- FEMA flood zone
- AE
- Chance of flooding over 30 yrs
- 0.99%
- Est. flood insurance / yr
- $1,737 – $8,500
Fire risk 4/10 · Minor
- Est. fire insurance / yr
- $947 – $1,759
Heat risk 9/10 · Severe
- Hot days now (above 105°F)
- 6 days/yr
- Hot days in 30 yrs
- 16 days/yr
Wind risk 10/10 · Severe
- Chance of severe wind over 30 yrs
- 99.0%
Air-quality risk 3/10 · Minor
- Unhealthy air days now
- 3 days/yr
- Unhealthy air days in 30 yrs
- 3 days/yr
Risk factors via First Street. Map © Google.
Why this score? — see what drove the C- grade
The composite is a weighted blend of 9 inputs, each scored 0–100. Each bar is that input's sub-score; the figure is the points it added to the 100-point composite (weight × sub-score).
- Cash flow +17.0/30.0
- ARV discount +15.0/15.0
- Schools +6.4/10.0
- DSCR +5.3/10.0
- 1% rule +3.5/10.0
- Livability +3.1/5.0
- Condition / age +2.5/5.0
- Rent growth +2.3/5.0
- Appreciation +0.0/10.0
$399,900
🖨 Deal sheet (PDF) 📄 Offer letter ✓ Due diligence
Listing remarks
Inviting 3BR/2BA home tucked away on a peaceful cul-de-sac, boasting approximately 144 feet of bulkhead canal frontage. This charming residence features tile and laminate flooring throughout, complemented by a cozy fireplace in the living area—perfect for relaxing evenings. The kitchen is designed for both function and comfort, offering ample counter space and a sunny eat-in area. Just steps away, you’ll find a convenient inside laundry area, making chores effortless. The owner’s suite is a true retreat with a spacious walk-in shower and plenty of room to unwind. Step outside to enjoy breathtaking sunsets and tranquil canal views from your waterfront oasis. The property in
Key facts
- Easy water access
- Ample counter space
- Inside laundry area
Tags
Property features AI
Finance
- Other: Lot is in a cul-de-sac on an irregular 0.22-acre parcel (less than 1/4 acre)
Exterior
- Parking: 2-car carport
- Utilities: County water; Septic waste system
- Home design: Single-story property; Ground-level entry
- Construction: Shingle roof; Crawlspace and slab foundation
- Exterior features: Screened porch; Dock; Bulkhead; On waterfront (canal)
Interior
- Kitchen: Dishwasher; Range; Refrigerator
- Bedrooms: Primary bedroom on the ground level
- Flooring: Laminate wood; Tile
- Bathrooms: 2 bathrooms; Primary bath with shower-only
- Heating & cooling: Central electric heating; Central electric air conditioning
- Interior features: Ceiling fans; Chandelier; Fireplace; Workshop
- Laundry & utility: Washer and dryer included
Neighborhood map
What this means for you Summary
Snapshot
- This is a 3-bed/2.0-bath manufactured listed at $400k.
Deal economics
- At list price, monthly cash flow is $-158 ($-2k/yr) — negative.
- To cash-flow at today's rent, offer at most $372k (7.0% below list).
- To meet the 1% rule (rent ≥ 1% of price), the offer needs to be $340k (15.1% below list).
- Recommended offer: $340k (15.1% below list) — sets the bar for 1% rule.
- Cap rate 7.1% vs local median 2.2% in Butler Beach — top-decile yield for the area; either an underpriced asset or a hidden risk that comps aren't pricing in. Stress-test before assuming the spread holds.
Location & tenants
- Location reads 61/100 on livability (#784 in FL) — a middle-class / working-renter tenant base. Strengths: crime A+, housing A+, employment A-; Watch: health & safety C-, amenities F, commute F.
- St. Johns (rural): math 75% / reading 73% proficiency, ranked #2 of 73 in FL (top 3%) — strong family-tenant draw, lease renewals of 3-5y typical; only 20% free/reduced lunch — higher-income household profile.
- Zoned schools: W. Douglas Hartley Elementary (math 79% / reading 74%, grade A, #185 of 2,144 statewide, top 9%, 633 students, 42% FRL); Gamble Rogers Middle School (math 61% / reading 55%, grade B, #151 of 571 statewide, top 27%, 925 students, 47% FRL); Pedro Menendez High School (math 31% / reading 54%, grade F, #264 of 667 statewide, top 41%, 1,519 students, 39% FRL) — zoned schools average 43% FRL vs 20% district-wide (23 pts higher); higher-poverty schools than district average — tighter screening recommended.
- Zoned-school proficiency averages 59% at this address vs 74% district-wide (-15 pts) — the specific schools serving this property underperform the St. Johns average; the district grade overstates school quality for this exact location.
- Market conditions: Rents soft (-1.0%/yr); 534 active listings in the ZIP; 7 comparable units currently listed for rent nearby; rentals at typical pace (median 17d on market — plan ~3-4 weeks tenant-placement turnaround); solid renter incomes; 5,575 units permitted in St. Johns County in 2024 (584 in 5+ unit buildings).
- This rent runs 44% of the median local income ($93k/yr) — at the standard rent-burdened threshold; future hikes will face affordability resistance.
Forward outlook
- Local home prices are declining (-3.0%/yr); year-one equity from $3k of loan paydown is wiped out by about $12k of value loss. Plan a longer hold.
- St. Johns County population projected at +60% by 2050 — long-run rental-demand tailwind backs the buy-and-hold thesis.
Negotiation context
- It's been on market 34 days — a 3% lower offer ($388k) is reasonable based on typical stale-listing flexibility.
- 2 sale attempts with the ask held roughly flat each time — persistent listings suggest the price (not the market) is what's stuck; bring a comps-based counter.
Risks & watch-outs
- Watch-outs: flood insurance adds $427/mo.
- Climate carrying-cost: in FEMA flood zone AE (mandatory federal flood insurance); severe wind risk, 99% chance of damaging wind over 30y; extreme-heat days projected 6→16/yr by 2055 (HVAC capex compounding) — expect insurance premiums to compound above CPI over the hold.
Questions for the listing agent
- What do current leases actually rent for vs. the listed asking? Can we see a recent rent roll and the last 12 months of T-12 income?
- It's been on market 34 days. Have you received any prior offers? Is the seller open to a 15% concession, seller financing, or rate buy-down credit?
- What's the actual annual flood-insurance premium (NFIP or private), and is the property in a SFHA with mandatory coverage?
- Is there a deadline driving the sale (1031 exchange, divorce, estate, relocation)? That informs how much negotiation room exists.
- Schools are D-rated, which usually means shorter tenancies and higher turnover. Who's the typical renter profile here, and what's been the actual vacancy rate?
- This sits on a lake — are riparian / water-frontage rights deeded with the parcel? Any dock permits, shoreline easements, or HOA water-use restrictions?
- What's the documented flood / surge / shoreline-erosion history here (FEMA AND non-FEMA — e.g., storm surge, creek backup, septic-field saturation)?
- Any water-quality or seasonal algae-bloom issues that affect tenant satisfaction or short-term-rental demand?
- What's the average days-on-market for RENTAL listings here right now (not sales)? A rising rental-DOM trend means longer vacancies and softer asking-rent achievability than the comps imply.
- What's the recent tenant-quality profile in this submarket — average credit score on applications, eviction rate, late-payment / NSF rate, and stable-employment percentage? A property-management company in the area should have these aggregated.
- How much new for-sale + rental construction is in the pipeline within 1–3 miles? Heavy new supply typically softens prices + rents 12–24 months out; constrained supply supports both.
Investment metrics
- 1% rule
- 0.85% ✗
- Cap rate
- 7.10%
- Cash-on-cash
- 2.87%
- DSCR
- 1.13
- GRM
- 9.8
CMA / ARV
- ARV (median comp)
- $554,190
- List price
- $399,900
- Delta
- -27.84%
- Verdict
- UNDERPRICED
- Comps
- 6 within 1.0 mi
Show comp detail 8 sales within ~0.75 mi
| Address | Dist | Beds/Ba | Sqft | Sold | Price | $/sf | Match |
|---|---|---|---|---|---|---|---|
| 299 Pizarro Rd | 0.00mi | 3/2.0 | 1,562 (0%) | 0mo | $375,000 | $240 | 100 |
| 285 Villa Verda Rd | 0.36mi | 3/2.0 | 1,548 (-1%) | 8mo | $499,900 | $323 | 75 |
| 206 Basque Rd | 0.22mi | 3/2.0 | 1,493 (-4%) | 20mo | $600,000 | $402 | 66 |
| 252 Majorca Rd | 0.15mi | 3/2.0 | 1,404 (-10%) | 17mo | $385,000 | $274 | 62 |
| 255 Majorca Rd | 0.12mi | 2/2.0 (-1) | 1,344 (-14%) | 6mo | $415,000 | $309 | 61 |
| 221 Barco Rd | 0.49mi | 3/2.0 | 1,652 (+6%) | 10mo | $499,000 | $302 | 60 |
| 224 Puebla Rd | 0.35mi | 2/2.0 (-1) | 1,328 (-15%) | 14mo | $391,926 | $295 | 42 |
| 260 Desoto Rd | 0.50mi | 3/2.0 | 1,740 (+11%) | 20mo | $485,000 | $279 | 41 |
Match score weights: distance 35% · size 25% · config 20% · recency 20%. Top-matched comps best support the ARV.
Projected returns pro-forma
-3.0% appreciation · 0.0% rent growth · sell at horizon
- IRR
- -22.6%
- Equity multiple
- 0.24×
- Total profit
- $-84,743
- Equity at exit
- $59,626
- IRR
- -27.5%
- Equity multiple
- -0.11×
- Total profit
- $-124,844
- Equity at exit
- $34,576
Cash invested: $111,972 (down + closing). Projections, not guarantees.
Landlord ↔ Tenant lean methodology
- Overall (STATE)
- 87 Strongly Landlord-Friendly
- State Florida
- 87 Strongly Landlord-Friendly · R+3
- County
- — inherits STATE
- City
- — inherits STATE
ZIP-level market 32080
- Rents YoY
- -1.0%
- Active inventory
- 534
- Price-to-rent
- 9.8×
Monthly cashflow live
- Estimated rent
- $3,396 high interval (Pro) →
- Mortgage (P&I)
- −$2,097
- Tax from tax record
- −$151 /mo · $1,813/yr
- Insurance
- −$167
- Flood insurance flood zone
- −$427 /mo · $5,118/yr
- HOA
- −$0
- Vacancy / Maint / Mgmt
- −$713
- Net cashflow
- $-158
Break-even live
Sensitivity live
| Price | -10% $68 | -5% $-45 | +0% $-158 | +5% $-272 | +10% $-385 |
|---|---|---|---|---|---|
| Rent | -10% $-427 | -5% $-293 | +0% $-158 | +5% $-24 | +10% $110 |
| Rate | -1.0pp $43 | -0.5pp $-57 | base $-158 | +0.5pp $-262 | +1.0pp $-367 |
UW: 25.0% down · 7.5% · 30yr · 1.5% tax · 5.0% vac · 8.0% maint · 8.0% mgmt
Financing live
Cash to close
- Down payment
- $99,975
- Closing costs
- $11,997
- Reserves months
- —
- Total cash needed
- —
Loan-product check · same deal, 3 products live
Conventional
25% down · 7.5% · 30yr
- Down + closing
- —
- Monthly P&I
- —
- Monthly cashflow
- —
- DSCR
- —
- Eligible?
- —
Personal DTI + credit; lowest rate.
DSCR
20% down · 8.5% · 30yr
- Down + closing
- —
- Monthly P&I
- —
- Monthly cashflow
- —
- DSCR
- —
- Eligible?
- —
No personal income docs; deal must DSCR.
Hard money
10% down · 12.0% · 12mo
- Down + closing
- —
- Monthly P&I
- —
- Monthly cashflow
- —
- DSCR
- —
- Eligible?
- —
Short-term bridge; refi at stabilization.
Rent comps 7 comps
| Address | Beds | Baths | Sqft | Rent | $/sqft | DOM | Units | Dist |
|---|---|---|---|---|---|---|---|---|
| 6347 Salado Rd Saint Augustine, FL | 3.0 | 2.0 | 1728 | $3,000 | $1.74 | 23d | 1 | 0.26mi |
| 84 Aloha Cir Saint Augustine, FL | 3.0 | 2.0 | 1261 | $2,900 | $2.30 | 9d | 1 | 0.42mi |
| 6100 Jimmy Buffett Memorial Hwy Unit 1253532P St. Augustine, FL | 2.0 | 2.5 | 1119 | $6,585 | $5.88 | 16d | 1 | 0.44mi |
| 6240 A1A S Unit 1281960P St. Augustine, FL | 2.0 | 2.0 | 1453 | $4,297 | $2.96 | 9d | 1 | 0.56mi |
| 221 Desoto Rd Saint Augustine, FL | 3.0 | 2.0 | 1560 | $3,000 | $1.92 | 19d | 1 | 0.60mi |
| 6832 Middleton Ave Saint Augustine, FL | 3.0 | 2.5 | 1791 | $4,000 | $2.23 | 9d | 1 | 1.13mi |
| 6824 Jimmy Buffett Memorial Hwy Unit 1281930P St. Augustine, FL | 3.0 | 2.5 | 1689 | $7,768 | $4.60 | 16d | 1 | 1.15mi |
Listing history 13 events
-
2026-06-13statusdays on market $399,900 Pending 34 DOM
-
2026-06-10days on market $399,900 Contingent- Accepting Backups 33 DOM
-
2026-06-08days on market $399,900 Contingent- Accepting Backups 32 DOM
-
2026-06-07days on market $399,900 Contingent- Accepting Backups 31 DOM
-
2026-06-03days on market $399,900 Contingent- Accepting Backups 27 DOM
-
2026-06-02days on market $399,900 Contingent- Accepting Backups 26 DOM
-
2026-06-01days on market $399,900 Contingent- Accepting Backups 25 DOM
-
2026-05-31days on market $399,900 Contingent- Accepting Backups 24 DOM
-
2026-05-18historical Contingent- Accepting Backups 888-char remark
-
2026-05-14status Active 888-char remark
-
2026-05-11historical Contingent- Accepting Backups 888-char remark
-
2026-05-07$399,900 Active 888-char remark
-
2004-03-17soldstatus $275,000
ⓘ Source: listings_history table (triggers on properties + properties_extension) + one-shot
backfill from property_details.listing_events for pre-trigger history.
Tax reassessment forecast FL · Resets to sale price
- Current annual tax
- $1,813 · $151/mo
- Projected year-2 tax
- $3,319 · $277/mo
- Expected delta
- +$1,506/yr (+$126/mo · 83.1%)
ⓘ Screening estimate from a state-policy table — verify with the county assessor before closing.
Climate risk First Street
- Flood 9/10 Extreme FEMA zone AE · 99% chance over 30 yrs
- Wildfire 4/10 Moderate
- Heat 9/10 Extreme 6 d/yr ≥105°F today · 16 d/yr by 30 yrs out
- Wind 10/10 Extreme 99% chance of damaging wind over 30 yrs
- Air quality 3/10 Moderate 3 unhealthy d/yr today · 3 by 30 yrs out
Nearby sold comps map
Loading sold comps map…
Walkable amenities ~0.75 mi
Loading nearby amenities…
Taxation est. · year 1
- Rental income
- $40,754
- − Mortgage interest
- −$22,401
- − Property taxes
- −$1,813
- − Insurance
- −$7,118
- − Repairs & maintenance
- −$3,260
- − Management
- −$3,260
- − Depreciation
- −$11,633
- Taxable loss
- −$8,732
- Est. tax savings @ 24.0%
- +$2,096
- After-tax cash flow
- $195/yr
For passive investors: Depreciation is non-cash, so a rental often shows a tax loss while cash-flowing — sheltering income. Rental losses are passive: they offset passive income freely, and up to $25,000/yr can offset ordinary (W-2) income if you actively participate and your MAGI is under $100k (phasing out to $0 by $150k); unused losses carry forward. On sale, claimed depreciation is recaptured at up to 25%, and gains may owe capital-gains tax (a 1031 exchange can defer both). Figures are a year-1 estimate at your 24.0% rate — not tax advice; consult a CPA.
Schools (NCES district)
- District
- St. Johns
- NCES district ID
- 1201740
- Math proficiency
- 75% ▼ -5.00%
- Reading proficiency
- 73% ▼ -2.00%
- Median HH income
- $66,842
- Composite
- 64.31/100
- National rank
- #556
- State rank
- #2 of 73 in FL
Livability — Butler Beach
- Score
- 61/100
- State rank
- #784
- US rank
- #17810
Category grades
Schools grade is shown separately in the Schools card above.
Census & demographics
- Census place
- Butler Beach, FL
- County
- Saint Johns County · 301,599 people
- City population
- 21,368
- Metro
- Jacksonville, FL
- Population (ZIP)
- 20,894
- Household income
- $92,531
- Rent vs Own
- Severe rent burden
- 417.0
Population outlook (St. Johns County) Hauer SSP2
- Today (2025)
- 303,941 people
- By 2030
- 342,590 · +12.7%
- By 2040
- 417,328 · +37.3%
- By 2050
- 487,011 · +60.2%
- By 2075
- 635,395 · +109.1%
- By 2100
- 717,469 · +136.1%
Race, ethnicity, and origin ACS 2023
- Neighborhood character
- Predominantly White (90%)
- Race & ethnicity
- White 90% Two or more races 5% Hispanic / Latino 4% Asian 2%
- Common ancestry
- Romanian 4% Lithuanian 4% Slovak 3%
- Foreign-born
- 7% · Canada, Jamaica
- Languages at home
- 95% English-only · Spanish 2% Other Indo-European 2% Russian/Polish/Slavic 1%
Political lean MEDSL · St. Johns
- 2024 margin
- Solid R (+31.4) · D 33.9% · R 65.2%
- 2008→2024 swing
- +0.2pp no change · 2008: -31.6pp · 2024: -31.4pp
- All cycles
- 2024: R+31.4 2020: R+26.7 2016: R+33.4 2012: R+37.8 2008: R+31.6
Not yet ingested
- Civics
- —
Market trends
- HPI YoY
- ▼ -560.06%
- Current HPI
- 301.5733
- Rent YoY
- ▼ -0.97%
- Metro
- Jacksonville, FL
- State GDP YoY
- ▲ 3.28%
- F500 in state
- 36
Industry mix (Fortune 500 HQ in FL)
| Industry | F500 HQs | Revenue |
|---|---|---|
| Industrial Technology | 2 | $29B |
|
||
| Insurance | 2 | $17B |
|
||
| Retail | 1 | $60B |
|
||
| Technology Distribution | 1 | $58B |
|
||
| Homebuilding | 1 | $35B |
|
||
| Technology Manufacturing | 1 | $35B |
|
||
Price history
+36.4% since first listed8 events — show timeline
- 2026-06-15 Delisted — St. Augustine and St. Johns County Board of REALTORS®
- 2026-06-15 Sold (MLS) $375,000 St. Augustine and St. Johns County Board of REALTORS®
- 2026-06-10 Pending — St. Augustine and St. Johns County Board of REALTORS®
- 2026-05-18 Contingent — St. Augustine and St. Johns County Board of REALTORS®
- 2026-05-14 Relisted — St. Augustine and St. Johns County Board of REALTORS®
- 2026-05-11 Contingent — St. Augustine and St. Johns County Board of REALTORS®
- 2026-05-07 Listed $399,900 St. Augustine and St. Johns County Board of REALTORS®
- 2004-03-17 Sold (Public Records) $275,000 Public Records
Property tax history
+1.5%/yrLatest (2025): $1,813 · +13.9% YoY. Source: county tax records.
Cash-flow waterfall
monthlySold comps — $/sqft
last 12 mo · ≤1 miLoading sold comps…