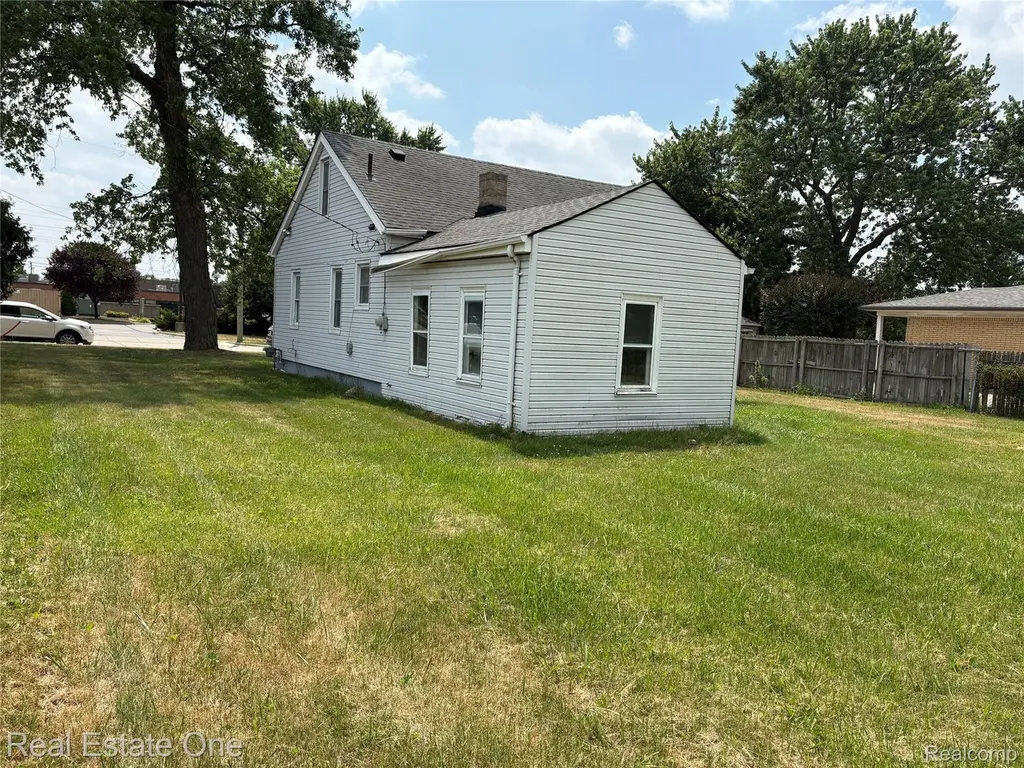
5873 Elmgrove Ave · Warren, MI
Flood risk 1/10 · Minimal
- FEMA flood zone
- X (unshaded)
- Chance of flooding over 30 yrs
- 0.0%
- Est. flood insurance / yr
- $507 – $1,088
Fire risk 1/10 · Minimal
- Est. fire insurance / yr
- $784 – $1,456
Heat risk 3/10 · Minor
- Hot days now (above 97°F)
- 7 days/yr
- Hot days in 30 yrs
- 15 days/yr
Wind risk 1/10 · Minimal
- Chance of severe wind over 30 yrs
- —
Air-quality risk 3/10 · Minor
- Unhealthy air days now
- 3 days/yr
- Unhealthy air days in 30 yrs
- 4 days/yr
Risk factors via First Street. Map © Google.
Why this score? — see what drove the B grade
The composite is a weighted blend of 9 inputs, each scored 0–100. Each bar is that input's sub-score; the figure is the points it added to the 100-point composite (weight × sub-score).
- Cash flow +26.0/30.0
- ARV discount +15.0/15.0
- DSCR +8.7/10.0
- 1% rule +7.9/10.0
- Rent growth +4.5/5.0
- Livability +3.7/5.0
- Schools +2.5/10.0
- Condition / age +2.5/5.0
- Appreciation +0.0/10.0
$149,000
🖨 Deal sheet 📄 Offer letter ✓ Due diligence
Listing remarks MLS
* Residential Home! that is ZONED C-2 COMMERCIAL or OFFICE USE! Sold As Is! can be used as a Residential Home! Great Investment Property! Large Corner Lot * 3 Bedroom Bungalow, Great floor plan with lots of potential * Updates include newer dimensional Roof, Vinyl siding, Bathroom, Vinyl Windows & Flooring. Immediate Possession! Sold As Is!
Key facts
- Vinyl windows
- Large corner lot
- Zoned c-2 commercial
Tags
Neighborhood map
What this means for you Summary
Snapshot
- This is a 3-bed/1.0-bath single-family listed at $149k.
Deal economics
- At list price, monthly cash flow is $369 ($4k/yr) — positive.
- The deal already cash-flows at list — no discount required.
- Meets the 1% rule at list price ($2k rent vs $149k).
- Recommended offer: $140k (6.0% below list) — sets the bar for market timing.
- Cap rate 9.3% vs local median 5.3% in Warren — top-decile yield for the area; either an underpriced asset or a hidden risk that comps aren't pricing in. Stress-test before assuming the spread holds.
Location & tenants
- Location reads 74/100 on livability (#171 in MI, #4,491 nationally) — a middle-class / working-renter tenant base. Strengths: commute A+, cost of living A+, housing A+; Watch: schools D, amenities D, employment D.
- Warren Consolidated Schools (urban): math 18% / reading 39% proficiency, ranked #373 of 540 in MI (top 69%) — low school quality limits family demand, transient renter base, plan for 1-2y turnover.
- Market conditions: Rents rising fast (+8.0%/yr); 96 active listings in the ZIP; 10 comparable units currently listed for rent nearby; rentals at typical pace (median 25d on market — plan ~3-4 weeks tenant-placement turnaround); 1,321 units permitted in Macomb County in 2024 (86 in 5+ unit buildings).
- This rent runs 31% of the median local income ($74k/yr) — at the standard rent-burdened threshold; future hikes will face affordability resistance.
Forward outlook
- Local home prices are declining (-3.0%/yr); year-one equity from $1k of loan paydown is wiped out by about $4k of value loss. Plan a longer hold.
- Macomb County population projected at +9% by 2050 — modest demand growth; plan on rents tracking national, not racing it.
- At projected returns (-3.0% appreciation + 8.0% rent growth), your $42k cash investment doubles in ~7 years — after that, you're playing with house money.
Negotiation context
- It's been on market 72 days — a 6% lower offer ($140k) is reasonable based on typical stale-listing flexibility.
- 7 sale attempts since 9y ago with the ask held roughly flat each time — persistent listings suggest the price (not the market) is what's stuck; bring a comps-based counter.
- Current owner paid $60k; list at $149k implies a 148% gain — meaningful room to come down on a strong offer.
Risks & watch-outs
- Watch-outs: built in 1938 — expect roof / HVAC / electrical / plumbing capex.
Questions for the listing agent
- It's been on market 72 days. Have you received any prior offers? Is the seller open to a 6% concession, seller financing, or rate buy-down credit?
- Built in 1938 — when were the roof, HVAC, electrical panel, plumbing, and water heater last replaced?
- Why hasn't it sold? Are there any deal-killer items the seller is aware of (foundation, flood, title, zoning, code violations)?
- Is there a deadline driving the sale (1031 exchange, divorce, estate, relocation)? That informs how much negotiation room exists.
- Schools are D-rated, which usually means shorter tenancies and higher turnover. Who's the typical renter profile here, and what's been the actual vacancy rate?
- Crime grade is D in this area — have there been break-ins, vandalism, or insurance claims at this property in the last 3 years? What carrier currently insures it and at what premium?
- What's the average days-on-market for RENTAL listings here right now (not sales)? A rising rental-DOM trend means longer vacancies and softer asking-rent achievability than the comps imply.
- What's the recent tenant-quality profile in this submarket — average credit score on applications, eviction rate, late-payment / NSF rate, and stable-employment percentage? A property-management company in the area should have these aggregated.
- How much new for-sale + rental construction is in the pipeline within 1–3 miles? Heavy new supply typically softens prices + rents 12–24 months out; constrained supply supports both.
Investment metrics
- 1% rule
- 1.29% ✓
- Cap rate
- 9.27%
- Cash-on-cash
- 10.63%
- DSCR
- 1.47
- GRM
- 6.5
CMA / ARV
- ARV (median comp)
- $246,122
- List price
- $149,000
- Delta
- -39.46%
- Verdict
- UNDERPRICED
- Comps
- 20 within 1.0 mi
Show comp detail 4 sales within ~0.75 mi
| Address | Dist | Beds/Ba | Sqft | Sold | Price | $/sf | Match |
|---|---|---|---|---|---|---|---|
| 5600 Elmgrove Ave | 0.15mi | 3/2.0 | 1,256 (+5%) | 7mo | $238,500 | $190 | 75 |
| 28556 Milton St | 0.50mi | 3/1.5 | 1,160 (-3%) | 7mo | $220,500 | $190 | 63 |
| 4719 E 12 Mile Rd | 0.65mi | 3/1.5 | 1,200 (+0%) | 10mo | $190,000 | $158 | 59 |
| 28150 Loretta Ave | 0.72mi | 3/1.0 | 1,128 (-6%) | 6mo | $150,000 | $133 | 52 |
Match score weights: distance 35% · size 25% · config 20% · recency 20%. Top-matched comps best support the ARV.
Projected returns pro-forma
-3.0% appreciation · 8.0% rent growth · sell at horizon
- IRR
- 5.6%
- Equity multiple
- 1.23×
- Total profit
- $9,618
- Equity at exit
- $22,216
- IRR
- 19.4%
- Equity multiple
- 3.04×
- Total profit
- $85,193
- Equity at exit
- $12,883
Cash invested: $41,720 (down + closing). Projections, not guarantees.
Landlord ↔ Tenant lean methodology
- Overall (STATE)
- 62 Landlord-Friendly
- State Michigan
- 62 Landlord-Friendly · EVEN
- County
- — inherits STATE
- City
- — inherits STATE
ZIP-level market 48092
- Rents YoY
- 8.0%
- Active inventory
- 96
- Price-to-rent
- 6.5×
Monthly cashflow live
- Estimated rent
- $1,917 high interval (Pro) →
- Mortgage (P&I)
- −$781
- Tax from tax record
- −$302 /mo · $3,619/yr
- Insurance
- −$62
- HOA
- −$0
- Vacancy / Maint / Mgmt
- −$403
- Net cashflow
- $369
Break-even live
UW: 25.0% down · 7.5% · 30yr · 1.5% tax · 5.0% vac · 8.0% maint · 8.0% mgmt
Financing live
Cash to close
- Down payment
- $37,250
- Closing costs
- $4,470
- Reserves months
- —
- Total cash needed
- —
Loan-product check · same deal, 3 products live
Conventional
25% down · 7.5% · 30yr
- Down + closing
- —
- Monthly P&I
- —
- Monthly cashflow
- —
- DSCR
- —
- Eligible?
- —
Personal DTI + credit; lowest rate.
DSCR
20% down · 8.5% · 30yr
- Down + closing
- —
- Monthly P&I
- —
- Monthly cashflow
- —
- DSCR
- —
- Eligible?
- —
No personal income docs; deal must DSCR.
Hard money
10% down · 12.0% · 12mo
- Down + closing
- —
- Monthly P&I
- —
- Monthly cashflow
- —
- DSCR
- —
- Eligible?
- —
Short-term bridge; refi at stabilization.
Rent comps 10 comps
| Address | Beds | Baths | Sqft | Rent | $/sqft | DOM | Units | Dist |
|---|---|---|---|---|---|---|---|---|
| 29745 Fox Run Cir Warren, MI | 3.0 | 2.0 | 1487 | $2,200 | $1.48 | 43d | 1 | 0.61mi |
| 28439 Wexford Dr Warren, MI | 3.0 | 1.5 | 1253 | $2,099 | $1.68 | 24d | 1 | 1.19mi |
| 27107 Seyburn Ave Warren, MI | 2.0 | 1.0 | 750 | $1,300 | $1.73 | 22d | 1 | 1.24mi |
| 29400 Towne Center Cir Warren, MI | 1.0–3.0 | 1.0–2.0 | 1114 | $2,099 | $1.88 | 1d | 1 | 1.28mi |
| 8429 Towne Center Cir S #52 Warren, MI | 2.0 | 2.0 | 1240 | $1,775 | $1.43 | 24d | 1 | 1.30mi |
| 8457 Towne Center Cir Unit 90 Warren, MI | 2.0 | 2.0 | 1319 | $1,800 | $1.36 | 43d | 1 | 1.30mi |
| 31499 Mound Rd Warren, MI | 1.0–2.0 | 1.0 | 900 | $1,413 | $1.57 | 3d | 5 | 1.31mi |
| 29250 Longview Ave Apt 14 Warren, MI | 2.0 | 1.0 | 950 | $1,000 | $1.05 | 43d | 1 | 1.32mi |
| 26009 Pinehurst Dr Warren, MI | 2.0 | 1.5 | 1310 | $2,100 | $1.60 | 1d | 1 | 1.38mi |
| 4473 Buchanan Ave Warren, MI | 3.0 | 1.5 | 1064 | $1,650 | $1.55 | 24d | 1 | 1.48mi |
Listing history 30 events
-
2026-06-18days on market $149,000 Active 72 DOM
-
2026-06-17days on market $149,000 Active 71 DOM
-
2026-06-16days on market $149,000 Active 70 DOM
-
2026-06-15days on market $149,000 Active 69 DOM
-
2026-06-13days on market $149,000 Active 67 DOM
-
2026-06-09days on market $149,000 Active 63 DOM
-
2026-06-08days on market $149,000 Active 62 DOM
-
2026-06-07days on market $149,000 Active 61 DOM
-
2026-06-04days on market $149,000 Active 58 DOM
-
2026-06-03days on market $149,000 Active 57 DOM
-
2026-06-02days on market $149,000 Active 56 DOM
-
2026-06-01days on market $149,000 Active 55 DOM
-
2026-05-31days on market $149,000 Active 54 DOM
-
2026-04-07$149,000 Active 352-char remark
Show marketing remark (352 chars)
* Residential Home! that is ZONED C-2 COMMERCIAL or OFFICE USE! Sold As Is! can be used as a Residential Home! Great Investment Property! Large Corner Lot * 3 Bedroom Bungalow, Great floor plan with lots of potential * Updates include newer dimensional Roof, Vinyl siding, Bathroom, Vinyl Windows & Flooring. Immediate Possession! Sold As Is!
-
2026-04-07historical
Show marketing remark (352 chars)
* Residential Home! that is ZONED C-2 COMMERCIAL or OFFICE USE! Sold As Is! can be used as a Residential Home! Great Investment Property! Large Corner Lot * 3 Bedroom Bungalow, Great floor plan with lots of potential * Updates include newer dimensional Roof, Vinyl siding, Bathroom, Vinyl Windows & Flooring. Immediate Possession! Sold As Is!
-
2026-04-07$149,000 Active
Show marketing remark (352 chars)
* Residential Home! that is ZONED C-2 COMMERCIAL or OFFICE USE! Sold As Is! can be used as a Residential Home! Great Investment Property! Large Corner Lot * 3 Bedroom Bungalow, Great floor plan with lots of potential * Updates include newer dimensional Roof, Vinyl siding, Bathroom, Vinyl Windows & Flooring. Immediate Possession! Sold As Is!
-
2026-04-07historical
Show marketing remark (352 chars)
* Residential Home! that is ZONED C-2 COMMERCIAL or OFFICE USE! Sold As Is! can be used as a Residential Home! Great Investment Property! Large Corner Lot * 3 Bedroom Bungalow, Great floor plan with lots of potential * Updates include newer dimensional Roof, Vinyl siding, Bathroom, Vinyl Windows & Flooring. Immediate Possession! Sold As Is!
-
2025-10-01price $149,900
-
2025-10-01price $149,900
-
2025-10-01price $149,900
-
2025-07-09$169,900 Active
-
2025-07-07$169,900 Active
-
2018-08-03soldstatus $60,000
-
2018-08-03soldstatus $60,000
-
2018-03-20$79,900
-
2018-03-20historical
-
2018-02-05$130,000
-
2018-02-03historical
-
2017-09-19$130,000
-
1967-05-01soldstatus $16,261
ⓘ Source: listings_history table (triggers on properties + properties_extension) + one-shot
backfill from property_details.listing_events for pre-trigger history.
Tax reassessment forecast MI · Partial reset (capped growth)
- Current annual tax
- $3,619 · $302/mo
- Projected year-2 tax
- $3,619 · $302/mo
- Expected delta
- $0/yr ($0/mo · 0.0%)
ⓘ Screening estimate from a state-policy table — verify with the county assessor before closing.
Climate risk First Street
- Flood 1/10 Low FEMA zone X (unshaded) · 0% chance over 30 yrs
- Wildfire 1/10 Low
- Heat 3/10 Moderate 7 d/yr ≥97°F today · 15 d/yr by 30 yrs out
- Wind 1/10 Low
- Air quality 3/10 Moderate 3 unhealthy d/yr today · 4 by 30 yrs out
Nearby sold comps map
Loading sold comps map…
Walkable amenities ~0.75 mi
Loading nearby amenities…
Taxation est. · year 1
- Rental income
- $23,005
- − Mortgage interest
- −$8,346
- − Property taxes
- −$3,619
- − Insurance
- −$745
- − Repairs & maintenance
- −$1,840
- − Management
- −$1,840
- − Depreciation
- −$4,335
- Taxable income
- $2,279
- Est. tax owed @ 24.0%
- −$547
- After-tax cash flow
- $3,886/yr
For passive investors: Depreciation is non-cash, so a rental often shows a tax loss while cash-flowing — sheltering income. Rental losses are passive: they offset passive income freely, and up to $25,000/yr can offset ordinary (W-2) income if you actively participate and your MAGI is under $100k (phasing out to $0 by $150k); unused losses carry forward. On sale, claimed depreciation is recaptured at up to 25%, and gains may owe capital-gains tax (a 1031 exchange can defer both). Figures are a year-1 estimate at your 24.0% rate — not tax advice; consult a CPA.
Schools (NCES district)
- District
- Warren Consolidated Schools
- NCES district ID
- 2635190
- Math proficiency
- 18% ▼ -14.00%
- Reading proficiency
- 39% ▼ -8.00%
- Median HH income
- $52,259
- Composite
- 25.09/100
- National rank
- #7533
- State rank
- #373 of 540 in MI
Livability — Warren
- Score
- 74/100
- State rank
- #171
- US rank
- #4491
Category grades
Schools grade is shown separately in the Schools card above.
Census & demographics
- Census place
- Warren, MI
- County
- Macomb County · 638,552 people
- City population
- 114,937
- Metro
- Detroit-Warren-Dearborn, MI
- Population (ZIP)
- 27,374
- Household income
- $73,808
- Rent vs Own
- Severe rent burden
- 675.0
Population outlook (Macomb County) Hauer SSP2
- Today (2025)
- 925,296 people
- By 2030
- 948,226 · +2.5%
- By 2040
- 983,961 · +6.3%
- By 2050
- 1,010,200 · +9.2%
- By 2075
- 1,076,222 · +16.3%
- By 2100
- 1,077,065 · +16.4%
Race, ethnicity, and origin ACS 2023
- Neighborhood character
- Diverse neighborhood (Simpson 0.55)
- Race & ethnicity
- White 63% Asian 17% Black 14% Two or more races 4% Hispanic / Latino 2%
- Common ancestry
- Romanian 10% Arab 4% Subsaharan African 2%
- Foreign-born
- 22% · Vietnam, Canada, China
- Languages at home
- 70% English-only · Other Indo-European 11% Arabic 5% Russian/Polish/Slavic 3%
Political lean MEDSL · Macomb
- 2024 margin
- R (+13.7) · D 42.2% · R 55.9% · Other 1.9%
- 2008→2024 swing
- -22.3pp toward R · 2008: 8.6pp · 2024: -13.7pp
- All cycles
- 2024: R+13.7 2020: R+8.1 2016: R+11.6 2012: D+4.0 2008: D+8.6
Not yet ingested
- Civics
- —
Market trends
- HPI YoY
- ▼ -262.85%
- Current HPI
- 189.7524
- Rent YoY
- ▲ 8.03%
- Metro
- Detroit-Warren-Dearborn, MI
- State GDP YoY
- ▲ 1.37%
- F500 in state
- 28
Industry mix (Fortune 500 HQ in MI)
| Industry | F500 HQs | Revenue |
|---|---|---|
| Automotive Parts | 3 | $48B |
|
||
| Automotive | 2 | $372B |
|
||
| Chemicals | 1 | $45B |
|
||
| Automotive Retail | 1 | $29B |
|
||
| Healthcare / Medical Devices | 1 | $23B |
|
||
| Automotive Technology | 1 | $20B |
|
||
Price history
+816.3% since first listed17 events — show timeline
- 2026-04-07 Listed $149,000 REALCOMP
- 2026-04-07 Listing Removed — MiRealSource-MiMLS
- 2026-04-07 Listed $149,000 MiRealSource-MiMLS
- 2026-04-07 Listing Removed — REALCOMP
- 2025-10-01 Price Changed $149,900 MiRealSource-MiMLS
- 2025-10-01 Price Changed $149,900 MiRealSource-MiMLS
- 2025-10-01 Price Changed $149,900 REALCOMP
- 2025-07-09 Listed $169,900 REALCOMP
- 2025-07-07 Listed $169,900 MiRealSource-MiMLS
- 2018-08-03 Sold (Public Records) $60,000 Public Records
- 2018-08-03 Sold (MLS) $60,000 REALCOMP
- 2018-03-20 Listing Removed — REALCOMP
- 2018-03-20 Listed $79,900 REALCOMP
- 2018-02-05 Listed $130,000 REALCOMP
- 2018-02-03 Listing Removed — REALCOMP
- 2017-09-19 Listed $130,000 REALCOMP
- 1967-05-01 Sold (Public Records) $16,261 Public Records
Property tax history
+7.1%/yrLatest (2025): $3,619 · +2.6% YoY. Source: county tax records.
Cash-flow waterfall
monthlySold comps — $/sqft
last 12 mo · ≤1 miLoading sold comps…