623 N Kingman St · Helena, OK
Flood risk 1/10 · Minimal
- FEMA flood zone
- —
- Chance of flooding over 30 yrs
- 0.0%
- Est. flood insurance / yr
- —
Fire risk 1/10 · Minimal
- Est. fire insurance / yr
- $2,463 – $4,575
Heat risk 6/10 · Moderate
- Hot days now (above 107°F)
- 7 days/yr
- Hot days in 30 yrs
- 19 days/yr
Wind risk 2/10 · Minimal
- Chance of severe wind over 30 yrs
- 1.0%
Air-quality risk 1/10 · Minimal
- Unhealthy air days now
- 0 days/yr
- Unhealthy air days in 30 yrs
- 0 days/yr
Risk factors via First Street. Map © Google.
Why this score? — see what drove the B+ grade
The composite is a weighted blend of 9 inputs, each scored 0–100. Each bar is that input's sub-score; the figure is the points it added to the 100-point composite (weight × sub-score).
- Cash flow +30.0/30.0
- ARV discount +15.0/15.0
- DSCR +10.0/10.0
- 1% rule +8.3/10.0
- Appreciation +3.7/10.0
- Schools +3.5/10.0
- Livability +3.4/5.0
- Rent growth +2.5/5.0
- Condition / age +2.5/5.0
$95,000
🖨 Deal sheet 📄 Offer letter ✓ Due diligence
Listing remarks
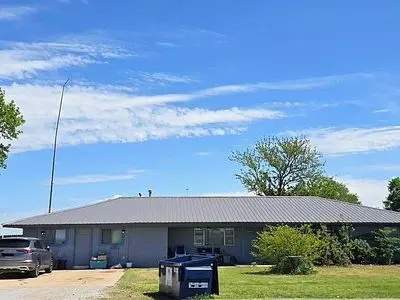
FOR SALE Welcome to this charming 4-bedroom, 2-bath home situated on a desirable corner lot in Helena, Oklahoma. Featuring a durable metal roof and plenty of space both inside and out, this property offers comfort, functionality, and small-town living at its best. The spacious layout provides room for family, guests, or a home office, while the large backyard offers endless possibilities for entertaining, gardening, pets, or simply enjoying the outdoors. With its great corner-lot location, attractive curb appeal, and generous outdoor space, this home is ready for its next owner to make it their own. Don't miss the opportunity to enjoy peaceful Helena living with plenty of room to spread out
Key facts
- Metal roof
- Large backyard
- Corner lot
Tags
Neighborhood map
What this means for you Summary
Snapshot
- This is a 3-bed/2.0-bath single-family listed at $95k.
Deal economics
- At list price, monthly cash flow is $394 ($5k/yr) — positive.
- The deal already cash-flows at list — no discount required.
- Meets the 1% rule at list price ($1k rent vs $95k).
Location & tenants
- Location reads 68/100 on livability (#69 in OK) — a middle-class / working-renter tenant base. Strengths: cost of living A+, housing A+, employment A; Watch: schools D-, amenities F, commute F.
- Timberlake (rural): math 45% / reading 30% proficiency, ranked #130 of 513 in OK (top 25%) — families likely to look elsewhere, expect single-tenant / working-renter base with shorter leases.
- Market conditions: 3 active listings in the ZIP.
Forward outlook
- Local home prices are declining (-2.6%/yr); year-one equity from $657 of loan paydown is wiped out by about $3k of value loss. Plan a longer hold.
- Alfalfa County population projected at +40% by 2050 — long-run rental-demand tailwind backs the buy-and-hold thesis.
- At projected returns (-2.6% appreciation + 3.0% rent growth), your $27k cash investment doubles in ~7 years — after that, you're playing with house money.
Negotiation context
- Only 10 days on market — expect competitive offers; lowballing is unlikely to land.
- Current owner paid $68k; 40% above their basis — modest negotiation headroom, anchor on the comps not their cost.
Risks & watch-outs
- Climate carrying-cost: extreme-heat days projected 7→19/yr by 2055 (HVAC capex compounding) — expect insurance premiums to compound above CPI over the hold.
Questions for the listing agent
- Built in 1968 — when were the roof, HVAC, electrical panel, plumbing, and water heater last replaced?
- Is there a deadline driving the sale (1031 exchange, divorce, estate, relocation)? That informs how much negotiation room exists.
- Schools are D-rated, which usually means shorter tenancies and higher turnover. Who's the typical renter profile here, and what's been the actual vacancy rate?
- What's the average days-on-market for RENTAL listings here right now (not sales)? A rising rental-DOM trend means longer vacancies and softer asking-rent achievability than the comps imply.
- What's the recent tenant-quality profile in this submarket — average credit score on applications, eviction rate, late-payment / NSF rate, and stable-employment percentage? A property-management company in the area should have these aggregated.
- How much new for-sale + rental construction is in the pipeline within 1–3 miles? Heavy new supply typically softens prices + rents 12–24 months out; constrained supply supports both.
Investment metrics
- 1% rule
- 1.33% ✓
- Cap rate
- 11.27%
- Cash-on-cash
- 17.77%
- DSCR
- 1.79
- GRM
- 6.3
CMA / ARV
- ARV (on-the-fly)
- $141,760
- Comps found
- 1
Show comp detail 1 sale within ~0.75 mi
| Address | Dist | Beds/Ba | Sqft | Sold | Price | $/sf | Match |
|---|---|---|---|---|---|---|---|
| 320 W 5th St | 0.30mi | 3/2.0 | 2,100 (-5%) | 22mo | $135,000 | $64 | 59 |
Match score weights: distance 35% · size 25% · config 20% · recency 20%. Top-matched comps best support the ARV.
Projected returns pro-forma
-2.65% appreciation · 3.0% rent growth · sell at horizon
- IRR
- 10.3%
- Equity multiple
- 1.42×
- Total profit
- $11,086
- Equity at exit
- $15,653
- IRR
- 18.8%
- Equity multiple
- 2.62×
- Total profit
- $43,120
- Equity at exit
- $10,794
Cash invested: $26,600 (down + closing). Projections, not guarantees.
Landlord ↔ Tenant lean methodology
- Overall (STATE)
- 83 Strongly Landlord-Friendly
- State Oklahoma
- 83 Strongly Landlord-Friendly · R+20
- County
- — inherits STATE
- City
- — inherits STATE
ZIP-level market 73741
- Home prices YoY
- -2.2%
- Active inventory
- 3
- Price-to-rent
- 6.3×
Monthly cashflow live
- Estimated rent
- $1,264 medium interval (Pro) →
- Mortgage (P&I)
- −$498
- Tax from tax record
- −$67 /mo · $805/yr
- Insurance
- −$40
- HOA
- −$0
- Vacancy / Maint / Mgmt
- −$266
- Net cashflow
- $394
Break-even live
UW: 25.0% down · 7.5% · 30yr · 1.5% tax · 5.0% vac · 8.0% maint · 8.0% mgmt
Financing live
Cash to close
- Down payment
- $23,750
- Closing costs
- $2,850
- Reserves months
- —
- Total cash needed
- —
Loan-product check · same deal, 3 products live
Conventional
25% down · 7.5% · 30yr
- Down + closing
- —
- Monthly P&I
- —
- Monthly cashflow
- —
- DSCR
- —
- Eligible?
- —
Personal DTI + credit; lowest rate.
DSCR
20% down · 8.5% · 30yr
- Down + closing
- —
- Monthly P&I
- —
- Monthly cashflow
- —
- DSCR
- —
- Eligible?
- —
No personal income docs; deal must DSCR.
Hard money
10% down · 12.0% · 12mo
- Down + closing
- —
- Monthly P&I
- —
- Monthly cashflow
- —
- DSCR
- —
- Eligible?
- —
Short-term bridge; refi at stabilization.
Listing history 19 events
-
2026-06-19days on market $95,000 Active 10 DOM
-
2026-06-18days on market $95,000 Active 9 DOM
-
2026-06-17days on market $95,000 Active 8 DOM
-
2026-06-16days on market $95,000 Active 7 DOM
-
2026-06-15days on market $95,000 Active 6 DOM
-
2026-06-14days on market $95,000 Active 4 DOM
-
2026-06-12days on market $95,000 Active 3 DOM
-
2026-06-09remarks 699-char remark
-
2026-06-09pricedays on market $95,000 Active 1 DOM
-
2026-06-08days on market $120,000 Active 27 DOM
-
2026-06-07days on market $120,000 Active 26 DOM
-
2026-06-03days on market $120,000 Active 22 DOM
-
2026-06-02days on market $120,000 Active 21 DOM
-
2026-06-01days on market $120,000 Active 20 DOM
-
2026-05-31days on market $120,000 Active 19 DOM
-
2026-05-30days on market $120,000 Active 18 DOM
-
2026-05-12$120,000 Active
-
2008-01-25soldstatus $68,000
-
2000-06-12soldstatus $49,000
ⓘ Source: listings_history table (triggers on properties + properties_extension) + one-shot
backfill from property_details.listing_events for pre-trigger history.
Tax reassessment forecast OK · Resets to sale price
- Current annual tax
- $805 · $67/mo
- Projected year-2 tax
- $855 · $71/mo
- Expected delta
- +$50/yr (+$4/mo · 6.2%)
ⓘ Screening estimate from a state-policy table — verify with the county assessor before closing.
Climate risk First Street
- Flood 1/10 Low 0% chance over 30 yrs
- Wildfire 1/10 Low
- Heat 6/10 Major 7 d/yr ≥107°F today · 19 d/yr by 30 yrs out
- Wind 2/10 Low 100% chance of damaging wind over 30 yrs
- Air quality 1/10 Low 0 unhealthy d/yr today · 0 by 30 yrs out
Nearby sold comps map
Loading sold comps map…
Walkable amenities ~0.75 mi
Loading nearby amenities…
Taxation est. · year 1
- Rental income
- $15,172
- − Mortgage interest
- −$5,321
- − Property taxes
- −$805
- − Insurance
- −$475
- − Repairs & maintenance
- −$1,214
- − Management
- −$1,214
- − Depreciation
- −$2,764
- Taxable income
- $3,380
- Est. tax owed @ 24.0%
- −$811
- After-tax cash flow
- $3,917/yr
For passive investors: Depreciation is non-cash, so a rental often shows a tax loss while cash-flowing — sheltering income. Rental losses are passive: they offset passive income freely, and up to $25,000/yr can offset ordinary (W-2) income if you actively participate and your MAGI is under $100k (phasing out to $0 by $150k); unused losses carry forward. On sale, claimed depreciation is recaptured at up to 25%, and gains may owe capital-gains tax (a 1031 exchange can defer both). Figures are a year-1 estimate at your 24.0% rate — not tax advice; consult a CPA.
Schools (NCES district)
- District
- Timberlake
- NCES district ID
- 4000013
- Math proficiency
- 45% ▬ 0.00%
- Reading proficiency
- 30% ▼ -10.00%
- Median HH income
- $46,887
- Composite
- 34.68/100
- National rank
- #10064
- State rank
- #130 of 513 in OK
Livability — Helena
- Score
- 68/100
- State rank
- #69
- US rank
- #9674
Category grades
Schools grade is shown separately in the Schools card above.
Census & demographics
- Census place
- Helena, OK
- Population (ZIP)
- 1,595
Population outlook (Alfalfa County) Hauer SSP2
- Today (2025)
- 6,473 people
- By 2030
- 6,888 · +6.4%
- By 2040
- 7,852 · +21.3%
- By 2050
- 9,078 · +40.2%
- By 2075
- 11,842 · +82.9%
- By 2100
- 12,675 · +95.8%
Race, ethnicity, and origin ACS 2023
- Neighborhood character
- Diverse neighborhood (Simpson 0.63)
- Race & ethnicity
- White 60% Two or more races 16% Black 11% Native American 9% Hispanic / Latino 7%
- Hispanic origin (detail)
- Mexican 3% Puerto Rican 3%
- Common ancestry
- Iranian 3% Slovak 2% Lithuanian 2%
- Foreign-born
- 2% · Canada
- Languages at home
- 92% English-only · Spanish 5%
Political lean MEDSL · Alfalfa
- 2024 margin
- Solid R (+76.6) · D 10.9% · R 87.5% · Other 1.5%
- 2008→2024 swing
- -10.4pp toward R · 2008: -66.2pp · 2024: -76.6pp
- All cycles
- 2024: R+76.6 2020: R+77.2 2016: R+76.0 2012: R+69.4 2008: R+66.2
Not yet ingested
- Civics
- —
Market trends
- HPI YoY
- ▼ -2.65%
- Current HPI
- 117.2936
- Rent YoY
- —
- Metro
- —
- State GDP YoY
- ▲ 1.55%
- F500 in state
- 6
Industry mix (Fortune 500 HQ in OK)
| Industry | F500 HQs | Revenue |
|---|---|---|
| Energy | 3 | $48B |
|
||
Price history
+144.9% since first listed3 events — show timeline
- 2026-05-12 Listed $120,000 FSBO.com
- 2008-01-25 Sold (Public Records) $68,000 Public Records
- 2000-06-12 Sold (Public Records) $49,000 Public Records
Property tax history
+4.9%/yrLatest (2025): $805 · +3.1% YoY. Source: county tax records.
Cash-flow waterfall
monthlySold comps — $/sqft
last 12 mo · ≤1 miLoading sold comps…