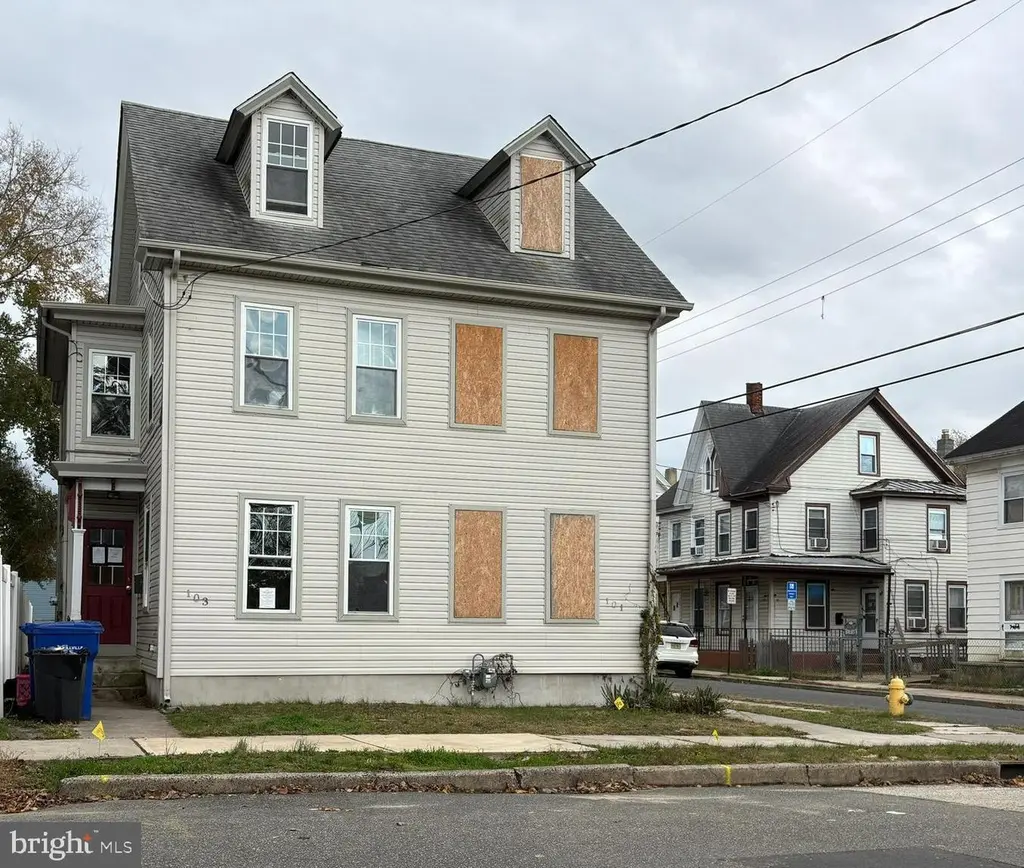
101 N 4th St · Millville, NJ
Flood risk 1/10 · Minimal
- FEMA flood zone
- X (unshaded)
- Chance of flooding over 30 yrs
- 0.0%
- Est. flood insurance / yr
- $507 – $1,088
Fire risk 6/10 · Moderate
- Est. fire insurance / yr
- $526 – $976
Heat risk 7/10 · Major
- Hot days now (above 103°F)
- 7 days/yr
- Hot days in 30 yrs
- 15 days/yr
Wind risk 6/10 · Moderate
- Chance of severe wind over 30 yrs
- 71.0%
Air-quality risk 3/10 · Minor
- Unhealthy air days now
- 2 days/yr
- Unhealthy air days in 30 yrs
- 4 days/yr
Risk factors via First Street. Map © Google.
Why this score? — see what drove the B+ grade
The composite is a weighted blend of 9 inputs, each scored 0–100. Each bar is that input's sub-score; the figure is the points it added to the 100-point composite (weight × sub-score).
- Cash flow +30.0/30.0
- ARV discount +15.0/15.0
- 1% rule +10.0/10.0
- DSCR +10.0/10.0
- Livability +3.2/5.0
- Rent growth +3.0/5.0
- Condition / age +2.5/5.0
- Schools +1.5/10.0
- Appreciation +0.0/10.0
$89,900
🖨 Deal sheet 📄 Offer letter ✓ Due diligence
Listing remarks MLS
As-is, where-is. * Buyer is responsible for any and all certifications as may be required by municipality as needed. Seller and listing agent make no representation regarding any information contained within or regarding the property. Buyer is responsible for verifying the accuracy of any and all information provided in the mls including but not limited to, room sizes, property amenities, property condition, functionality of any systems, property condition, functionality of any systems, etc.
Key facts
- Built 1917
- Listed 176 days
Neighborhood map
What this means for you Summary
Snapshot
- This is a 3-bed/2.0-bath townhouse listed at $90k.
Deal economics
- At list price, monthly cash flow is $656 ($8k/yr) — positive.
- The deal already cash-flows at list — no discount required.
- Meets the 1% rule at list price ($2k rent vs $90k).
- Recommended offer: $79k (12.0% below list) — sets the bar for market timing.
- Cap rate 15.0% vs local median 4.2% in Millville — top-decile yield for the area; either an underpriced asset or a hidden risk that comps aren't pricing in. Stress-test before assuming the spread holds.
Location & tenants
- Location reads 63/100 on livability (#431 in NJ) — a middle-class / working-renter tenant base. Strengths: housing A+, health & safety B+; Watch: schools F, crime F, amenities F.
- Millville School District (suburban): math 6% / reading 28% proficiency, ranked #447 of 472 in NJ (top 95%) — low school quality limits family demand, transient renter base, plan for 1-2y turnover; 60% free/reduced lunch — lower-income household profile, screen leases tightly.
- Market conditions: Rents rising (+1.9%/yr); 296 active listings in the ZIP; 3 comparable units currently listed for rent nearby; rentals lingering (median 44d on market — plan ~5-8 weeks vacancy on turnover, expect pricing pressure); 67% of comp listings sitting > 30 days — soft ceiling on asking rent; 216 units permitted in Cumberland County in 2024 (73 in 5+ unit buildings).
- This rent runs 30% of the median local income ($67k/yr) — at the standard rent-burdened threshold; future hikes will face affordability resistance.
Forward outlook
- Local home prices are declining (-3.0%/yr); year-one equity from $622 of loan paydown is wiped out by about $3k of value loss. Plan a longer hold.
- Cumberland County population projected to shrink 7% by 2050 — rents likely to lag national; underwrite the cash flow, not the appreciation.
- At projected returns (-3.0% appreciation + 1.9% rent growth), your $25k cash investment doubles in ~4 years — after that, you're playing with house money.
Negotiation context
- It's been on market 176 days — a 12% lower offer ($79k) is reasonable based on typical stale-listing flexibility.
Risks & watch-outs
- Watch-outs: built in 1917 — expect roof / HVAC / electrical / plumbing capex.
- Climate carrying-cost: major wind risk, 71% chance of damaging wind over 30y; major wildfire risk; extreme-heat days projected 7→15/yr by 2055 (HVAC capex compounding) — expect insurance premiums to compound above CPI over the hold.
Questions for the listing agent
- It's been on market 176 days. Have you received any prior offers? Is the seller open to a 12% concession, seller financing, or rate buy-down credit?
- Built in 1917 — when were the roof, HVAC, electrical panel, plumbing, and water heater last replaced?
- Why hasn't it sold? Are there any deal-killer items the seller is aware of (foundation, flood, title, zoning, code violations)?
- Is there a deadline driving the sale (1031 exchange, divorce, estate, relocation)? That informs how much negotiation room exists.
- Schools are F-rated, which usually means shorter tenancies and higher turnover. Who's the typical renter profile here, and what's been the actual vacancy rate?
- Crime grade is F in this area — have there been break-ins, vandalism, or insurance claims at this property in the last 3 years? What carrier currently insures it and at what premium?
- What's the average days-on-market for RENTAL listings here right now (not sales)? A rising rental-DOM trend means longer vacancies and softer asking-rent achievability than the comps imply.
- What's the recent tenant-quality profile in this submarket — average credit score on applications, eviction rate, late-payment / NSF rate, and stable-employment percentage? A property-management company in the area should have these aggregated.
- How much new for-sale + rental construction is in the pipeline within 1–3 miles? Heavy new supply typically softens prices + rents 12–24 months out; constrained supply supports both.
Investment metrics
- 1% rule
- 1.90% ✓
- Cap rate
- 15.04%
- Cash-on-cash
- 31.26%
- DSCR
- 2.39
- GRM
- 4.4
CMA / ARV
- ARV (on-the-fly)
- $143,608
- Comps found
- 12
Show comp detail 12 sales within ~0.75 mi
| Address | Dist | Beds/Ba | Sqft | Sold | Price | $/sf | Match |
|---|---|---|---|---|---|---|---|
| 610 E Pine St | 0.19mi | 4/1.5 (+1) | 1,200 (-3%) | 6mo | $197,500 | $165 | 74 |
| 302 S 6th St S S | 0.26mi | 3/1.0 | 1,347 (+9%) | 0mo | $127,500 | $95 | 69 |
| 707 E Main St | 0.25mi | 3/2.0 | 1,363 (+10%) | 12mo | $180,000 | $132 | 61 |
| 712 3rd St N | 0.53mi | 3/1.0 | 1,316 (+6%) | 3mo | $81,900 | $62 | 58 |
| 807 N 2nd St | 0.59mi | 2/1.0 (-1) | 1,259 (+2%) | 6mo | $75,000 | $60 | 56 |
| 515 N 5th St | 0.34mi | 3/1.0 | 1,100 (-11%) | 8mo | $160,000 | $145 | 55 |
| 19 E Mcneal St | 0.68mi | 4/1.5 (+1) | 1,273 (+3%) | 3mo | $200,000 | $157 | 54 |
| 315 S 3rd St | 0.31mi | 3/1.0 | 1,076 (-13%) | 11mo | $125,000 | $116 | 50 |
| 510 Dock St | 0.52mi | 3/1.0 | 1,324 (+7%) | 13mo | $140,000 | $106 | 49 |
| 708 High St N | 0.60mi | 3/1.0 | 1,316 (+6%) | 11mo | $170,000 | $129 | 48 |
| 645 Buck St | 0.59mi | 3/1.0 | 1,326 (+7%) | 14mo | $126,000 | $95 | 46 |
| 550 Columbia Ave | 0.58mi | 3/1.0 | 1,396 (+13%) | 5mo | $155,000 | $111 | 44 |
Match score weights: distance 35% · size 25% · config 20% · recency 20%. Top-matched comps best support the ARV.
Projected returns pro-forma
-3.0% appreciation · 1.94% rent growth · sell at horizon
- IRR
- 24.9%
- Equity multiple
- 2.01×
- Total profit
- $25,462
- Equity at exit
- $13,404
- IRR
- 32.0%
- Equity multiple
- 3.74×
- Total profit
- $68,998
- Equity at exit
- $7,773
Cash invested: $25,172 (down + closing). Projections, not guarantees.
Landlord ↔ Tenant lean methodology
- Overall (STATE)
- 21 Tenant-Leaning
- State New Jersey
- 21 Tenant-Leaning · D+6
- County
- — inherits STATE
- City
- — inherits STATE
ZIP-level market 08332
- Home prices YoY
- -28.9%
- Rents YoY
- 1.9%
- Active inventory
- 296
- Price-to-rent
- 4.4×
Monthly cashflow live
- Estimated rent
- $1,704 medium interval (Pro) →
- Mortgage (P&I)
- −$471
- Tax from tax record
- −$182 /mo · $2,178/yr
- Insurance
- −$37
- HOA
- −$0
- Vacancy / Maint / Mgmt
- −$358
- Net cashflow
- $656
Break-even live
UW: 25.0% down · 7.5% · 30yr · 1.5% tax · 5.0% vac · 8.0% maint · 8.0% mgmt
Financing live
Cash to close
- Down payment
- $22,475
- Closing costs
- $2,697
- Reserves months
- —
- Total cash needed
- —
Loan-product check · same deal, 3 products live
Conventional
25% down · 7.5% · 30yr
- Down + closing
- —
- Monthly P&I
- —
- Monthly cashflow
- —
- DSCR
- —
- Eligible?
- —
Personal DTI + credit; lowest rate.
DSCR
20% down · 8.5% · 30yr
- Down + closing
- —
- Monthly P&I
- —
- Monthly cashflow
- —
- DSCR
- —
- Eligible?
- —
No personal income docs; deal must DSCR.
Hard money
10% down · 12.0% · 12mo
- Down + closing
- —
- Monthly P&I
- —
- Monthly cashflow
- —
- DSCR
- —
- Eligible?
- —
Short-term bridge; refi at stabilization.
Rent comps 3 comps
| Address | Beds | Baths | Sqft | Rent | $/sqft | DOM | Units | Dist |
|---|---|---|---|---|---|---|---|---|
| 112 W Main St Unit B Millville, NJ | 3.0 | 1.0 | 1384 | $1,500 | $1.08 | 43d | 1 | 0.48mi |
| 313 W Main St Millville, NJ | 3.0 | 1.5 | 1265 | $1,650 | $1.30 | 43d | 1 | 0.68mi |
| 301 N Wade Blvd Millville, NJ | 1.0–2.0 | 1.0 | 1005 | $1,715 | $1.71 | 13d | 10 | 0.95mi |
Listing history 12 events
-
2026-06-13status $89,900 Pending 176 DOM
-
2026-06-10status $89,900 Active Under Contract 176 DOM
-
2026-06-09days on market $89,900 Active 176 DOM
-
2026-06-08days on market $89,900 Active 175 DOM
-
2026-06-07days on market $89,900 Active 174 DOM
-
2026-06-02days on market $89,900 Active 169 DOM
-
2026-06-01days on market $89,900 Active 168 DOM
-
2026-05-31days on market $89,900 Active 167 DOM
-
2026-05-30days on market $89,900 Active 166 DOM
-
2026-05-14price $89,900 497-char remark
Show marketing remark (497 chars)
As-is, where-is. * Buyer is responsible for any and all certifications as may be required by municipality as needed. Seller and listing agent make no representation regarding any information contained within or regarding the property. Buyer is responsible for verifying the accuracy of any and all information provided in the mls including but not limited to, room sizes, property amenities, property condition, functionality of any systems, property condition, functionality of any systems, etc.
-
2025-12-15$154,900 Active 497-char remark
Show marketing remark (497 chars)
As-is, where-is. * Buyer is responsible for any and all certifications as may be required by municipality as needed. Seller and listing agent make no representation regarding any information contained within or regarding the property. Buyer is responsible for verifying the accuracy of any and all information provided in the mls including but not limited to, room sizes, property amenities, property condition, functionality of any systems, property condition, functionality of any systems, etc.
-
2005-05-03soldstatus $110,000
ⓘ Source: listings_history table (triggers on properties + properties_extension) + one-shot
backfill from property_details.listing_events for pre-trigger history.
Tax reassessment forecast NJ · Partial reset (capped growth)
- Current annual tax
- $2,178 · $182/mo
- Projected year-2 tax
- $2,208 · $184/mo
- Expected delta
- +$30/yr (+$3/mo · 1.4%)
ⓘ Screening estimate from a state-policy table — verify with the county assessor before closing.
Climate risk First Street
- Flood 1/10 Low FEMA zone X (unshaded) · 0% chance over 30 yrs
- Wildfire 6/10 Major
- Heat 7/10 Severe 7 d/yr ≥103°F today · 15 d/yr by 30 yrs out
- Wind 6/10 Major 71% chance of damaging wind over 30 yrs
- Air quality 3/10 Moderate 2 unhealthy d/yr today · 4 by 30 yrs out
Nearby sold comps map
Loading sold comps map…
Walkable amenities ~0.75 mi
Loading nearby amenities…
Taxation est. · year 1
- Rental income
- $20,447
- − Mortgage interest
- −$5,036
- − Property taxes
- −$2,178
- − Insurance
- −$450
- − Repairs & maintenance
- −$1,636
- − Management
- −$1,636
- − Depreciation
- −$2,615
- Taxable income
- $6,897
- Est. tax owed @ 24.0%
- −$1,655
- After-tax cash flow
- $6,213/yr
For passive investors: Depreciation is non-cash, so a rental often shows a tax loss while cash-flowing — sheltering income. Rental losses are passive: they offset passive income freely, and up to $25,000/yr can offset ordinary (W-2) income if you actively participate and your MAGI is under $100k (phasing out to $0 by $150k); unused losses carry forward. On sale, claimed depreciation is recaptured at up to 25%, and gains may owe capital-gains tax (a 1031 exchange can defer both). Figures are a year-1 estimate at your 24.0% rate — not tax advice; consult a CPA.
Schools (NCES district)
- District
- Millville School District
- NCES district ID
- 3410320
- Math proficiency
- 6% ▼ -11.00%
- Reading proficiency
- 28% ▲ 1.00%
- Median HH income
- $48,851
- Composite
- 15.23/100
- National rank
- #9338
- State rank
- #447 of 472 in NJ
Livability — Millville
- Score
- 63/100
- State rank
- #431
- US rank
- #15561
Category grades
Schools grade is shown separately in the Schools card above.
Census & demographics
- Census place
- Millville, NJ
- County
- Cumberland County · 80,266 people
- City population
- 35,228
- Metro
- Vineland-Bridgeton, NJ
- Population (ZIP)
- 35,228
- Household income
- $67,496
- Rent vs Own
- Severe rent burden
- 1761.0
Population outlook (Cumberland County) Hauer SSP2
- Today (2025)
- 152,743 people
- By 2030
- 150,373 · -1.6%
- By 2040
- 146,881 · -3.8%
- By 2050
- 142,653 · -6.6%
- By 2075
- 129,468 · -15.2%
- By 2100
- 107,456 · -29.6%
Race, ethnicity, and origin ACS 2023
- Neighborhood character
- Diverse neighborhood (Simpson 0.60)
- Race & ethnicity
- White 59% Hispanic / Latino 17% Black 15% Two or more races 11% Asian 2%
- Hispanic origin (detail)
- Mexican 4% Puerto Rican 10%
- Common ancestry
- Romanian 4% Lithuanian 2% Slovak 1%
- Foreign-born
- 7% · Canada
- Languages at home
- 85% English-only · Spanish 11% Other Indo-European 1% Other Asian/Pacific 1%
Political lean MEDSL · Cumberland
- 2024 margin
- Toss-up / Even · D 47.6% · R 51.3% · Other 1.1%
- 2008→2024 swing
- -25.4pp toward R · 2008: 21.6pp · 2024: -3.8pp
- All cycles
- 2024: R+3.8 2020: D+6.0 2016: D+5.3 2012: D+23.1 2008: D+21.6
Not yet ingested
- Civics
- —
Market trends
- HPI YoY
- ▼ -111.45%
- Current HPI
- 274.8011
- Rent YoY
- ▲ 1.94%
- Metro
- Vineland-Bridgeton, NJ
- State GDP YoY
- ▲ 2.05%
- F500 in state
- 34
Industry mix (Fortune 500 HQ in NJ)
| Industry | F500 HQs | Revenue |
|---|---|---|
| Consumer Goods | 3 | $31B |
|
||
| Pharmaceuticals | 2 | $153B |
|
||
| Technology | 2 | $21B |
|
||
| Insurance | 2 | $20B |
|
||
| Healthcare | 2 | $19B |
|
||
| Financial Services | 1 | $70B |
|
||
Price history
-18.3% since first listed3 events — show timeline
- 2026-05-14 Price Changed $89,900 BRIGHT MLS
- 2025-12-15 Listed $154,900 BRIGHT MLS
- 2005-05-03 Sold (Public Records) $110,000 Public Records
Property tax history
+2.0%/yrLatest (2024): $2,178 · +0.8% YoY. Source: county tax records.
Cash-flow waterfall
monthlySold comps — $/sqft
last 12 mo · ≤1 miLoading sold comps…