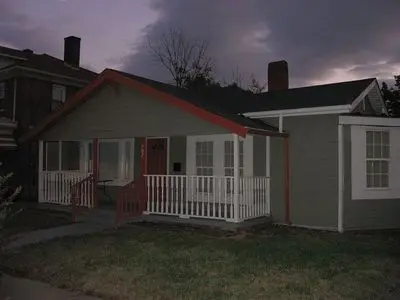
702 Linwood Ave · Durham, NC
Flood risk 1/10 · Minimal
- FEMA flood zone
- X (unshaded)
- Chance of flooding over 30 yrs
- 0.0%
- Est. flood insurance / yr
- $507 – $1,088
Fire risk 1/10 · Minimal
- Est. fire insurance / yr
- $906 – $1,684
Heat risk 6/10 · Moderate
- Hot days now (above 106°F)
- 7 days/yr
- Hot days in 30 yrs
- 16 days/yr
Wind risk 6/10 · Moderate
- Chance of severe wind over 30 yrs
- 27.0%
Air-quality risk 2/10 · Minimal
- Unhealthy air days now
- 1 days/yr
- Unhealthy air days in 30 yrs
- 1 days/yr
Risk factors via First Street. Map © Google.
Why this score? — see what drove the C- grade
The composite is a weighted blend of 9 inputs, each scored 0–100. Each bar is that input's sub-score; the figure is the points it added to the 100-point composite (weight × sub-score).
- ARV discount +15.0/15.0
- Cash flow +14.8/30.0
- DSCR +4.5/10.0
- Livability +4.0/5.0
- 1% rule +3.5/10.0
- Rent growth +3.3/5.0
- Schools +3.0/10.0
- Condition / age +2.5/5.0
- Appreciation +0.0/10.0
$239,999
🖨 Deal sheet (PDF) 📄 Offer letter ✓ Due diligence
Listing remarks MLS
VERBAL OFFER HAS BEEN ACCEPTED. .. WAITING FOR CORPORATE SELLER SIGNATURES 4 bedroom, 1.5 bath, home located convenient to NCCU and Lincoln center. Large rocking chair front porch. Great investment property or 1st time home owner, large rooms.
Key facts
- Downtown durham
- Near nccu's campus
- Bathroom remodel
Tags
Property features AI
Exterior
- Home design: Built in 1930
- Construction: Original construction from 1930
- Exterior features: Located in the Hayti District
Neighborhood map
What this means for you Summary
Snapshot
- This is a 3-bed/1.0-bath single-family listed at $240k.
Deal economics
- At list price, monthly cash flow is $68 ($814/yr) — positive.
- The deal already cash-flows at list — no discount required.
- To meet the 1% rule (rent ≥ 1% of price), the offer needs to be $204k (14.8% below list).
- Recommended offer: $204k (14.8% below list) — sets the bar for 1% rule.
- Cap rate 6.6% vs local median 3.0% in Durham — top-decile yield for the area; either an underpriced asset or a hidden risk that comps aren't pricing in. Stress-test before assuming the spread holds.
Location & tenants
- Location reads 81/100 on livability (#15 in NC, #1,411 nationally) — a professional / high-income tenant draw. Strengths: amenities A+, commute A+, housing A+; Watch: schools D+, crime F.
- Durham Public Schools (urban): math 29% / reading 39% proficiency, ranked #132 of 178 in NC (top 74%) — families likely to look elsewhere, expect single-tenant / working-renter base with shorter leases.
- Market conditions: Rents rising (+3.2%/yr); 197 active listings in the ZIP; 40 comparable units currently listed for rent nearby; rentals at typical pace (median 25d on market — plan ~3-4 weeks tenant-placement turnaround); 2,905 units permitted in Durham County in 2024 (955 in 5+ unit buildings).
- This rent runs 35% of the median local income ($70k/yr) — at the standard rent-burdened threshold; future hikes will face affordability resistance.
Forward outlook
- Local home prices are declining (-3.0%/yr); year-one equity from $2k of loan paydown is wiped out by about $7k of value loss. Plan a longer hold.
- Durham County population projected at +44% by 2050 — long-run rental-demand tailwind backs the buy-and-hold thesis.
Negotiation context
- It's been on market 30 days — a 2% lower offer ($236k) is reasonable based on typical stale-listing flexibility.
- 5 sale attempts since 20y ago with the ask held roughly flat each time — persistent listings suggest the price (not the market) is what's stuck; bring a comps-based counter.
- Current owner paid $73k; list at $240k implies a 229% gain — meaningful room to come down on a strong offer.
Risks & watch-outs
- Watch-outs: built in 1930 — expect roof / HVAC / electrical / plumbing capex.
- Climate carrying-cost: major wind risk, 27% chance of damaging wind over 30y; extreme-heat days projected 7→16/yr by 2055 (HVAC capex compounding) — expect insurance premiums to compound above CPI over the hold.
Questions for the listing agent
- Built in 1930 — when were the roof, HVAC, electrical panel, plumbing, and water heater last replaced?
- Is there a deadline driving the sale (1031 exchange, divorce, estate, relocation)? That informs how much negotiation room exists.
- Schools are D-rated, which usually means shorter tenancies and higher turnover. Who's the typical renter profile here, and what's been the actual vacancy rate?
- Crime grade is F in this area — have there been break-ins, vandalism, or insurance claims at this property in the last 3 years? What carrier currently insures it and at what premium?
- What's the average days-on-market for RENTAL listings here right now (not sales)? A rising rental-DOM trend means longer vacancies and softer asking-rent achievability than the comps imply.
- What's the recent tenant-quality profile in this submarket — average credit score on applications, eviction rate, late-payment / NSF rate, and stable-employment percentage? A property-management company in the area should have these aggregated.
- How much new for-sale + rental construction is in the pipeline within 1–3 miles? Heavy new supply typically softens prices + rents 12–24 months out; constrained supply supports both.
Investment metrics
- 1% rule
- 0.85% ✗
- Cap rate
- 6.63%
- Cash-on-cash
- 1.21%
- DSCR
- 1.05
- GRM
- 9.8
CMA / ARV
- ARV (on-the-fly)
- $309,456
- Comps found
- 12
Show comp detail 12 sales within ~0.75 mi
| Address | Dist | Beds/Ba | Sqft | Sold | Price | $/sf | Match |
|---|---|---|---|---|---|---|---|
| 608 E Umstead St | 0.14mi | 3/2.5 | 1,200 (-2%) | 2mo | $250,000 | $208 | 82 |
| 911 Grant St | 0.15mi | 2/2.5 (-1) | 1,190 (-3%) | 4mo | $302,000 | $254 | 73 |
| 915 Grant St | 0.15mi | 2/2.5 (-1) | 1,190 (-3%) | 6mo | $296,400 | $249 | 72 |
| 913b Grant St | 0.15mi | 2/2.5 (-1) | 1,190 (-3%) | 6mo | $290,000 | $244 | 72 |
| 311 Burnette St | 0.25mi | 4/2.5 (+1) | 1,268 (+3%) | 2mo | $253,500 | $200 | 70 |
| 801 Dupree St | 0.25mi | 3/2.5 | 1,268 (+3%) | 8mo | $338,500 | $267 | 70 |
| 423 Eugene St | 0.48mi | 3/2.5 | 1,222 (-0%) | 2mo | $308,000 | $252 | 69 |
| 421 Eugene St Unit A | 0.48mi | 3/2.5 | 1,193 (-3%) | 2mo | $305,000 | $256 | 65 |
| 513 Grant St | 0.35mi | 4/2.0 (+1) | 1,316 (+7%) | 6mo | $180,000 | $137 | 58 |
| 2207-A Otis St | 0.72mi | 3/2.5 | 1,195 (-3%) | 1mo | $365,000 | $305 | 55 |
| 905 Scout Dr | 0.56mi | 3/3.0 | 1,341 (+9%) | 7mo | $417,500 | $311 | 44 |
| 206 S Goley St | 0.68mi | 4/1.0 (+1) | 1,062 (-14%) | 8mo | $90,000 | $85 | 34 |
Match score weights: distance 35% · size 25% · config 20% · recency 20%. Top-matched comps best support the ARV.
Projected returns pro-forma
-3.0% appreciation · 3.25% rent growth · sell at horizon
- IRR
- -14.1%
- Equity multiple
- 0.49×
- Total profit
- $-34,091
- Equity at exit
- $35,785
- IRR
- -5.0%
- Equity multiple
- 0.67×
- Total profit
- $-22,149
- Equity at exit
- $20,751
Cash invested: $67,200 (down + closing). Projections, not guarantees.
Landlord ↔ Tenant lean methodology
- Overall (STATE)
- 85 Strongly Landlord-Friendly
- State North Carolina
- 85 Strongly Landlord-Friendly · R+3
- County
- — inherits STATE
- City
- — inherits STATE
ZIP-level market 27701
- Rents YoY
- 3.2%
- Active inventory
- 197
- Price-to-rent
- 9.8×
Monthly cashflow live
- Estimated rent
- $2,044 high interval (Pro) →
- Mortgage (P&I)
- −$1,259
- Tax from tax record
- −$189 /mo · $2,265/yr
- Insurance
- −$100
- HOA
- −$0
- Vacancy / Maint / Mgmt
- −$429
- Net cashflow
- $68
Break-even live
Sensitivity live
| Price | -10% $204 | -5% $136 | +0% $68 | +5% $0 | +10% $-68 |
|---|---|---|---|---|---|
| Rent | -10% $-94 | -5% $-13 | +0% $68 | +5% $149 | +10% $229 |
| Rate | -1.0pp $189 | -0.5pp $129 | base $68 | +0.5pp $6 | +1.0pp $-58 |
UW: 25.0% down · 7.5% · 30yr · 1.5% tax · 5.0% vac · 8.0% maint · 8.0% mgmt
Financing live
Cash to close
- Down payment
- $60,000
- Closing costs
- $7,200
- Reserves months
- —
- Total cash needed
- —
Loan-product check · same deal, 3 products live
Conventional
25% down · 7.5% · 30yr
- Down + closing
- —
- Monthly P&I
- —
- Monthly cashflow
- —
- DSCR
- —
- Eligible?
- —
Personal DTI + credit; lowest rate.
DSCR
20% down · 8.5% · 30yr
- Down + closing
- —
- Monthly P&I
- —
- Monthly cashflow
- —
- DSCR
- —
- Eligible?
- —
No personal income docs; deal must DSCR.
Hard money
10% down · 12.0% · 12mo
- Down + closing
- —
- Monthly P&I
- —
- Monthly cashflow
- —
- DSCR
- —
- Eligible?
- —
Short-term bridge; refi at stabilization.
Rent comps 40 comps
| Address | Beds | Baths | Sqft | Rent | $/sqft | DOM | Units | Dist |
|---|---|---|---|---|---|---|---|---|
| 514 E Umstead St Durham, NC | 3.0 | 2.0 | 1134 | $1,625 | $1.43 | 24d | 1 | 0.12mi |
| 1000 Linwood Ave Durham, NC | 3.0 | 2.0 | 1150 | $2,400 | $2.09 | 15d | 1 | 0.22mi |
| 701 Grant St Durham, NC | 3.0 | 2.0 | 1145 | $1,850 | $1.62 | 24d | 1 | 0.22mi |
| 411 Dunstan Ave Durham, NC | 3.0 | 2.0 | 1091 | $2,500 | $2.29 | 24d | 1 | 0.26mi |
| 3 Fisher Pl Durham, NC | 2.0 | 1.5 | 752 | $1,100 | $1.46 | 24d | 1 | 0.30mi |
| 813 Dupree St Durham, NC | 2.0 | 2.0 | 1027 | $1,650 | $1.61 | 15d | 1 | 0.32mi |
| 1012 S Alston Ave Apt C Durham, NC | 2.0 | 1.0 | 750 | $1,150 | $1.53 | 24d | 1 | 0.35mi |
| 401 Moline St Durham, NC | 4.0 | 2.0 | 1288 | $1,995 | $1.55 | 24d | 1 | 0.35mi |
| 1301 S Alston Ave Durham, NC | 2.0 | 1.0 | 994 | $1,495 | $1.50 | 15d | 1 | 0.46mi |
| 1313 S Alston Ave Durham, NC | 3.0 | 1.0 | 1350 | $1,750 | $1.30 | 15d | 1 | 0.49mi |
| 703 S Roxboro St Durham, NC | 2.0 | 1.0–2.0 | 1113 | $1,696 | $1.52 | 24d | 16 | 0.52mi |
| 1114 South St Durham, NC | 3.0 | 2.5 | 1418 | $3,000 | $2.12 | 24d | 1 | 0.55mi |
| 510 E Pettigrew St Durham, NC | 3.0 | 1.0–2.0 | 996 | $3,130 | $3.14 | 15d | 29 | 0.57mi |
| 504 E Pettigrew St Durham, NC | 2.0 | 1.0–2.0 | 1025 | $2,219 | $2.16 | 15d | 35 | 0.62mi |
| 504 E Pettigrew St Durham, NC | 3.0 | 1.0–2.0 | 1092 | $2,528 | $2.32 | 22d | 30 | 0.62mi |
| 1107 Dayton St Durham, NC | 2.0 | 1.5 | 1050 | $1,350 | $1.29 | 15d | 1 | 0.63mi |
| 1107 Dayton St Durham, NC | 2.0 | 1.5 | 1050 | $1,350 | $1.29 | 24d | 1 | 0.63mi |
| 441 S Dillard St Durham, NC | 1.0–3.0 | 1.0–2.5 | 1153 | $3,389 | $2.94 | 15d | 21 | 0.66mi |
| 464 E Pettigrew St Durham, NC | 2.0 | 2.0 | 1091 | $2,786 | $2.55 | 15d | 1 | 0.68mi |
| 1515 S Alston Ave Durham, NC | 4.0 | 2.0 | 1400 | $2,580 | $1.84 | 24d | 1 | 0.69mi |
| 520 Cecil St Durham, NC | 3.0 | 1.0 | 900 | $1,800 | $2.00 | 15d | 1 | 0.70mi |
| 800 Fargo St Unit B1 Durham, NC | 2.0 | 2.0 | 1112 | $1,780 | $1.60 | 24d | 1 | 0.70mi |
| 500 E Main St Durham, NC | 3.0 | 1.0–2.0 | 1002 | $3,556 | $3.55 | 15d | 40 | 0.73mi |
| 1819 Cecil St Durham, NC | 3.0 | 2.0 | 1105 | $1,795 | $1.62 | 24d | 1 | 0.74mi |
| 704 Bacon St Durham, NC | 2.0 | 1.0 | 744 | $1,495 | $2.01 | 24d | 1 | 0.74mi |
| 511 S Mangum St Durham, NC | 3.0 | 1.0–2.0 | 1159 | $4,115 | $3.55 | 15d | 29 | 0.78mi |
| 515 Burlington Ave Unit A Durham, NC | 2.0 | 1.0 | 763 | $1,200 | $1.57 | 24d | 1 | 0.81mi |
| 2305 Fitzgerald Ave Durham, NC | 3.0 | 2.5 | 1408 | $2,000 | $1.42 | 24d | 1 | 0.82mi |
| 1002 Bacon St Durham, NC | 3.0 | 2.0 | 1028 | $1,850 | $1.80 | 24d | 1 | 0.91mi |
| 1301 Vickers Ave Durham, NC | 2.0 | 2.0 | 1193 | $2,100 | $1.76 | 24d | 1 | 0.92mi |
| 603 N Elm St Unit A Durham, NC | 3.0 | 2.0 | 1200 | $1,495 | $1.25 | 24d | 1 | 0.93mi |
| 1809 E Main St Durham, NC | 3.0 | 1.0 | 1200 | $1,700 | $1.42 | 15d | 1 | 0.95mi |
| 721 Liberty St Unit C Durham, NC | 2.0 | 1.0 | 800 | $1,495 | $1.87 | 24d | 1 | 0.96mi |
| 109 W Main St #402 Durham, NC | 2.0 | 1.5 | 1296 | $2,695 | $2.08 | 24d | 1 | 1.01mi |
| 406 N Hyde Park Ave Durham, NC | 3.0 | 1.0 | 1160 | $1,730 | $1.49 | 22d | 1 | 1.04mi |
| 110 N Corcoran St Durham, NC | 1.0–2.0 | 1.0–2.0 | 1219 | $4,594 | $3.77 | 15d | 8 | 1.04mi |
| 600 Willard St Durham, NC | 2.0 | 2.0 | 1480 | $2,625 | $1.77 | 24d | 1 | 1.09mi |
| 501 Willard St Durham, NC | 2.0 | 1.0–2.0 | 817 | $2,204 | $2.70 | 15d | 26 | 1.10mi |
| 600 S Duke St #14 Durham, NC | 2.0 | 2.0 | 915 | $2,000 | $2.19 | 24d | 1 | 1.11mi |
| 2727 Atlantic St Durham, NC | 3.0 | 1.0 | 1036 | $1,595 | $1.54 | 15d | 1 | 1.13mi |
Listing history 28 events
-
2026-06-18days on market $239,999 Active 30 DOM
-
2026-06-17days on market $239,999 Active 29 DOM
-
2026-06-16days on market $239,999 Active 28 DOM
-
2026-06-15days on market $239,999 Active 27 DOM
-
2026-06-14days on market $239,999 Active 25 DOM
-
2026-06-10days on market $239,999 Active 22 DOM
-
2026-06-09days on market $239,999 Active 21 DOM
-
2026-06-08days on market $239,999 Active 20 DOM
-
2026-06-07days on market $239,999 Active 19 DOM
-
2026-06-05days on market $239,999 Active 16 DOM
-
2026-06-03days on market $239,999 Active 15 DOM
-
2026-06-02days on market $239,999 Active 14 DOM
-
2026-06-01days on market $239,999 Active 13 DOM
-
2026-05-31days on market $239,999 Active 12 DOM
-
2026-05-30days on market $239,999 Active 11 DOM
-
2026-05-19$239,999 Active
-
2017-02-28soldstatus $73,000
-
2008-05-14soldstatus $50,000 243-char remark
Show marketing remark (243 chars)
VERBAL OFFER HAS BEEN ACCEPTED. .. WAITING FOR CORPORATE SELLER SIGNATURES 4 bedroom, 1.5 bath, home located convenient to NCCU and Lincoln center. Large rocking chair front porch. Great investment property or 1st time home owner, large rooms.
-
2008-04-21historical 243-char remark
Show marketing remark (243 chars)
VERBAL OFFER HAS BEEN ACCEPTED. .. WAITING FOR CORPORATE SELLER SIGNATURES 4 bedroom, 1.5 bath, home located convenient to NCCU and Lincoln center. Large rocking chair front porch. Great investment property or 1st time home owner, large rooms.
-
2008-04-09$52,900 243-char remark
Show marketing remark (243 chars)
VERBAL OFFER HAS BEEN ACCEPTED. .. WAITING FOR CORPORATE SELLER SIGNATURES 4 bedroom, 1.5 bath, home located convenient to NCCU and Lincoln center. Large rocking chair front porch. Great investment property or 1st time home owner, large rooms.
-
2006-10-06soldstatus $37,000 120-char remark
Show marketing remark (120 chars)
Good rental property or for Owner Occupant with 4 bedrooms and 1 1/2 bath. Corner lot. 2 parking spaces. Needs some TLC.
-
2006-10-06soldstatus $37,000 120-char remark
Show marketing remark (120 chars)
Good rental property or for Owner Occupant with 4 bedrooms and 1 1/2 bath. Corner lot. 2 parking spaces. Needs some TLC.
-
2006-09-12historical 120-char remark
Show marketing remark (120 chars)
Good rental property or for Owner Occupant with 4 bedrooms and 1 1/2 bath. Corner lot. 2 parking spaces. Needs some TLC.
-
2006-03-30$39,900 120-char remark
Show marketing remark (120 chars)
Good rental property or for Owner Occupant with 4 bedrooms and 1 1/2 bath. Corner lot. 2 parking spaces. Needs some TLC.
-
2006-03-30$39,900 120-char remark
Show marketing remark (120 chars)
Good rental property or for Owner Occupant with 4 bedrooms and 1 1/2 bath. Corner lot. 2 parking spaces. Needs some TLC.
-
2003-10-28soldstatus $93,000
ⓘ Source: listings_history table (triggers on properties + properties_extension) + one-shot
backfill from property_details.listing_events for pre-trigger history.
Tax reassessment forecast NC · Resets to sale price
- Current annual tax
- $2,265 · $189/mo
- Projected year-2 tax
- $2,265 · $189/mo
- Expected delta
- $0/yr ($0/mo · 0.0%)
ⓘ Screening estimate from a state-policy table — verify with the county assessor before closing.
Climate risk First Street
- Flood 1/10 Low FEMA zone X (unshaded) · 0% chance over 30 yrs
- Wildfire 1/10 Low
- Heat 6/10 Major 7 d/yr ≥106°F today · 16 d/yr by 30 yrs out
- Wind 6/10 Major 27% chance of damaging wind over 30 yrs
- Air quality 2/10 Low 1 unhealthy d/yr today · 1 by 30 yrs out
Nearby sold comps map
Loading sold comps map…
Walkable amenities ~0.75 mi
Loading nearby amenities…
Taxation est. · year 1
- Rental income
- $24,534
- − Mortgage interest
- −$13,444
- − Property taxes
- −$2,265
- − Insurance
- −$1,200
- − Repairs & maintenance
- −$1,963
- − Management
- −$1,963
- − Depreciation
- −$6,982
- Taxable loss
- −$3,282
- Est. tax savings @ 24.0%
- +$788
- After-tax cash flow
- $1,602/yr
For passive investors: Depreciation is non-cash, so a rental often shows a tax loss while cash-flowing — sheltering income. Rental losses are passive: they offset passive income freely, and up to $25,000/yr can offset ordinary (W-2) income if you actively participate and your MAGI is under $100k (phasing out to $0 by $150k); unused losses carry forward. On sale, claimed depreciation is recaptured at up to 25%, and gains may owe capital-gains tax (a 1031 exchange can defer both). Figures are a year-1 estimate at your 24.0% rate — not tax advice; consult a CPA.
Schools (NCES district)
- District
- Durham Public Schools
- NCES district ID
- 3701260
- Math proficiency
- 29% ▼ -3.00%
- Reading proficiency
- 39% ▲ 2.00%
- Median HH income
- $52,143
- Composite
- 29.69/100
- National rank
- #6457
- State rank
- #132 of 178 in NC
Livability — Durham
- Score
- 81/100
- State rank
- #15
- US rank
- #1411
Category grades
Schools grade is shown separately in the Schools card above.
Census & demographics
- Census place
- Durham, NC
- County
- Durham County · 288,747 people
- City population
- 288,747
- Metro
- Durham-Chapel Hill, NC
- Population (ZIP)
- 24,793
- Household income
- $69,740
- Rent vs Own
- Severe rent burden
- 1402.0
Population outlook (Durham County) Hauer SSP2
- Today (2025)
- 368,962 people
- By 2030
- 402,686 · +9.1%
- By 2040
- 468,677 · +27.0%
- By 2050
- 531,727 · +44.1%
- By 2075
- 660,446 · +79.0%
- By 2100
- 739,971 · +100.6%
Race, ethnicity, and origin ACS 2023
- Neighborhood character
- Diverse neighborhood (Simpson 0.69)
- Race & ethnicity
- White 40% Black 32% Hispanic / Latino 19% Two or more races 9% Asian 3%
- Hispanic origin (detail)
- Mexican 9%
- Common ancestry
- Romanian 2% Italian 2% Slovak 2%
- Foreign-born
- 18% · Canada, Vietnam
- Languages at home
- 76% English-only · Spanish 18% Other Indo-European 2% German/W. Germanic 1%
Political lean MEDSL · Durham
- 2024 margin
- Solid D (+61.9) · D 80.2% · R 18.2% · Other 1.6%
- 2008→2024 swing
- +10.0pp toward D · 2008: 51.9pp · 2024: 61.9pp
- All cycles
- 2024: D+61.9 2020: D+62.4 2016: D+60.4 2012: D+52.7 2008: D+51.9
Not yet ingested
- Civics
- —
Market trends
- HPI YoY
- ▼ -272.19%
- Current HPI
- 347.5371
- Rent YoY
- ▲ 3.25%
- Metro
- Durham-Chapel Hill, NC
- State GDP YoY
- ▲ 3.28%
- F500 in state
- 26
Industry mix (Fortune 500 HQ in NC)
| Industry | F500 HQs | Revenue |
|---|---|---|
| Financial Services | 2 | $213B |
|
||
| Retail | 2 | $95B |
|
||
| Industrial Conglomerate | 1 | $38B |
|
||
| Metals / Steel | 1 | $35B |
|
||
| Utilities | 1 | $30B |
|
||
| Industrial Machinery | 1 | $19B |
|
||
Price history
+158.1% since first listed13 events — show timeline
- 2026-05-19 Listed $239,999 FSBO.com
- 2017-02-28 Sold (Public Records) $73,000 Public Records
- 2008-05-14 Sold (MLS) $50,000 AMLSNC
- 2008-05-14 Sold (MLS) $50,000 TMLS
- 2008-04-21 Listing Removed — TMLS
- 2008-04-09 Listed $52,900 AMLSNC
- 2008-04-09 Listed $52,900 TMLS
- 2006-10-06 Sold (MLS) $37,000 AMLSNC
- 2006-10-06 Sold (MLS) $37,000 TMLS
- 2006-09-12 Listing Removed — TMLS
- 2006-03-30 Listed $39,900 AMLSNC
- 2006-03-30 Listed $39,900 TMLS
- 2003-10-28 Sold (Public Records) $93,000 Public Records
Property tax history
+6.5%/yrLatest (2025): $2,265 · +123.7% YoY. Source: county tax records.
Cash-flow waterfall
monthlySold comps — $/sqft
last 12 mo · ≤1 miLoading sold comps…