1104 W 24th St · Riviera Beach, FL
Flood risk 1/10 · Minimal
- FEMA flood zone
- X (unshaded)
- Chance of flooding over 30 yrs
- 0.0%
- Est. flood insurance / yr
- $507 – $1,088
Fire risk 1/10 · Minimal
- Est. fire insurance / yr
- $947 – $1,759
Heat risk 10/10 · Severe
- Hot days now (above 106°F)
- 7 days/yr
- Hot days in 30 yrs
- 24 days/yr
Wind risk 10/10 · Severe
- Chance of severe wind over 30 yrs
- 99.0%
Air-quality risk 2/10 · Minimal
- Unhealthy air days now
- 0 days/yr
- Unhealthy air days in 30 yrs
- 1 days/yr
Risk factors via First Street. Map © Google.
Why this score? — see what drove the C+ grade
The composite is a weighted blend of 9 inputs, each scored 0–100. Each bar is that input's sub-score; the figure is the points it added to the 100-point composite (weight × sub-score).
- Cash flow +26.0/30.0
- DSCR +8.7/10.0
- ARV discount +7.5/15.0
- 1% rule +6.4/10.0
- Schools +4.3/10.0
- Livability +3.4/5.0
- Condition / age +2.5/5.0
- Rent growth +2.3/5.0
- Appreciation +0.0/10.0
$249,999
🖨 Deal sheet (PDF) 📄 Offer letter ✓ Due diligence
Listing remarks
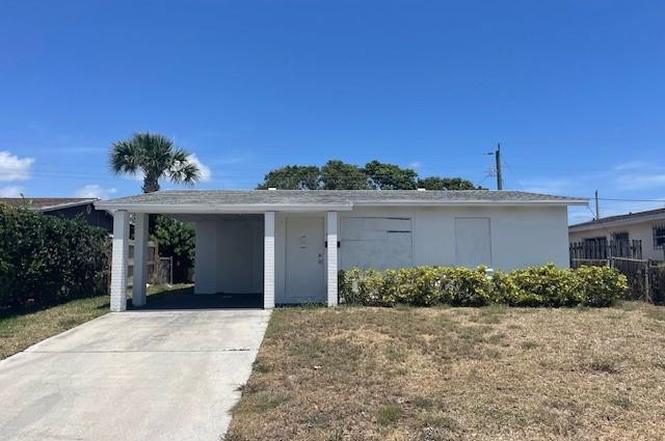
Welcome to this charming 2-bedroom, 1-bath single-family home located in a quiet and convenient neighborhood. Featuring a spacious front lawn, covered carport/porch, and extended driveway, this property offers excellent curb appeal and functionality. Perfect for a buyer looking to add their personal touch or for an investor seeking their next property. Large front-facing windows allow for plenty of natural light, and the generous yard space offers options for outdoor upgrades or future expansion. Located just minutes from beaches, schools, shops, and major roadways.
Key facts
- Minutes from beaches
- Covered carport
- Spacious front lawn
Tags
Property features AI
Finance
- HOA & community: Sidewalks
Exterior
- Parking: Carport (1 space); Covered parking
- Utilities: Public water; Public sewer
- Home design: Single family residence; One level; Resale condition; Faces south
- Construction: Built with CBS construction materials; Composition/shingle roof; 1 story
- Exterior features: Open porch; Porch
Interior
- Bedrooms: 2 bedrooms (main level)
- Flooring: Other
- Bathrooms: 1 full bathroom (main level)
- Heating & cooling: Has heating (type: Other); Has cooling (type: Other)
- Interior features: Other flooring
Neighborhood map
What this means for you Summary
Snapshot
- This is a 2-bed/1.0-bath single-family listed at $250k.
Deal economics
- At list price, monthly cash flow is $620 ($7k/yr) — positive.
- The deal already cash-flows at list — no discount required.
- Meets the 1% rule at list price ($3k rent vs $250k).
- Recommended offer: $227k (9.0% below list) — sets the bar for market timing.
Location & tenants
- Location reads 67/100 on livability (#581 in FL) — a middle-class / working-renter tenant base. Strengths: housing A+, health & safety A+, cost of living A-; Watch: employment D, crime F, amenities F.
- Palm Beach (suburban): math 46% / reading 53% proficiency, ranked #34 of 73 in FL (top 47%) — families likely to look elsewhere, expect single-tenant / working-renter base with shorter leases.
- Market conditions: Rents soft (-0.7%/yr); 506 active listings in the ZIP; 2 comparable units currently listed for rent nearby; 3,974 units permitted in Palm Beach County in 2024 (1,012 in 5+ unit buildings).
- At $2,841/mo this rent would consume 52% of the median local household income ($65k/yr) (locally 1838% of renters already pay >50% of income on rent) — very limited rent-growth headroom before tenants either downsize or default.
Forward outlook
- Local home prices are declining (-3.0%/yr); year-one equity from $2k of loan paydown is wiped out by about $8k of value loss. Plan a longer hold.
- Palm Beach County population projected at +30% by 2050 — long-run rental-demand tailwind backs the buy-and-hold thesis.
Negotiation context
- It's been on market 102 days — a 9% lower offer ($227k) is reasonable based on typical stale-listing flexibility.
- Current owner paid $32k; list at $250k implies a 681% gain — meaningful room to come down on a strong offer.
Risks & watch-outs
- Climate carrying-cost: severe wind risk, 99% chance of damaging wind over 30y; extreme-heat days projected 7→24/yr by 2055 (HVAC capex compounding) — expect insurance premiums to compound above CPI over the hold.
Questions for the listing agent
- It's been on market 102 days. Have you received any prior offers? Is the seller open to a 9% concession, seller financing, or rate buy-down credit?
- Built in 1971 — when were the roof, HVAC, electrical panel, plumbing, and water heater last replaced?
- Why hasn't it sold? Are there any deal-killer items the seller is aware of (foundation, flood, title, zoning, code violations)?
- Is there a deadline driving the sale (1031 exchange, divorce, estate, relocation)? That informs how much negotiation room exists.
- Crime grade is F in this area — have there been break-ins, vandalism, or insurance claims at this property in the last 3 years? What carrier currently insures it and at what premium?
- What's the average days-on-market for RENTAL listings here right now (not sales)? A rising rental-DOM trend means longer vacancies and softer asking-rent achievability than the comps imply.
- What's the recent tenant-quality profile in this submarket — average credit score on applications, eviction rate, late-payment / NSF rate, and stable-employment percentage? A property-management company in the area should have these aggregated.
- How much new for-sale + rental construction is in the pipeline within 1–3 miles? Heavy new supply typically softens prices + rents 12–24 months out; constrained supply supports both.
Investment metrics
- 1% rule
- 1.14% ✓
- Cap rate
- 9.27%
- Cash-on-cash
- 10.62%
- DSCR
- 1.47
- GRM
- 7.3
CMA / ARV
No comps found within radius.
Projected returns pro-forma
-3.0% appreciation · 0.0% rent growth · sell at horizon
- IRR
- -3.7%
- Equity multiple
- 0.87×
- Total profit
- $-9,397
- Equity at exit
- $37,276
- IRR
- 2.4%
- Equity multiple
- 1.15×
- Total profit
- $10,366
- Equity at exit
- $21,615
Cash invested: $70,000 (down + closing). Projections, not guarantees.
Landlord ↔ Tenant lean methodology
- Overall (STATE)
- 87 Strongly Landlord-Friendly
- State Florida
- 87 Strongly Landlord-Friendly · R+3
- County
- — inherits STATE
- City
- — inherits STATE
ZIP-level market 33404
- Home prices YoY
- -31.1%
- Rents YoY
- -0.7%
- Active inventory
- 506
- Price-to-rent
- 7.3×
Monthly cashflow live
- Estimated rent
- $2,841 medium interval (Pro) →
- Mortgage (P&I)
- −$1,311
- Tax from tax record
- −$210 /mo · $2,519/yr
- Insurance
- −$104
- HOA
- −$0
- Vacancy / Maint / Mgmt
- −$597
- Net cashflow
- $620
Break-even live
Sensitivity live
| Price | -10% $761 | -5% $690 | +0% $620 | +5% $549 | +10% $478 |
|---|---|---|---|---|---|
| Rent | -10% $395 | -5% $507 | +0% $620 | +5% $732 | +10% $844 |
| Rate | -1.0pp $745 | -0.5pp $683 | base $620 | +0.5pp $555 | +1.0pp $489 |
UW: 25.0% down · 7.5% · 30yr · 1.5% tax · 5.0% vac · 8.0% maint · 8.0% mgmt
Financing live
Cash to close
- Down payment
- $62,500
- Closing costs
- $7,500
- Reserves months
- —
- Total cash needed
- —
Loan-product check · same deal, 3 products live
Conventional
25% down · 7.5% · 30yr
- Down + closing
- —
- Monthly P&I
- —
- Monthly cashflow
- —
- DSCR
- —
- Eligible?
- —
Personal DTI + credit; lowest rate.
DSCR
20% down · 8.5% · 30yr
- Down + closing
- —
- Monthly P&I
- —
- Monthly cashflow
- —
- DSCR
- —
- Eligible?
- —
No personal income docs; deal must DSCR.
Hard money
10% down · 12.0% · 12mo
- Down + closing
- —
- Monthly P&I
- —
- Monthly cashflow
- —
- DSCR
- —
- Eligible?
- —
Short-term bridge; refi at stabilization.
Rent comps 2 comps
| Address | Beds | Baths | Sqft | Rent | $/sqft | DOM | Units | Dist |
|---|---|---|---|---|---|---|---|---|
| 256 E 24th St Riviera Beach, FL | 2.0 | 1.0 | 660 | $3,500 | $5.30 | 22d | 1 | 1.28mi |
| 300 E 24th St Riviera Beach, FL | 1.0 | 1.0 | 672 | $3,000 | $4.46 | 25d | 1 | 1.31mi |
Listing history 17 events
-
2026-06-21days on market $249,999 Active 102 DOM
-
2026-06-18days on market $249,999 Active 99 DOM
-
2026-06-17days on market $249,999 Active 98 DOM
-
2026-06-16days on market $249,999 Active 97 DOM
-
2026-06-15days on market $249,999 Active 96 DOM
-
2026-06-13days on market $249,999 Active 94 DOM
-
2026-06-09days on market $249,999 Active 90 DOM
-
2026-06-08days on market $249,999 Active 89 DOM
-
2026-06-07days on market $249,999 Active 88 DOM
-
2026-06-04days on market $249,999 Active 85 DOM
-
2026-06-03days on market $249,999 Active 84 DOM
-
2026-06-02days on market $249,999 Active 83 DOM
-
2026-06-01days on market $249,999 Active 82 DOM
-
2026-05-31days on market $249,999 Active 81 DOM
-
2025-05-02$249,999 Active
-
2011-08-16soldstatus $32,000
-
1971-01-01soldstatus $15,900
ⓘ Source: listings_history table (triggers on properties + properties_extension) + one-shot
backfill from property_details.listing_events for pre-trigger history.
Tax reassessment forecast FL · Resets to sale price
- Current annual tax
- $2,519 · $210/mo
- Projected year-2 tax
- $2,519 · $210/mo
- Expected delta
- $0/yr ($0/mo · 0.0%)
ⓘ Screening estimate from a state-policy table — verify with the county assessor before closing.
Climate risk First Street
- Flood 1/10 Low FEMA zone X (unshaded) · 0% chance over 30 yrs
- Wildfire 1/10 Low
- Heat 10/10 Extreme 7 d/yr ≥106°F today · 24 d/yr by 30 yrs out
- Wind 10/10 Extreme 99% chance of damaging wind over 30 yrs
- Air quality 2/10 Low 0 unhealthy d/yr today · 1 by 30 yrs out
Nearby sold comps map
Loading sold comps map…
Walkable amenities ~0.75 mi
Loading nearby amenities…
Taxation est. · year 1
- Rental income
- $34,096
- − Mortgage interest
- −$14,004
- − Property taxes
- −$2,519
- − Insurance
- −$1,250
- − Repairs & maintenance
- −$2,728
- − Management
- −$2,728
- − Depreciation
- −$7,273
- Taxable income
- $3,595
- Est. tax owed @ 24.0%
- −$863
- After-tax cash flow
- $6,572/yr
For passive investors: Depreciation is non-cash, so a rental often shows a tax loss while cash-flowing — sheltering income. Rental losses are passive: they offset passive income freely, and up to $25,000/yr can offset ordinary (W-2) income if you actively participate and your MAGI is under $100k (phasing out to $0 by $150k); unused losses carry forward. On sale, claimed depreciation is recaptured at up to 25%, and gains may owe capital-gains tax (a 1031 exchange can defer both). Figures are a year-1 estimate at your 24.0% rate — not tax advice; consult a CPA.
Schools (NCES district)
- District
- Palm Beach
- NCES district ID
- 1201500
- Math proficiency
- 46% ▼ -16.00%
- Reading proficiency
- 53% ▼ -4.00%
- Median HH income
- $53,943
- Composite
- 42.72/100
- National rank
- #3160
- State rank
- #34 of 73 in FL
Livability — Riviera Beach
- Score
- 67/100
- State rank
- #581
- US rank
- #11060
Category grades
Schools grade is shown separately in the Schools card above.
Census & demographics
- Census place
- Riviera Beach, FL
- County
- Palm Beach County · 1,438,312 people
- City population
- 30,912
- Metro
- Miami-Fort Lauderdale-Pompano Beach, FL
- Population (ZIP)
- 30,912
- Household income
- $65,063
- Rent vs Own
- Severe rent burden
- 1838.0
Population outlook (Palm Beach County) Hauer SSP2
- Today (2025)
- 1,637,487 people
- By 2030
- 1,743,255 · +6.5%
- By 2040
- 1,948,712 · +19.0%
- By 2050
- 2,132,979 · +30.3%
- By 2075
- 2,530,027 · +54.5%
- By 2100
- 2,706,979 · +65.3%
Race, ethnicity, and origin ACS 2023
- Neighborhood character
- Majority Black (64%)
- Race & ethnicity
- Black 64% White 22% Hispanic / Latino 9% Two or more races 8%
- Hispanic origin (detail)
- Mexican 1% Puerto Rican 1%
- Common ancestry
- Hispanic 8% Romanian 1% Italian 1%
- Foreign-born
- 21% · Canada, Jamaica
- Languages at home
- 82% English-only · Spanish 8% French/Haitian/Cajun 7% Other Indo-European 1%
Political lean MEDSL · Palm Beach
- 2024 margin
- Toss-up / Even · D 50.0% · R 49.2%
- 2008→2024 swing
- -22.1pp toward R · 2008: 22.9pp · 2024: 0.8pp
- All cycles
- 2024: D+0.8 2020: D+12.8 2016: D+15.3 2012: D+17.0 2008: D+22.9
Not yet ingested
- Civics
- —
Market trends
- HPI YoY
- ▼ -153.74%
- Current HPI
- 341.1761
- Rent YoY
- ▼ -0.72%
- Metro
- Miami-Fort Lauderdale-Pompano Beach, FL
- State GDP YoY
- ▲ 3.28%
- F500 in state
- 36
Industry mix (Fortune 500 HQ in FL)
| Industry | F500 HQs | Revenue |
|---|---|---|
| Industrial Technology | 2 | $29B |
|
||
| Insurance | 2 | $17B |
|
||
| Retail | 1 | $60B |
|
||
| Technology Distribution | 1 | $58B |
|
||
| Homebuilding | 1 | $35B |
|
||
| Technology Manufacturing | 1 | $35B |
|
||
Price history
+1472.3% since first listed3 events — show timeline
- 2025-05-02 Listed $249,999 Beaches MLS
- 2011-08-16 Sold (Public Records) $32,000 Public Records
- 1971-01-01 Sold (Public Records) $15,900 Public Records
Property tax history
+9.1%/yrLatest (2025): $2,519 · +8.3% YoY. Source: county tax records.
Cash-flow waterfall
monthlySold comps — $/sqft
last 12 mo · ≤1 miLoading sold comps…