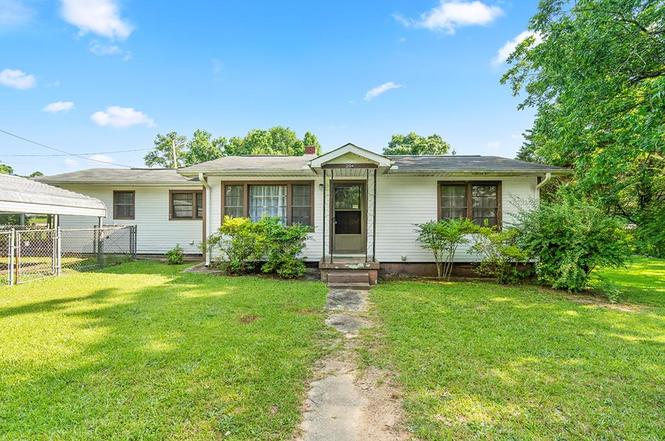
204 Oakland Ave · Abbeville, SC
Flood risk 1/10 · Minimal
- FEMA flood zone
- X (unshaded)
- Chance of flooding over 30 yrs
- 0.0%
- Est. flood insurance / yr
- $507 – $1,088
Fire risk 3/10 · Minor
- Est. fire insurance / yr
- $783 – $1,453
Heat risk 6/10 · Moderate
- Hot days now (above 106°F)
- 7 days/yr
- Hot days in 30 yrs
- 17 days/yr
Wind risk 6/10 · Moderate
- Chance of severe wind over 30 yrs
- 27.0%
Air-quality risk 2/10 · Minimal
- Unhealthy air days now
- 2 days/yr
- Unhealthy air days in 30 yrs
- 2 days/yr
Risk factors via First Street. Map © Google.
Why this score? — see what drove the C+ grade
The composite is a weighted blend of 9 inputs, each scored 0–100. Each bar is that input's sub-score; the figure is the points it added to the 100-point composite (weight × sub-score).
- ARV discount +15.0/15.0
- Cash flow +14.4/30.0
- Appreciation +10.0/10.0
- DSCR +4.4/10.0
- Schools +4.1/10.0
- 1% rule +4.0/10.0
- Livability +3.3/5.0
- Rent growth +2.5/5.0
- Condition / age +2.5/5.0
$99,900
🖨 Deal sheet 📄 Offer letter ✓ Due diligence
Listing remarks MLS
HUGE PRICE REDUCTION! Charming 2 bdrm, 1 bath home, with ZERO DOWN TO QUALIFIED BUYER. Approx 1,175 sq ft with FENCED YARD. With minor changes, formal dining room could be a 3rd bedroom if needed. Large fenced yard with pecan and fig tree plus scupperdine grape vines and flowering shrubs. Kitchen has breakfast bar and opens to the family room. Home has formal living room and dining room as well. Wood floors under the carpeting. There is a covered side porch off the family room to enjoy your evenings and two outbuilding perfect for lawn equipment and tools. This home is cute as can be, neat as a pin and has been well maintained. At this price, you don't want to miss it!
Key facts
- Screened-in porch
- Spacious corner lot
- Mostly fenced yard
Tags
Property features AI
Finance
- HOA & community: No community amenities indicated
Exterior
- Parking: Detached carport; Has carport
- Utilities: Natural gas connected; Public water connected; Sewer connected
- Home design: Single-family residence; Residential property
- Construction: Other construction materials
- Exterior features: Chain link partial fencing; Composition roof; Corner city lot
Interior
- Kitchen: Electric range; Refrigerator; Dishwasher not listed
- Flooring: Carpet
- Bathrooms: 1 full bathroom
- Heating & cooling: Heat pump heating; Central air conditioning
- Interior features: Fireplace; Crawl space (no finished basement); Covered and screened porch
- Laundry & utility: Washer and Dryer included
Neighborhood map
What this means for you Summary
Snapshot
- This is a 2-bed/1.0-bath single-family listed at $100k.
Deal economics
- At list price, monthly cash flow is $21 ($247/yr) — positive.
- The deal already cash-flows at list — no discount required.
- To meet the 1% rule (rent ≥ 1% of price), the offer needs to be $90k (9.9% below list).
- Recommended offer: $90k (9.9% below list) — sets the bar for 1% rule.
- Cap rate 6.5% vs local median 4.9% in Abbeville — top-decile yield for the area; either an underpriced asset or a hidden risk that comps aren't pricing in. Stress-test before assuming the spread holds.
Location & tenants
- Location reads 66/100 on livability (#111 in SC) — a middle-class / working-renter tenant base. Strengths: cost of living A+, housing A+; Watch: health & safety C-, amenities F, commute F.
- Abbeville 60 (rural): math 50% / reading 49% proficiency, ranked #15 of 80 in SC (top 19%) — families likely to look elsewhere, expect single-tenant / working-renter base with shorter leases.
- Market conditions: 109 active listings in the ZIP; 1 comparable units currently listed for rent nearby; 145 units permitted in Abbeville County in 2024 (0 in 5+ unit buildings).
Forward outlook
- In year one you build about $11k of equity ($691 loan paydown + $10k appreciation (10.0% local appreciation)).
- Abbeville County population projected at -17% by 2050 — secular population decline; favor cash flow + early exit over multi-decade hold.
- At projected returns (10.0% appreciation + 3.0% rent growth), your $28k cash investment doubles in ~3 years — after that, you're playing with house money.
- By year 4, paydown + projected appreciation supports a ~$38k cash-out refi (75% LTV) — recoverable capital for the next deal without selling this one.
Negotiation context
- Only 4 days on market — expect competitive offers; lowballing is unlikely to land.
- 2 sale attempts since 13y ago with the ask held roughly flat each time — persistent listings suggest the price (not the market) is what's stuck; bring a comps-based counter.
- Current owner paid $35k; list at $100k implies a 185% gain — meaningful room to come down on a strong offer.
Risks & watch-outs
- Watch-outs: built in 1955 — expect roof / HVAC / electrical / plumbing capex.
- Climate carrying-cost: major wind risk, 27% chance of damaging wind over 30y; extreme-heat days projected 7→17/yr by 2055 (HVAC capex compounding) — expect insurance premiums to compound above CPI over the hold.
Questions for the listing agent
- Built in 1955 — when were the roof, HVAC, electrical panel, plumbing, and water heater last replaced?
- Is there a deadline driving the sale (1031 exchange, divorce, estate, relocation)? That informs how much negotiation room exists.
- What's the average days-on-market for RENTAL listings here right now (not sales)? A rising rental-DOM trend means longer vacancies and softer asking-rent achievability than the comps imply.
- What's the recent tenant-quality profile in this submarket — average credit score on applications, eviction rate, late-payment / NSF rate, and stable-employment percentage? A property-management company in the area should have these aggregated.
- How much new for-sale + rental construction is in the pipeline within 1–3 miles? Heavy new supply typically softens prices + rents 12–24 months out; constrained supply supports both.
Investment metrics
- 1% rule
- 0.90% ✗
- Cap rate
- 6.54%
- Cash-on-cash
- 0.88%
- DSCR
- 1.04
- GRM
- 9.2
CMA / ARV
- ARV (on-the-fly)
- $180,796
- Comps found
- 12
Show comp detail 12 sales within ~0.75 mi
| Address | Dist | Beds/Ba | Sqft | Sold | Price | $/sf | Match |
|---|---|---|---|---|---|---|---|
| 123 Moore St | 0.23mi | 2/2.0 | 1,192 (+2%) | 2mo | $150,000 | $126 | 81 |
| 1008 Main Street St S | 0.15mi | 2/1.0 | 1,150 (-2%) | 13mo | $133,000 | $116 | 79 |
| 103 Hunter St | 0.12mi | 3/2.0 (+1) | 1,192 (+2%) | 6mo | $210,000 | $176 | 78 |
| 101 Hunter St | 0.14mi | 3/2.0 (+1) | 1,243 (+6%) | 1mo | $205,000 | $165 | 73 |
| 105 Hunter St | 0.12mi | 3/2.0 (+1) | 1,279 (+9%) | 5mo | $205,000 | $160 | 66 |
| 502 Marshall Ave | 0.58mi | 3/1.5 (+1) | 1,161 (-1%) | 2mo | $195,000 | $168 | 63 |
| 102 Langely St | 0.57mi | 2/1.5 | 1,194 (+2%) | 11mo | $178,000 | $149 | 59 |
| 109 George St | 0.66mi | 3/2.0 (+1) | 1,234 (+5%) | 1mo | $189,900 | $154 | 51 |
| 404 Marshall Ave | 0.61mi | 3/2.0 (+1) | 1,260 (+7%) | 5mo | $240,000 | $190 | 46 |
| 111 Wingfield St | 0.57mi | 3/2.0 (+1) | 1,293 (+10%) | 6mo | $180,000 | $139 | 43 |
| 104 Wingfield St | 0.55mi | 3/2.0 (+1) | 1,263 (+8%) | 14mo | $175,000 | $139 | 41 |
| 1206 Secession Ave | 0.60mi | 3/1.0 (+1) | 1,000 (-15%) | 6mo | $20,000 | $20 | 37 |
Match score weights: distance 35% · size 25% · config 20% · recency 20%. Top-matched comps best support the ARV.
Projected returns pro-forma
10.0% appreciation · 3.0% rent growth · sell at horizon
- IRR
- 24.9%
- Equity multiple
- 2.99×
- Total profit
- $55,735
- Equity at exit
- $89,998
- IRR
- 22.0%
- Equity multiple
- 6.83×
- Total profit
- $163,124
- Equity at exit
- $194,084
Cash invested: $27,972 (down + closing). Projections, not guarantees.
Landlord ↔ Tenant lean methodology
- Overall (STATE)
- 90 Strongly Landlord-Friendly
- State South Carolina
- 90 Strongly Landlord-Friendly · R+6
- County
- — inherits STATE
- City
- — inherits STATE
ZIP-level market 29620
- Home prices YoY
- 15.0%
- Active inventory
- 109
- Price-to-rent
- 9.2×
Monthly cashflow live
- Estimated rent
- $900 medium interval (Pro) →
- Mortgage (P&I)
- −$524
- Tax est. 1.5%
- −$125 /mo · $1,498/yr
- Insurance
- −$42
- HOA
- −$0
- Vacancy / Maint / Mgmt
- −$189
- Net cashflow
- $21
Break-even live
UW: 25.0% down · 7.5% · 30yr · 1.5% tax · 5.0% vac · 8.0% maint · 8.0% mgmt
Financing live
Cash to close
- Down payment
- $24,975
- Closing costs
- $2,997
- Reserves months
- —
- Total cash needed
- —
Loan-product check · same deal, 3 products live
Conventional
25% down · 7.5% · 30yr
- Down + closing
- —
- Monthly P&I
- —
- Monthly cashflow
- —
- DSCR
- —
- Eligible?
- —
Personal DTI + credit; lowest rate.
DSCR
20% down · 8.5% · 30yr
- Down + closing
- —
- Monthly P&I
- —
- Monthly cashflow
- —
- DSCR
- —
- Eligible?
- —
No personal income docs; deal must DSCR.
Hard money
10% down · 12.0% · 12mo
- Down + closing
- —
- Monthly P&I
- —
- Monthly cashflow
- —
- DSCR
- —
- Eligible?
- —
Short-term bridge; refi at stabilization.
Rent comps 1 comps
| Address | Beds | Baths | Sqft | Rent | $/sqft | DOM | Units | Dist |
|---|---|---|---|---|---|---|---|---|
| 508 N Main St Abbeville, SC | 1.0 | 1.0 | 800 | $900 | $1.12 | 3d | 1 | 1.49mi |
Listing history 5 events
-
2026-06-18days on market $99,900 Active 4 DOM
-
2026-06-17days on market $99,900 Active 3 DOM
-
2026-06-16days on market $99,900 Active 2 DOM
-
2026-06-15remarks 699-char remark
-
2026-06-15$99,900 Active 1 DOM
ⓘ Source: listings_history table (triggers on properties + properties_extension) + one-shot
backfill from property_details.listing_events for pre-trigger history.
Climate risk First Street
- Flood 1/10 Low FEMA zone X (unshaded) · 0% chance over 30 yrs
- Wildfire 3/10 Moderate
- Heat 6/10 Major 7 d/yr ≥106°F today · 17 d/yr by 30 yrs out
- Wind 6/10 Major 27% chance of damaging wind over 30 yrs
- Air quality 2/10 Low 2 unhealthy d/yr today · 2 by 30 yrs out
Nearby sold comps map
Loading sold comps map…
Walkable amenities ~0.75 mi
Loading nearby amenities…
Taxation est. · year 1
- Rental income
- $10,800
- − Mortgage interest
- −$5,596
- − Property taxes
- −$1,498
- − Insurance
- −$500
- − Repairs & maintenance
- −$864
- − Management
- −$864
- − Depreciation
- −$2,906
- Taxable loss
- −$1,428
- Est. tax savings @ 24.0%
- +$343
- After-tax cash flow
- $590/yr
For passive investors: Depreciation is non-cash, so a rental often shows a tax loss while cash-flowing — sheltering income. Rental losses are passive: they offset passive income freely, and up to $25,000/yr can offset ordinary (W-2) income if you actively participate and your MAGI is under $100k (phasing out to $0 by $150k); unused losses carry forward. On sale, claimed depreciation is recaptured at up to 25%, and gains may owe capital-gains tax (a 1031 exchange can defer both). Figures are a year-1 estimate at your 24.0% rate — not tax advice; consult a CPA.
Schools (NCES district)
- District
- Abbeville 60
- NCES district ID
- 4500690
- Math proficiency
- 50% ▼ -12.00%
- Reading proficiency
- 49% ▼ -7.00%
- Median HH income
- $34,522
- Composite
- 40.9/100
- National rank
- #3618
- State rank
- #15 of 80 in SC
Livability — Abbeville
- Score
- 66/100
- State rank
- #111
- US rank
- #11534
Category grades
Schools grade is shown separately in the Schools card above.
Census & demographics
- Census place
- Abbeville, SC
- Population (ZIP)
- 12,116
Population outlook (Abbeville County) Hauer SSP2
- Today (2025)
- 24,141 people
- By 2030
- 23,446 · -2.9%
- By 2040
- 21,768 · -9.8%
- By 2050
- 20,098 · -16.7%
- By 2075
- 16,518 · -31.6%
- By 2100
- 13,125 · -45.6%
Race, ethnicity, and origin ACS 2023
- Neighborhood character
- Predominantly White (65%)
- Race & ethnicity
- White 65% Black 30% Two or more races 4% Hispanic / Latino 2%
- Common ancestry
- Italian 2% Serbian 2% Slovak 2%
- Foreign-born
- 2% · Canada, Jamaica
- Languages at home
- 98% English-only · Spanish 2%
Political lean MEDSL · Abbeville
- 2024 margin
- Solid R (+42.4) · D 28.2% · R 70.6% · Other 1.2%
- 2008→2024 swing
- -27.2pp toward R · 2008: -15.2pp · 2024: -42.4pp
- All cycles
- 2024: R+42.4 2020: R+33.1 2016: R+28.3 2012: R+13.4 2008: R+15.2
Not yet ingested
- Civics
- —
Market trends
- HPI YoY
- ▲ 49.52%
- Current HPI
- 379.552
- Rent YoY
- —
- Metro
- —
- State GDP YoY
- ▲ 4.51%
- F500 in state
- 2
Industry mix (Fortune 500 HQ in SC)
| Industry | F500 HQs | Revenue |
|---|---|---|
| Packaging | 1 | $7B |
|
||
Price history
+122.0% since first listed4 events — show timeline
- 2026-06-14 Listed $99,900 GAOR
- 2014-06-06 Sold (Public Records) $35,000 Public Records
- 2014-06-06 Sold (MLS) $35,000 GAOR
- 2013-07-02 Listed $45,000 GAOR
Property tax history
-14.6%/yrLatest (2025): $144 · +1.4% YoY. Source: county tax records.
Cash-flow waterfall
monthlySold comps — $/sqft
last 12 mo · ≤1 miLoading sold comps…