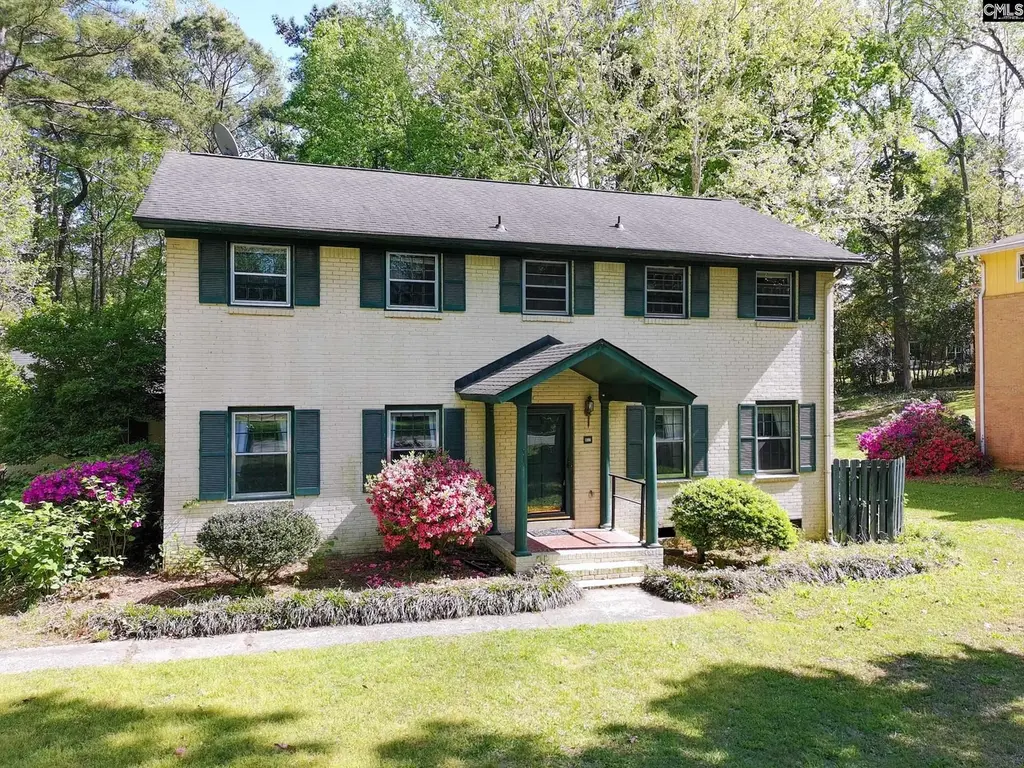
417 White Falls Dr · Irmo, SC
Flood risk 9/10 · Severe
- FEMA flood zone
- X (unshaded)
- Chance of flooding over 30 yrs
- 0.99%
- Est. flood insurance / yr
- $507 – $1,088
Fire risk 2/10 · Minimal
- Est. fire insurance / yr
- $783 – $1,453
Heat risk 6/10 · Moderate
- Hot days now (above 108°F)
- 7 days/yr
- Hot days in 30 yrs
- 16 days/yr
Wind risk 6/10 · Moderate
- Chance of severe wind over 30 yrs
- 65.0%
Air-quality risk 3/10 · Minor
- Unhealthy air days now
- 3 days/yr
- Unhealthy air days in 30 yrs
- 3 days/yr
Risk factors via First Street. Map © Google.
Why this score? — see what drove the C- grade
The composite is a weighted blend of 9 inputs, each scored 0–100. Each bar is that input's sub-score; the figure is the points it added to the 100-point composite (weight × sub-score).
- Cash flow +17.0/30.0
- ARV discount +15.0/15.0
- DSCR +5.3/10.0
- Schools +4.5/10.0
- Livability +3.7/5.0
- 1% rule +3.3/10.0
- Condition / age +2.5/5.0
- Rent growth +2.4/5.0
- Appreciation +0.0/10.0
$227,000
🖨 Deal sheet (PDF) 📄 Offer letter ✓ Due diligence
Listing remarks
Welcome home! This spacious 4-bedroom, 2.5-bath home offers plenty of room for comfortable living. The main level features a formal dining room, perfect for gatherings, and a cozy living room with a fireplace ideal for relaxing evenings. Upstairs, you’ll find all four bedrooms, providing privacy and functionality for the household. Step outside to enjoy the large backyard overlooking the community pond, along with an expansive back porch—perfect for entertaining, cookouts, and weekend gatherings. With its generous space, functional layout, and inviting atmosphere, this home is ideal for creating lasting memories. No HOA. Sold as-is. Disclaimer: CMLS has not reviewed and, theref
Key facts
- Cozy living room
- Formal dining room
- Large backyard
Tags
Property features AI
Exterior
- Parking: Attached, side-entry garage with 2 garage spaces
- Utilities: Public sewer
- Home design: Two-story home
- Construction: Crawlspace foundation
- Exterior features: Brick exterior above foundation; Paved road access; Public water
Interior
- Bedrooms: Master bedroom on second level; Bedroom 2 on second level; Bedroom 3 on second level; Bedroom 4 on second level
- Bathrooms: Two full bathrooms; One half bathroom; One partial bathroom
- Heating & cooling: Central heating; Central air conditioning
- Interior features: One fireplace
Neighborhood map
What this means for you Summary
Snapshot
- This is a 3-bed/2.5-bath single-family listed at $227k.
Deal economics
- At list price, monthly cash flow is $88 ($1k/yr) — positive.
- The deal already cash-flows at list — no discount required.
- To meet the 1% rule (rent ≥ 1% of price), the offer needs to be $188k (17.0% below list).
- Recommended offer: $188k (17.0% below list) — sets the bar for 1% rule.
Location & tenants
- Location reads 73/100 on livability (#38 in SC) — a middle-class / working-renter tenant base. Strengths: cost of living A+, housing A+, employment B; Watch: amenities F, commute F.
- Lexington 05 (suburban): math 47% / reading 55% proficiency, ranked #5 of 80 in SC (top 6%) — acceptable for families but not a draw, mixed tenant base, ~2y average lease.
- Zoned schools: Nursery Road Elementary (math 39% / reading 42%, grade F, #286 of 597 statewide, top 49%, 450 students, 100% FRL); Irmo Middle (math 30% / reading 38%, grade F, #110 of 229 statewide, top 49%, 1,011 students, 100% FRL); Irmo High (math 27% / reading 82%, grade C-, #130 of 196 statewide, top 69%, 1,307 students, 100% FRL) — zoned schools average 100% FRL vs 27% district-wide (73 pts higher); higher-poverty schools than district average — tighter screening recommended.
- Market conditions: Rents soft (-0.2%/yr); 211 active listings in the ZIP; solid renter incomes; 1,712 units permitted in Lexington County in 2024 (0 in 5+ unit buildings).
Forward outlook
- Local home prices are declining (-3.0%/yr); year-one equity from $2k of loan paydown is wiped out by about $7k of value loss. Plan a longer hold.
- Lexington County population projected at +26% by 2050 — long-run rental-demand tailwind backs the buy-and-hold thesis.
Negotiation context
- It's been on market 54 days — a 3% lower offer ($220k) is reasonable based on typical stale-listing flexibility.
- 2 sale attempts; this cycle's ask has dropped $23k (9%) from the opening price — seller is motivated, your offer sets the floor, not the list.
Risks & watch-outs
- Watch-outs: flood insurance adds $66/mo.
- Climate carrying-cost: severe flood risk; major wind risk, 65% chance of damaging wind over 30y; extreme-heat days projected 7→16/yr by 2055 (HVAC capex compounding) — expect insurance premiums to compound above CPI over the hold.
Questions for the listing agent
- It's been on market 54 days. Have you received any prior offers? Is the seller open to a 17% concession, seller financing, or rate buy-down credit?
- Built in 1971 — when were the roof, HVAC, electrical panel, plumbing, and water heater last replaced?
- What's the actual annual flood-insurance premium (NFIP or private), and is the property in a SFHA with mandatory coverage?
- Is there a deadline driving the sale (1031 exchange, divorce, estate, relocation)? That informs how much negotiation room exists.
- Schools are B-rated — typically a magnet for longer-tenancy family renters. What's the average tenant stay here, and is there a school-zone premium baked into asking?
- What's the average days-on-market for RENTAL listings here right now (not sales)? A rising rental-DOM trend means longer vacancies and softer asking-rent achievability than the comps imply.
- What's the recent tenant-quality profile in this submarket — average credit score on applications, eviction rate, late-payment / NSF rate, and stable-employment percentage? A property-management company in the area should have these aggregated.
- How much new for-sale + rental construction is in the pipeline within 1–3 miles? Heavy new supply typically softens prices + rents 12–24 months out; constrained supply supports both.
Investment metrics
- 1% rule
- 0.83% ✗
- Cap rate
- 7.11%
- Cash-on-cash
- 2.91%
- DSCR
- 1.13
- GRM
- 10.0
CMA / ARV
- ARV (on-the-fly)
- $325,380
- Comps found
- 1
Show comp detail 1 sale within ~0.75 mi
| Address | Dist | Beds/Ba | Sqft | Sold | Price | $/sf | Match |
|---|---|---|---|---|---|---|---|
| 270 Danby Ct | 0.63mi | 3/2.5 | 2,321 (+3%) | 8mo | $336,600 | $145 | 58 |
Match score weights: distance 35% · size 25% · config 20% · recency 20%. Top-matched comps best support the ARV.
Projected returns pro-forma
-3.0% appreciation · 0.0% rent growth · sell at horizon
- IRR
- -16.8%
- Equity multiple
- 0.42×
- Total profit
- $-36,790
- Equity at exit
- $33,846
- IRR
- -14.5%
- Equity multiple
- 0.27×
- Total profit
- $-46,474
- Equity at exit
- $19,627
Cash invested: $63,560 (down + closing). Projections, not guarantees.
Landlord ↔ Tenant lean methodology
- Overall (STATE)
- 90 Strongly Landlord-Friendly
- State South Carolina
- 90 Strongly Landlord-Friendly · R+6
- County
- — inherits STATE
- City
- — inherits STATE
ZIP-level market 29212
- Rents YoY
- -0.2%
- Active inventory
- 211
- Price-to-rent
- 10.0×
Monthly cashflow live
- Estimated rent
- $1,883 medium interval (Pro) →
- Mortgage (P&I)
- −$1,190
- Tax from tax record
- −$49 /mo · $583/yr
- Insurance
- −$95
- Flood insurance flood zone
- −$66 /mo · $798/yr
- HOA
- −$0
- Vacancy / Maint / Mgmt
- −$395
- Net cashflow
- $88
Break-even live
Sensitivity live
| Price | -10% $216 | -5% $152 | +0% $88 | +5% $23 | +10% $-41 |
|---|---|---|---|---|---|
| Rent | -10% $-61 | -5% $13 | +0% $88 | +5% $162 | +10% $237 |
| Rate | -1.0pp $202 | -0.5pp $145 | base $88 | +0.5pp $29 | +1.0pp $-31 |
UW: 25.0% down · 7.5% · 30yr · 1.5% tax · 5.0% vac · 8.0% maint · 8.0% mgmt
Financing live
Cash to close
- Down payment
- $56,750
- Closing costs
- $6,810
- Reserves months
- —
- Total cash needed
- —
Loan-product check · same deal, 3 products live
Conventional
25% down · 7.5% · 30yr
- Down + closing
- —
- Monthly P&I
- —
- Monthly cashflow
- —
- DSCR
- —
- Eligible?
- —
Personal DTI + credit; lowest rate.
DSCR
20% down · 8.5% · 30yr
- Down + closing
- —
- Monthly P&I
- —
- Monthly cashflow
- —
- DSCR
- —
- Eligible?
- —
No personal income docs; deal must DSCR.
Hard money
10% down · 12.0% · 12mo
- Down + closing
- —
- Monthly P&I
- —
- Monthly cashflow
- —
- DSCR
- —
- Eligible?
- —
Short-term bridge; refi at stabilization.
Listing history 9 events
-
2026-06-09status $227,000 Pending 54 DOM
-
2026-06-08days on market $227,000 Active 54 DOM
-
2026-06-07pricestatusdays on market $227,000 Active 53 DOM
-
2026-05-24status Pending
-
2026-05-08price $230,000
-
2026-04-24price $240,000
-
2026-04-23status Active
-
2026-04-10historical Active - Contingent
-
2026-04-03$250,000 Active
ⓘ Source: listings_history table (triggers on properties + properties_extension) + one-shot
backfill from property_details.listing_events for pre-trigger history.
Tax reassessment forecast SC · Resets to sale price
- Current annual tax
- $583 · $49/mo
- Projected year-2 tax
- $1,294 · $108/mo
- Expected delta
- +$711/yr (+$59/mo · 122.1%)
ⓘ Screening estimate from a state-policy table — verify with the county assessor before closing.
Climate risk First Street
- Flood 9/10 Extreme FEMA zone X (unshaded) · 99% chance over 30 yrs
- Wildfire 2/10 Low
- Heat 6/10 Major 7 d/yr ≥108°F today · 16 d/yr by 30 yrs out
- Wind 6/10 Major 65% chance of damaging wind over 30 yrs
- Air quality 3/10 Moderate 3 unhealthy d/yr today · 3 by 30 yrs out
Nearby sold comps map
Loading sold comps map…
Walkable amenities ~0.75 mi
Loading nearby amenities…
Taxation est. · year 1
- Rental income
- $22,599
- − Mortgage interest
- −$12,716
- − Property taxes
- −$583
- − Insurance
- −$1,932
- − Repairs & maintenance
- −$1,808
- − Management
- −$1,808
- − Depreciation
- −$6,604
- Taxable loss
- −$2,851
- Est. tax savings @ 24.0%
- +$684
- After-tax cash flow
- $1,737/yr
For passive investors: Depreciation is non-cash, so a rental often shows a tax loss while cash-flowing — sheltering income. Rental losses are passive: they offset passive income freely, and up to $25,000/yr can offset ordinary (W-2) income if you actively participate and your MAGI is under $100k (phasing out to $0 by $150k); unused losses carry forward. On sale, claimed depreciation is recaptured at up to 25%, and gains may owe capital-gains tax (a 1031 exchange can defer both). Figures are a year-1 estimate at your 24.0% rate — not tax advice; consult a CPA.
Schools (NCES district)
- District
- Lexington 05
- NCES district ID
- 4502820
- Math proficiency
- 47% ▼ -7.00%
- Reading proficiency
- 55% ▼ -4.00%
- Median HH income
- $67,732
- Composite
- 45.28/100
- National rank
- #2656
- State rank
- #5 of 80 in SC
Livability — Irmo
- Score
- 73/100
- State rank
- #38
- US rank
- #5024
Category grades
Schools grade is shown separately in the Schools card above.
Census & demographics
- County
- Lexington County · 232,571 people
- City population
- 38,201
- Metro
- Columbia, SC
- Population (ZIP)
- 27,657
- Household income
- $77,142
- Rent vs Own
- Severe rent burden
- 863.0
Population outlook (Lexington County) Hauer SSP2
- Today (2025)
- 322,999 people
- By 2030
- 342,356 · +6.0%
- By 2040
- 377,715 · +16.9%
- By 2050
- 406,984 · +26.0%
- By 2075
- 465,447 · +44.1%
- By 2100
- 485,674 · +50.4%
Race, ethnicity, and origin ACS 2023
- Neighborhood character
- Majority White (63%)
- Race & ethnicity
- White 63% Black 25% Hispanic / Latino 5% Two or more races 4% Asian 3%
- Hispanic origin (detail)
- Mexican 2%
- Common ancestry
- Slovak 3% Italian 3% Serbian 3%
- Foreign-born
- 7% · Canada, China, Jamaica
- Languages at home
- 91% English-only · Spanish 4% Other Indo-European 1% Russian/Polish/Slavic 1%
Political lean MEDSL · Lexington
- 2024 margin
- Solid R (+33.5) · D 32.5% · R 66.0% · Other 1.4%
- 2008→2024 swing
- +4.6pp toward D · 2008: -38.0pp · 2024: -33.5pp
- All cycles
- 2024: R+33.5 2020: R+30.1 2016: R+36.7 2012: R+37.8 2008: R+38.0
Not yet ingested
- Civics
- —
Market trends
- HPI YoY
- ▼ -139.55%
- Current HPI
- 212.5173
- Rent YoY
- ▼ -0.23%
- Metro
- Columbia, SC
- State GDP YoY
- ▲ 4.51%
- F500 in state
- 2
Industry mix (Fortune 500 HQ in SC)
| Industry | F500 HQs | Revenue |
|---|---|---|
| Packaging | 1 | $7B |
|
||
Price history
-8.0% since first listed6 events — show timeline
- 2026-05-24 Pending — Consolidated MLS
- 2026-05-08 Price Changed $230,000 Consolidated MLS
- 2026-04-24 Price Changed $240,000 Consolidated MLS
- 2026-04-23 Relisted — Consolidated MLS
- 2026-04-10 Contingent — Consolidated MLS
- 2026-04-03 Listed $250,000 Consolidated MLS
Property tax history
-13.0%/yrLatest (2024): $583 · +0.8% YoY. Source: county tax records.
Cash-flow waterfall
monthlySold comps — $/sqft
last 12 mo · ≤1 miLoading sold comps…