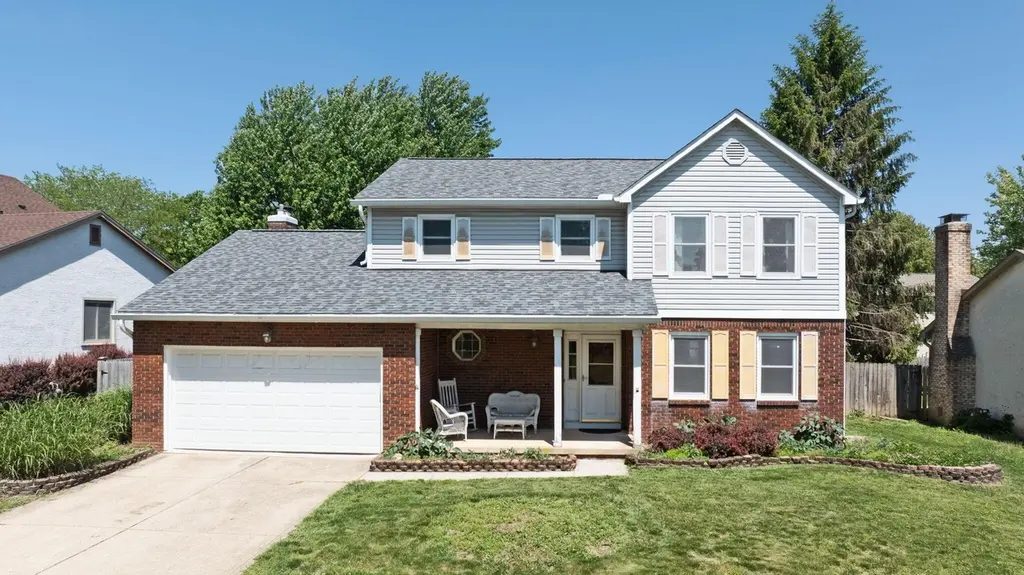
7591 Deercreek Dr · Columbus, OH
Flood risk 1/10 · Minimal
- FEMA flood zone
- X (unshaded)
- Chance of flooding over 30 yrs
- 0.0%
- Est. flood insurance / yr
- $473 – $860
Fire risk 1/10 · Minimal
- Est. fire insurance / yr
- $713 – $1,323
Heat risk 3/10 · Minor
- Hot days now (above 100°F)
- 7 days/yr
- Hot days in 30 yrs
- 17 days/yr
Wind risk 2/10 · Minimal
- Chance of severe wind over 30 yrs
- 0.0%
Air-quality risk 3/10 · Minor
- Unhealthy air days now
- 3 days/yr
- Unhealthy air days in 30 yrs
- 4 days/yr
Risk factors via First Street. Map © Google.
Why this score? — see what drove the D+ grade
The composite is a weighted blend of 9 inputs, each scored 0–100. Each bar is that input's sub-score; the figure is the points it added to the 100-point composite (weight × sub-score).
- ARV discount +15.0/15.0
- Cash flow +9.8/30.0
- Schools +6.0/10.0
- 1% rule +4.6/10.0
- Livability +4.0/5.0
- Rent growth +3.3/5.0
- DSCR +2.8/10.0
- Condition / age +2.5/5.0
- Appreciation +0.0/10.0
$250,000
🖨 Deal sheet 📄 Offer letter ✓ Due diligence
Listing remarks MLS
ORIGINAL OWNER CUSTOM BUILT & UPDATED, NEW ROOF, WINDOWS & CARPET. FRESHLY PAINTED LRG EAT-IN KITCHEN W/ NEWER APPLS. FAMILY RM W/ BRICK FPLC & BUILT-INS. 1ST FLR LAUNDRY. HUGE FULL BSMT READY FINISH. PRIVATE FENCED YRD W/ BEAUTIFUL INGRND POOL W/ NEW $4000 LINER. AGENT RELATED TO SELLER. SNOWBLOWER INCLUDED WITH THIS HOME
Key facts
- New gutters
- In ground pool
- New roof
Tags
Property features AI
Finance
- HOA & community: Sidewalks in the community
Exterior
- Parking: Attached garage with garage door opener (2-car)
- Utilities: Public water; Public sewer
- Home design: Single-family residence; Two levels; Built in 1980; No shared/common walls
- Construction: Block foundation
- Exterior features: Patio; Fenced yard; Inground pool
Interior
- Flooring: Stone flooring; Laminate flooring; Carpet
- Bathrooms: Two full bathrooms and one half bathroom (total 2.5)
- Heating & cooling: Central air conditioning
- Interior features: Insulated windows throughout; Wood-burning fireplace (1); Full basement
Neighborhood map
What this means for you Summary
Snapshot
- This is a 4-bed/2.5-bath single-family listed at $250k.
Deal economics
- At list price, monthly cash flow is $-161 ($-2k/yr) — negative.
- To cash-flow at today's rent, offer at most $222k (11.4% below list).
- To meet the 1% rule (rent ≥ 1% of price), the offer needs to be $240k (3.9% below list).
- Recommended offer: $222k (11.4% below list) — sets the bar for cash-flow.
- Cap rate 5.5% vs local median 3.8% in Columbus — top-decile yield for the area; either an underpriced asset or a hidden risk that comps aren't pricing in. Stress-test before assuming the spread holds.
Location & tenants
- Location reads 81/100 on livability (#97 in OH, #1,491 nationally) — a professional / high-income tenant draw. Strengths: commute A+, cost of living A+, housing A+; Watch: employment C-, crime F.
- Worthington City (suburban): math 65% / reading 71% proficiency, ranked #144 of 656 in OH (top 22%) — acceptable for families but not a draw, mixed tenant base, ~2y average lease.
- Market conditions: Rents rising (+3.4%/yr); 67 active listings in the ZIP; 3 comparable units currently listed for rent nearby; rentals at typical pace (median 21d on market — plan ~3-4 weeks tenant-placement turnaround); high-income renter base; 8,139 units permitted in Franklin County in 2024 (5,940 in 5+ unit buildings).
Forward outlook
- Local home prices are declining (-3.0%/yr); year-one equity from $2k of loan paydown is wiped out by about $8k of value loss. Plan a longer hold.
- Franklin County population projected at +34% by 2050 — long-run rental-demand tailwind backs the buy-and-hold thesis.
Negotiation context
- It's been on market 29 days — a 2% lower offer ($246k) is reasonable based on typical stale-listing flexibility.
- 4 sale attempts since 29y ago with the ask held roughly flat each time — persistent listings suggest the price (not the market) is what's stuck; bring a comps-based counter.
- Current owner paid $205k; 22% above their basis — modest negotiation headroom, anchor on the comps not their cost.
Risks & watch-outs
- Watch-outs: property tax is 3.1% of price.
Questions for the listing agent
- What do current leases actually rent for vs. the listed asking? Can we see a recent rent roll and the last 12 months of T-12 income?
- Property tax is high relative to price — has the assessment been appealed recently, and will the sale trigger a re-assessment?
- Is there a deadline driving the sale (1031 exchange, divorce, estate, relocation)? That informs how much negotiation room exists.
- Crime grade is F in this area — have there been break-ins, vandalism, or insurance claims at this property in the last 3 years? What carrier currently insures it and at what premium?
- The area grade is low — what's the realistic commute time and amenity access for the typical tenant pool here? Any planned neighborhood developments (good or bad) we should know about?
- What's the average days-on-market for RENTAL listings here right now (not sales)? A rising rental-DOM trend means longer vacancies and softer asking-rent achievability than the comps imply.
- What's the recent tenant-quality profile in this submarket — average credit score on applications, eviction rate, late-payment / NSF rate, and stable-employment percentage? A property-management company in the area should have these aggregated.
- How much new for-sale + rental construction is in the pipeline within 1–3 miles? Heavy new supply typically softens prices + rents 12–24 months out; constrained supply supports both.
Investment metrics
- 1% rule
- 0.96% ✗
- Cap rate
- 5.52%
- Cash-on-cash
- -2.76%
- DSCR
- 0.88
- GRM
- 8.7
CMA / ARV
- ARV (on-the-fly)
- $430,952
- Comps found
- 12
Show comp detail 12 sales within ~0.75 mi
| Address | Dist | Beds/Ba | Sqft | Sold | Price | $/sf | Match |
|---|---|---|---|---|---|---|---|
| 1378 Boswall Dr | 0.45mi | 4/2.5 | 2,174 (+4%) | 6mo | $424,000 | $195 | 67 |
| 698 Lawson Dr | 0.44mi | 3/1.5 (-1) | 2,028 (-3%) | 1mo | $419,900 | $207 | 65 |
| 7940 Schoolside Dr | 0.52mi | 3/3.0 (-1) | 2,100 (+0%) | 6mo | $390,000 | $186 | 64 |
| 7811 Worthington Trace Ln | 0.73mi | 4/2.5 | 2,100 (+0%) | 4mo | $457,500 | $218 | 62 |
| 1095 Belle Meade Pl | 0.48mi | 4/3.5 | 1,968 (-6%) | 3mo | $405,000 | $206 | 61 |
| 7852 Heathcock Ct | 0.47mi | 4/2.5 | 1,847 (-12%) | 2mo | $410,000 | $222 | 56 |
| 7916 Sudeley Ct | 0.64mi | 4/2.5 | 1,940 (-7%) | 6mo | $437,900 | $226 | 53 |
| 1212 Tillicum Dr | 0.45mi | 3/2.5 (-1) | 1,816 (-13%) | 1mo | $370,000 | $204 | 51 |
| 174 Crowles Ave | 0.74mi | 4/2.5 | 2,309 (+10%) | 1mo | $345,000 | $149 | 48 |
| 1138 Welwyn Dr | 0.65mi | 4/2.5 | 2,391 (+14%) | 1mo | $475,000 | $199 | 45 |
| 1263 Freshman Dr | 0.55mi | 3/3.0 (-1) | 2,342 (+12%) | 3mo | $365,000 | $156 | 45 |
| 1184 Stroud Ct | 0.61mi | 4/2.5 | 1,833 (-12%) | 8mo | $389,000 | $212 | 44 |
Match score weights: distance 35% · size 25% · config 20% · recency 20%. Top-matched comps best support the ARV.
Projected returns pro-forma
-3.0% appreciation · 3.37% rent growth · sell at horizon
- IRR
- -20.3%
- Equity multiple
- 0.29×
- Total profit
- $-49,622
- Equity at exit
- $37,276
- IRR
- -12.2%
- Equity multiple
- 0.26×
- Total profit
- $-51,719
- Equity at exit
- $21,615
Cash invested: $70,000 (down + closing). Projections, not guarantees.
Landlord ↔ Tenant lean methodology
- Overall (STATE)
- 73 Landlord-Friendly
- State Ohio
- 73 Landlord-Friendly · R+6
- County
- — inherits STATE
- City
- — inherits STATE
ZIP-level market 43085
- Rents YoY
- 3.4%
- Active inventory
- 67
- Price-to-rent
- 8.7×
Monthly cashflow live
- Estimated rent
- $2,403 medium interval (Pro) →
- Mortgage (P&I)
- −$1,311
- Tax from tax record
- −$644 /mo · $7,730/yr
- Insurance
- −$104
- HOA
- −$0
- Vacancy / Maint / Mgmt
- −$505
- Net cashflow
- $-161
Break-even live
UW: 25.0% down · 7.5% · 30yr · 1.5% tax · 5.0% vac · 8.0% maint · 8.0% mgmt
Financing live
Cash to close
- Down payment
- $62,500
- Closing costs
- $7,500
- Reserves months
- —
- Total cash needed
- —
Loan-product check · same deal, 3 products live
Conventional
25% down · 7.5% · 30yr
- Down + closing
- —
- Monthly P&I
- —
- Monthly cashflow
- —
- DSCR
- —
- Eligible?
- —
Personal DTI + credit; lowest rate.
DSCR
20% down · 8.5% · 30yr
- Down + closing
- —
- Monthly P&I
- —
- Monthly cashflow
- —
- DSCR
- —
- Eligible?
- —
No personal income docs; deal must DSCR.
Hard money
10% down · 12.0% · 12mo
- Down + closing
- —
- Monthly P&I
- —
- Monthly cashflow
- —
- DSCR
- —
- Eligible?
- —
Short-term bridge; refi at stabilization.
Rent comps 3 comps
| Address | Beds | Baths | Sqft | Rent | $/sqft | DOM | Units | Dist |
|---|---|---|---|---|---|---|---|---|
| 1213 Tillicum Dr Columbus, OH | 3.0 | 2.0 | 1492 | $2,400 | $1.61 | 1d | 1 | 0.47mi |
| 1263 Freshman Dr Westerville, OH | 3.0 | 3.0 | 2342 | $2,526 | $1.08 | 21d | 1 | 0.59mi |
| 8308 Talia Ct Westerville, OH | 3.0 | 2.5 | 2006 | $2,300 | $1.15 | 43d | 1 | 1.33mi |
Listing history 22 events
-
2026-06-17status $250,000 Pending 29 DOM
-
2026-06-17days on market $250,000 Active 29 DOM
-
2026-06-16days on market $250,000 Active 28 DOM
-
2026-06-15days on market $250,000 Active 27 DOM
-
2026-06-13days on market $250,000 Active 25 DOM
-
2026-06-09days on market $250,000 Active 21 DOM
-
2026-06-08days on market $250,000 Active 20 DOM
-
2026-06-07days on market $250,000 Active 19 DOM
-
2026-06-03days on market $250,000 Active 15 DOM
-
2026-06-02days on market $250,000 Active 14 DOM
-
2026-06-01days on market $250,000 Active 13 DOM
-
2026-05-31days on market $250,000 Active 12 DOM
-
2026-05-19$250,000 Active
-
2009-06-15soldstatus $205,000
-
2009-06-05soldstatus $205,000 342-char remark
Show marketing remark (342 chars)
ORIGINAL OWNER CUSTOM BUILT & UPDATED, NEW ROOF, WINDOWS & CARPET. FRESHLY PAINTED LRG EAT-IN KITCHEN W/ NEWER APPLS. FAMILY RM W/ BRICK FPLC & BUILT-INS. 1ST FLR LAUNDRY. HUGE FULL BSMT READY FINISH. PRIVATE FENCED YRD W/ BEAUTIFUL INGRND POOL W/ NEW $4000 LINER. AGENT RELATED TO SELLER. SNOWBLOWER INCLUDED WITH THIS HOME
-
2009-05-16historical 342-char remark
Show marketing remark (342 chars)
ORIGINAL OWNER CUSTOM BUILT & UPDATED, NEW ROOF, WINDOWS & CARPET. FRESHLY PAINTED LRG EAT-IN KITCHEN W/ NEWER APPLS. FAMILY RM W/ BRICK FPLC & BUILT-INS. 1ST FLR LAUNDRY. HUGE FULL BSMT READY FINISH. PRIVATE FENCED YRD W/ BEAUTIFUL INGRND POOL W/ NEW $4000 LINER. AGENT RELATED TO SELLER. SNOWBLOWER INCLUDED WITH THIS HOME
-
2009-01-05$210,000 342-char remark
Show marketing remark (342 chars)
ORIGINAL OWNER CUSTOM BUILT & UPDATED, NEW ROOF, WINDOWS & CARPET. FRESHLY PAINTED LRG EAT-IN KITCHEN W/ NEWER APPLS. FAMILY RM W/ BRICK FPLC & BUILT-INS. 1ST FLR LAUNDRY. HUGE FULL BSMT READY FINISH. PRIVATE FENCED YRD W/ BEAUTIFUL INGRND POOL W/ NEW $4000 LINER. AGENT RELATED TO SELLER. SNOWBLOWER INCLUDED WITH THIS HOME
-
2008-11-18historical
-
2008-04-24$218,000
-
1997-08-25historical
-
1997-05-28$164,900
-
1980-06-01soldstatus $17,000
ⓘ Source: listings_history table (triggers on properties + properties_extension) + one-shot
backfill from property_details.listing_events for pre-trigger history.
Tax reassessment forecast OH · Partial reset (capped growth)
- Current annual tax
- $7,730 · $644/mo
- Projected year-2 tax
- $7,730 · $644/mo
- Expected delta
- $0/yr ($0/mo · 0.0%)
ⓘ Screening estimate from a state-policy table — verify with the county assessor before closing.
Climate risk First Street
- Flood 1/10 Low FEMA zone X (unshaded) · 0% chance over 30 yrs
- Wildfire 1/10 Low
- Heat 3/10 Moderate 7 d/yr ≥100°F today · 17 d/yr by 30 yrs out
- Wind 2/10 Low 0% chance of damaging wind over 30 yrs
- Air quality 3/10 Moderate 3 unhealthy d/yr today · 4 by 30 yrs out
Nearby sold comps map
Loading sold comps map…
Walkable amenities ~0.75 mi
Loading nearby amenities…
Taxation est. · year 1
- Rental income
- $28,837
- − Mortgage interest
- −$14,004
- − Property taxes
- −$7,730
- − Insurance
- −$1,250
- − Repairs & maintenance
- −$2,307
- − Management
- −$2,307
- − Depreciation
- −$7,273
- Taxable loss
- −$6,033
- Est. tax savings @ 24.0%
- +$1,448
- After-tax cash flow
- $-483/yr
For passive investors: Depreciation is non-cash, so a rental often shows a tax loss while cash-flowing — sheltering income. Rental losses are passive: they offset passive income freely, and up to $25,000/yr can offset ordinary (W-2) income if you actively participate and your MAGI is under $100k (phasing out to $0 by $150k); unused losses carry forward. On sale, claimed depreciation is recaptured at up to 25%, and gains may owe capital-gains tax (a 1031 exchange can defer both). Figures are a year-1 estimate at your 24.0% rate — not tax advice; consult a CPA.
Schools (NCES district)
- District
- Worthington City
- NCES district ID
- 3904513
- Math proficiency
- 65% ▼ -10.00%
- Reading proficiency
- 71% ▼ -4.00%
- Median HH income
- $74,375
- Composite
- 60.02/100
- National rank
- #873
- State rank
- #144 of 656 in OH
Livability — Columbus
- Score
- 81/100
- State rank
- #97
- US rank
- #1491
Category grades
Schools grade is shown separately in the Schools card above.
Census & demographics
- Census place
- Columbus, OH
- County
- Franklin County · 1,351,780 people
- City population
- 612,189
- Metro
- Columbus, OH
- Population (ZIP)
- 26,601
- Household income
- $112,517
- Rent vs Own
- Severe rent burden
- 676.0
Population outlook (Franklin County) Hauer SSP2
- Today (2025)
- 1,456,139 people
- By 2030
- 1,556,890 · +6.9%
- By 2040
- 1,757,349 · +20.7%
- By 2050
- 1,950,539 · +34.0%
- By 2075
- 2,376,171 · +63.2%
- By 2100
- 2,636,796 · +81.1%
Race, ethnicity, and origin ACS 2023
- Neighborhood character
- Predominantly White (75%)
- Race & ethnicity
- White 75% Black 10% Two or more races 8% Hispanic / Latino 7% Asian 3%
- Hispanic origin (detail)
- Mexican 4%
- Common ancestry
- Romanian 3% Lithuanian 3% Slovak 3%
- Foreign-born
- 9% · Canada, China, South Korea
- Languages at home
- 90% English-only · Spanish 6% Chinese 1% Other Indo-European 1%
Political lean MEDSL · Franklin
- 2024 margin
- Strong D (+28.4) · D 63.7% · R 35.3% · Other 1.0%
- 2008→2024 swing
- +7.7pp toward D · 2008: 20.7pp · 2024: 28.4pp
- All cycles
- 2024: D+28.4 2020: D+31.4 2016: D+25.9 2012: D+21.7 2008: D+20.7
Not yet ingested
- Civics
- —
Market trends
- HPI YoY
- ▼ -335.29%
- Current HPI
- 280.1823
- Rent YoY
- ▲ 3.37%
- Metro
- Columbus, OH
- State GDP YoY
- ▲ 1.98%
- F500 in state
- 48
Industry mix (Fortune 500 HQ in OH)
| Industry | F500 HQs | Revenue |
|---|---|---|
| Insurance | 3 | $145B |
|
||
| Industrial Machinery | 3 | $49B |
|
||
| Financial Services | 3 | $24B |
|
||
| Consumer Goods | 2 | $93B |
|
||
| Aerospace / Defense | 2 | $47B |
|
||
| Utilities | 2 | $33B |
|
||
Price history
+1370.6% since first listed10 events — show timeline
- 2026-05-19 Listed $250,000 CBRMLS
- 2009-06-15 Sold (Public Records) $205,000 Public Records
- 2009-06-05 Sold (MLS) $205,000 CBRMLS
- 2009-05-16 Listing Removed — CBRMLS
- 2009-01-05 Listed $210,000 CBRMLS
- 2008-11-18 Listing Removed — CBRMLS
- 2008-04-24 Listed $218,000 CBRMLS
- 1997-08-25 Listing Removed — CBRMLS
- 1997-05-28 Listed $164,900 CBRMLS
- 1980-06-01 Sold (Public Records) $17,000 Public Records
Property tax history
+4.7%/yrLatest (2024): $7,730 · +4.6% YoY. Source: county tax records.
Cash-flow waterfall
monthlySold comps — $/sqft
last 12 mo · ≤1 miLoading sold comps…