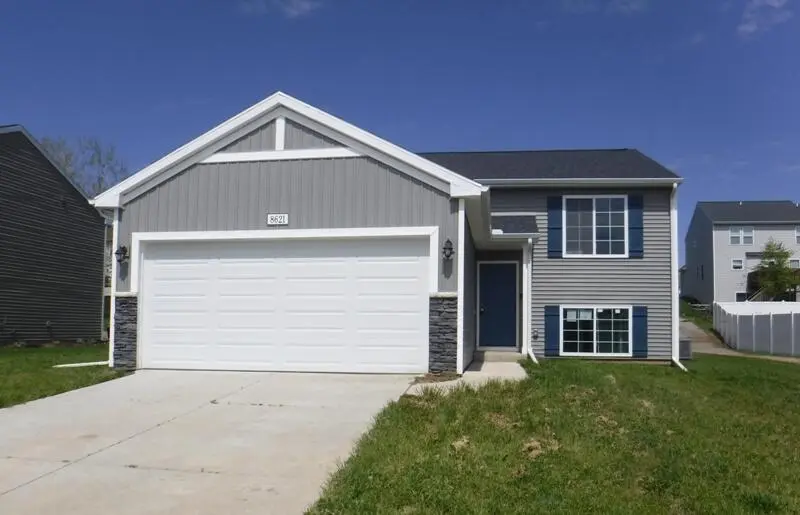
8621 E Sturtevant Ave · Richland, MI
Flood risk No data
- FEMA flood zone
- —
- Chance of flooding over 30 yrs
- —
- Est. flood insurance / yr
- —
Fire risk No data
- Est. fire insurance / yr
- —
Heat risk No data
- Hot days now (above threshold)
- —
- Hot days in 30 yrs
- —
Wind risk No data
- Chance of severe wind over 30 yrs
- —
Air-quality risk No data
- Unhealthy air days now
- —
- Unhealthy air days in 30 yrs
- —
Risk factors via First Street. Map © Google.
Why this score? — see what drove the C- grade
The composite is a weighted blend of 9 inputs, each scored 0–100. Each bar is that input's sub-score; the figure is the points it added to the 100-point composite (weight × sub-score).
- ARV discount +15.0/15.0
- Cash flow +14.3/30.0
- 1% rule +4.4/10.0
- DSCR +4.4/10.0
- Schools +4.4/10.0
- Condition / age +4.0/5.0
- Livability +3.7/5.0
- Rent growth +2.5/5.0
- Appreciation +0.0/10.0
$277,000
🖨 Deal sheet 📄 Offer letter ✓ Due diligence
Listing remarks MLS
OPEN HOUSE SUNDAY 6/7/26 2-4pm 8621 E Sturtevant Ave Richland MI 49083 3 bedroom 2 bath ranch style home with 2 car attached garage FHA Case #263-704603 Code IE 203k eligible For More Info. including Lead Based Paint Disclosures & Condition Report, Go To Hudhomestore. gov or rainecompanies. com, Buyer to verify all info. HUD does NOT pay for title insurance. Raine makes no warranty as to the existence of mold in this property & is not liable for the potentially harmful effects thereof and makes no warranty as to the condition of the property. See attached LBP & Disclosure for HUD Homes. ASK ABOUT SPECIAL $100 DOWN FINANCING AVAILABLE ON HUD HOMES
Key facts
- 0.23 acre lot
- 2 garage spots
- Built 2023
Property features AI
Finance
- HOA & community: Has association
Exterior
- Parking: Attached 2-car garage; Attached parking
- Utilities: Public water; Natural gas water heater
- Home design: Single family residence; Residential property; Built in 2023; Composition roof
- Construction: Vinyl siding construction
- Exterior features: Paved road access; Lot size approximately 0.23 acres; Public water
Interior
- Kitchen: Kitchen (12 x 16)
- Bedrooms: Primary bedroom (15 x 15); Bedroom 2 (12 x 12); Bedroom 3 (14 x 14)
- Bathrooms: 2 full bathrooms; Primary bathroom (9 x 9); Bathroom 2 (5 x 9)
- Heating & cooling: Forced air heating; Has heating; Has cooling
- Interior features: Total of 4 rooms; Screens on windows; Insulated windows; Daylight full basement
Neighborhood map
What this means for you Summary
Snapshot
- This is a 4-bed/1.0-bath single-family listed at $277k. Condition is rated good.
Deal economics
- At list price, monthly cash flow is $53 ($636/yr) — positive.
- The deal already cash-flows at list — no discount required.
- To meet the 1% rule (rent ≥ 1% of price), the offer needs to be $260k (6.1% below list).
- Recommended offer: $260k (6.1% below list) — sets the bar for 1% rule.
- Cap rate 6.5% vs local median 4.1% in Richland — top-decile yield for the area; either an underpriced asset or a hidden risk that comps aren't pricing in. Stress-test before assuming the spread holds.
Location & tenants
- Location reads 73/100 on livability (#222 in MI) — a middle-class / working-renter tenant base. Strengths: cost of living A+, housing A+, employment A; Watch: amenities F, commute F, health & safety F.
- Gull Lake Community Schools (suburban): math 40% / reading 59% proficiency, ranked #93 of 540 in MI (top 17%) — families likely to look elsewhere, expect single-tenant / working-renter base with shorter leases; only 18% free/reduced lunch — higher-income household profile.
- Market conditions: 129 active listings in the ZIP; 1 comparable units currently listed for rent nearby; 339 units permitted in Kalamazoo County in 2024 (22 in 5+ unit buildings).
Forward outlook
- Local home prices are declining (-3.0%/yr); year-one equity from $2k of loan paydown is wiped out by about $8k of value loss. Plan a longer hold.
- Kalamazoo County population projected at +18% by 2050 — long-run rental-demand tailwind backs the buy-and-hold thesis.
Negotiation context
- It's been on market 36 days — a 3% lower offer ($269k) is reasonable based on typical stale-listing flexibility.
- 8 sale attempts since 3y ago with the ask held roughly flat each time — persistent listings suggest the price (not the market) is what's stuck; bring a comps-based counter.
Questions for the listing agent
- It's been on market 36 days. Have you received any prior offers? Is the seller open to a 6% concession, seller financing, or rate buy-down credit?
- Is there a deadline driving the sale (1031 exchange, divorce, estate, relocation)? That informs how much negotiation room exists.
- Schools are B-rated — typically a magnet for longer-tenancy family renters. What's the average tenant stay here, and is there a school-zone premium baked into asking?
- What's the average days-on-market for RENTAL listings here right now (not sales)? A rising rental-DOM trend means longer vacancies and softer asking-rent achievability than the comps imply.
- What's the recent tenant-quality profile in this submarket — average credit score on applications, eviction rate, late-payment / NSF rate, and stable-employment percentage? A property-management company in the area should have these aggregated.
- How much new for-sale + rental construction is in the pipeline within 1–3 miles? Heavy new supply typically softens prices + rents 12–24 months out; constrained supply supports both.
Investment metrics
- 1% rule
- 0.94% ✗
- Cap rate
- 6.52%
- Cash-on-cash
- 0.82%
- DSCR
- 1.04
- GRM
- 8.9
CMA / ARV
- ARV (median comp)
- $339,183
- List price
- $277,000
- Delta
- -18.33%
- Verdict
- UNDERPRICED
- Comps
- 20 within 1.0 mi
Show comp detail 12 sales within ~0.75 mi
| Address | Dist | Beds/Ba | Sqft | Sold | Price | $/sf | Match |
|---|---|---|---|---|---|---|---|
| 8797 E Sturtevant Ave | 0.09mi | 4/2.0 | 2,072 (+0%) | 4mo | $309,900 | $150 | 88 |
| 8854 Aveling Way | 0.15mi | 3/2.5 (-1) | 2,016 (-2%) | 0mo | $305,000 | $151 | 78 |
| 8025 W Sturtevant Ave | 0.25mi | 3/2.0 (-1) | 2,060 (-0%) | 2mo | $311,100 | $151 | 78 |
| 8889 Cowley Ct | 0.20mi | 3/2.5 (-1) | 2,047 (-1%) | 1mo | $299,000 | $146 | 78 |
| 8142 W Sturtevant Ave | 0.25mi | 3/2.0 (-1) | 2,060 (-0%) | 3mo | $301,000 | $146 | 77 |
| 8010 W Sturtevant Ave | 0.28mi | 3/2.0 (-1) | 2,060 (-0%) | 2mo | $290,000 | $141 | 76 |
| 8119 Lausen Ln | 0.31mi | 3/2.0 (-1) | 2,060 (-0%) | 2mo | $285,000 | $138 | 74 |
| 8728 E Sturtevant Ave | 0.06mi | 4/2.5 | 1,882 (-9%) | 6mo | $339,900 | $181 | 71 |
| 8794 E Sturtevant Ave | 0.11mi | 4/2.5 | 1,882 (-9%) | 5mo | $344,990 | $183 | 70 |
| 8816 E Sturtevant Ave | 0.12mi | 4/2.5 | 1,882 (-9%) | 4mo | $339,900 | $181 | 70 |
| 8199 W Sturtevant Ave | 0.20mi | 3/2.0 (-1) | 1,883 (-9%) | 1mo | $319,000 | $169 | 66 |
| 8780 E Sturtevant Ave | 0.14mi | 4/2.5 | 1,830 (-11%) | 4mo | $334,900 | $183 | 65 |
Match score weights: distance 35% · size 25% · config 20% · recency 20%. Top-matched comps best support the ARV.
Projected returns pro-forma
-3.0% appreciation · 3.0% rent growth · sell at horizon
- IRR
- -15.0%
- Equity multiple
- 0.47×
- Total profit
- $-41,420
- Equity at exit
- $41,302
- IRR
- -6.3%
- Equity multiple
- 0.60×
- Total profit
- $-31,348
- Equity at exit
- $23,950
Cash invested: $77,560 (down + closing). Projections, not guarantees.
Landlord ↔ Tenant lean methodology
- Overall (STATE)
- 62 Landlord-Friendly
- State Michigan
- 62 Landlord-Friendly · EVEN
- County
- — inherits STATE
- City
- — inherits STATE
ZIP-level market 49083
- Active inventory
- 129
- Price-to-rent
- 8.9×
Monthly cashflow live
- Estimated rent
- $2,600 medium interval (Pro) →
- Mortgage (P&I)
- −$1,453
- Tax from tax record
- −$433 /mo · $5,196/yr
- Insurance
- −$115
- HOA
- −$0
- Vacancy / Maint / Mgmt
- −$546
- Net cashflow
- $53
Break-even live
UW: 25.0% down · 7.5% · 30yr · 1.5% tax · 5.0% vac · 8.0% maint · 8.0% mgmt
Financing live
Cash to close
- Down payment
- $69,250
- Closing costs
- $8,310
- Reserves months
- —
- Total cash needed
- —
Loan-product check · same deal, 3 products live
Conventional
25% down · 7.5% · 30yr
- Down + closing
- —
- Monthly P&I
- —
- Monthly cashflow
- —
- DSCR
- —
- Eligible?
- —
Personal DTI + credit; lowest rate.
DSCR
20% down · 8.5% · 30yr
- Down + closing
- —
- Monthly P&I
- —
- Monthly cashflow
- —
- DSCR
- —
- Eligible?
- —
No personal income docs; deal must DSCR.
Hard money
10% down · 12.0% · 12mo
- Down + closing
- —
- Monthly P&I
- —
- Monthly cashflow
- —
- DSCR
- —
- Eligible?
- —
Short-term bridge; refi at stabilization.
Rent comps 1 comps
| Address | Beds | Baths | Sqft | Rent | $/sqft | DOM | Units | Dist |
|---|---|---|---|---|---|---|---|---|
| 8331 W Sturtevant Ave Richland, MI | 4.0 | 2.5 | 1822 | $2,600 | $1.43 | 43d | 1 | 0.14mi |
Listing history 44 events
-
2026-06-18days on market $277,000 Active 36 DOM
-
2026-06-17days on market $277,000 Active 35 DOM
-
2026-06-16days on market $277,000 Active 34 DOM
-
2026-06-15days on market $277,000 Active 33 DOM
-
2026-06-14days on market $277,000 Active 31 DOM
-
2026-06-13days on market $277,000 Active 30 DOM
-
2026-06-10days on market $277,000 Active 28 DOM
-
2026-06-09days on market $277,000 Active 27 DOM
-
2026-06-08days on market $277,000 Active 26 DOM
-
2026-06-07days on market $277,000 Active 25 DOM
-
2026-06-03days on market $277,000 Active 21 DOM
-
2026-06-02days on market $277,000 Active 20 DOM
-
2026-06-01days on market $277,000 Active 19 DOM
-
2026-05-31days on market $277,000 Active 18 DOM
-
2026-05-30days on market $277,000 Active 17 DOM
-
2026-05-11$277,000 Active 666-char remark
Show marketing remark (673 chars)
OPEN HOUSE SUNDAY 6/7/26 2-4pm 8621 E Sturtevant Ave Richland MI 49083 3 bedroom 2 bath ranch style home with 2 car attached garage FHA Case #263-704603 Code IE 203k eligible For More Info. including Lead Based Paint Disclosures & Condition Report, Go To Hudhomestore. gov or rainecompanies. com, Buyer to verify all info. HUD does NOT pay for title insurance. Raine makes no warranty as to the existence of mold in this property & is not liable for the potentially harmful effects thereof and makes no warranty as to the condition of the property. See attached LBP & Disclosure for HUD Homes. ASK ABOUT SPECIAL $100 DOWN FINANCING AVAILABLE ON HUD HOMES
-
2026-05-11$277,000 Active 673-char remark
Show marketing remark (673 chars)
OPEN HOUSE SUNDAY 6/7/26 2-4pm 8621 E Sturtevant Ave Richland MI 49083 3 bedroom 2 bath ranch style home with 2 car attached garage FHA Case #263-704603 Code IE 203k eligible For More Info. including Lead Based Paint Disclosures & Condition Report, Go To Hudhomestore. gov or rainecompanies. com, Buyer to verify all info. HUD does NOT pay for title insurance. Raine makes no warranty as to the existence of mold in this property & is not liable for the potentially harmful effects thereof and makes no warranty as to the condition of the property. See attached LBP & Disclosure for HUD Homes. ASK ABOUT SPECIAL $100 DOWN FINANCING AVAILABLE ON HUD HOMES
-
2026-05-11$277,000 Active
Show marketing remark (673 chars)
OPEN HOUSE SUNDAY 6/7/26 2-4pm 8621 E Sturtevant Ave Richland MI 49083 3 bedroom 2 bath ranch style home with 2 car attached garage FHA Case #263-704603 Code IE 203k eligible For More Info. including Lead Based Paint Disclosures & Condition Report, Go To Hudhomestore. gov or rainecompanies. com, Buyer to verify all info. HUD does NOT pay for title insurance. Raine makes no warranty as to the existence of mold in this property & is not liable for the potentially harmful effects thereof and makes no warranty as to the condition of the property. See attached LBP & Disclosure for HUD Homes. ASK ABOUT SPECIAL $100 DOWN FINANCING AVAILABLE ON HUD HOMES
-
2025-10-05historical
-
2025-10-04historical
-
2025-07-07price $298,000
-
2025-07-07price $298,000
-
2025-07-07price $298,000
-
2025-06-09price $304,325
-
2025-06-09price $304,325
-
2025-06-09price $304,325
-
2025-05-08price $311,500
-
2025-05-08price $311,500
-
2025-05-08price $311,500
-
2025-04-22price $313,830
-
2025-04-22price $313,830
-
2025-04-22price $313,830
-
2025-04-04$315,000 Active
-
2025-04-04$315,000 Active
-
2024-03-11soldstatus $289,775 Sold
-
2024-03-11soldstatus $289,775 Sold
-
2024-03-11soldstatus $289,775 Closed
-
2023-09-23status Pending
-
2023-09-23$289,775
-
2023-09-23historical
-
2023-09-23$289,775 Active
-
2023-09-23historical
-
2023-09-23$289,775
-
2023-08-30soldstatus $49,500
ⓘ Source: listings_history table (triggers on properties + properties_extension) + one-shot
backfill from property_details.listing_events for pre-trigger history.
Tax reassessment forecast MI · Partial reset (capped growth)
- Current annual tax
- $5,196 · $433/mo
- Projected year-2 tax
- $5,196 · $433/mo
- Expected delta
- $0/yr ($0/mo · 0.0%)
ⓘ Screening estimate from a state-policy table — verify with the county assessor before closing.
Nearby sold comps map
Loading sold comps map…
Walkable amenities ~0.75 mi
Loading nearby amenities…
Taxation est. · year 1
- Rental income
- $31,200
- − Mortgage interest
- −$15,516
- − Property taxes
- −$5,196
- − Insurance
- −$1,385
- − Repairs & maintenance
- −$2,496
- − Management
- −$2,496
- − Depreciation
- −$8,058
- Taxable loss
- −$3,947
- Est. tax savings @ 24.0%
- +$947
- After-tax cash flow
- $1,583/yr
For passive investors: Depreciation is non-cash, so a rental often shows a tax loss while cash-flowing — sheltering income. Rental losses are passive: they offset passive income freely, and up to $25,000/yr can offset ordinary (W-2) income if you actively participate and your MAGI is under $100k (phasing out to $0 by $150k); unused losses carry forward. On sale, claimed depreciation is recaptured at up to 25%, and gains may owe capital-gains tax (a 1031 exchange can defer both). Figures are a year-1 estimate at your 24.0% rate — not tax advice; consult a CPA.
Condition & rehab AI · 12 photos
This single-family home is in good condition with a fresh exterior and well-maintained interior. Minor repairs and updates to the exterior lighting and carpet can further enhance its resale value.
Repairs flagged
- Minor exterior lighting — Some lights appear to be missing or not functioning
Value-add opportunities
- Resale Paint exterior trim — Fresh paint enhances curb appeal
- Resale Replace carpet in living areas — New carpet improves aesthetics and comfort
- Resale Install modern light fixtures — Modern lighting enhances the home's appeal
Renovation cost estimate screening
| Repair item | Severity | Est. cost |
|---|---|---|
| exterior lighting · Some lights appear to be missing or not functioning | Minor | $500–3,000 |
| Total estimated repair cost · 1 items | $500–3,000 |
Value-add ROI direction
- Resale Paint exterior trim — Fresh paint enhances curb appeal ↑
- Resale Replace carpet in living areas — New carpet improves aesthetics and comfort ↑
- Resale Install modern light fixtures — Modern lighting enhances the home's appeal ↑
ⓘ Cost ranges are severity-bucket heuristics (US national rule-of-thumb). Get contractor quotes + a written scope before underwriting a rehab budget.
Schools (NCES district)
- District
- Gull Lake Community Schools
- NCES district ID
- 2617250
- Math proficiency
- 40% ▼ -6.00%
- Reading proficiency
- 59% ▼ -3.00%
- Median HH income
- $64,763
- Composite
- 43.71/100
- National rank
- #2952
- State rank
- #93 of 540 in MI
Livability — Richland
- Score
- 73/100
- State rank
- #222
- US rank
- #5563
Category grades
Schools grade is shown separately in the Schools card above.
Census & demographics
- City population
- 8,110
- Population (ZIP)
- 8,110
Population outlook (Kalamazoo County) Hauer SSP2
- Today (2025)
- 280,982 people
- By 2030
- 292,068 · +3.9%
- By 2040
- 312,191 · +11.1%
- By 2050
- 331,196 · +17.9%
- By 2075
- 379,021 · +34.9%
- By 2100
- 396,579 · +41.1%
Race, ethnicity, and origin ACS 2023
- Neighborhood character
- Predominantly White (92%)
- Race & ethnicity
- White 92% Two or more races 4% Hispanic / Latino 4% Black 2%
- Common ancestry
- Iranian 14% Romanian 7% Italian 3%
- Foreign-born
- 2% · Canada
- Languages at home
- 95% English-only · Spanish 3% German/W. Germanic 1%
Political lean MEDSL · Kalamazoo
- 2024 margin
- D (+17.7) · D 58.0% · R 40.3% · Other 1.7%
- 2008→2024 swing
- -1.8pp toward R · 2008: 19.5pp · 2024: 17.7pp
- All cycles
- 2024: D+17.7 2020: D+18.7 2016: D+12.8 2012: D+13.3 2008: D+19.5
Not yet ingested
- Civics
- —
Market trends
- HPI YoY
- ▼ -152.73%
- Current HPI
- 235.3459
- Rent YoY
- —
- Metro
- —
- State GDP YoY
- ▲ 1.37%
- F500 in state
- 28
Industry mix (Fortune 500 HQ in MI)
| Industry | F500 HQs | Revenue |
|---|---|---|
| Automotive Parts | 3 | $48B |
|
||
| Automotive | 2 | $372B |
|
||
| Chemicals | 1 | $45B |
|
||
| Automotive Retail | 1 | $29B |
|
||
| Healthcare / Medical Devices | 1 | $23B |
|
||
| Automotive Technology | 1 | $20B |
|
||
Price history
+459.6% since first listed29 events — show timeline
- 2026-05-11 Listed $277,000 REALCOMP
- 2026-05-11 Listed $277,000 MiRealSource-MiMLS
- 2026-05-11 Listed $277,000 SW Michigan MLS
- 2025-10-05 Listing Removed — MiRealSource-MiMLS
- 2025-10-04 Listing Removed — REALCOMP
- 2025-07-07 Price Changed $298,000 MiRealSource-MiMLS
- 2025-07-07 Price Changed $298,000 REALCOMP
- 2025-07-07 Price Changed $298,000 SW Michigan MLS
- 2025-06-09 Price Changed $304,325 MiRealSource-MiMLS
- 2025-06-09 Price Changed $304,325 REALCOMP
- 2025-06-09 Price Changed $304,325 SW Michigan MLS
- 2025-05-08 Price Changed $311,500 MiRealSource-MiMLS
- 2025-05-08 Price Changed $311,500 REALCOMP
- 2025-05-08 Price Changed $311,500 SW Michigan MLS
- 2025-04-22 Price Changed $313,830 MiRealSource-MiMLS
- 2025-04-22 Price Changed $313,830 REALCOMP
- 2025-04-22 Price Changed $313,830 SW Michigan MLS
- 2025-04-04 Listed $315,000 REALCOMP
- 2025-04-04 Listed $315,000 MiRealSource-MiMLS
- 2024-03-11 Sold (MLS) $289,775 MiRealSource-MiMLS
- 2024-03-11 Sold (MLS) $289,775 SW Michigan MLS
- 2024-03-11 Sold (MLS) $289,775 REALCOMP
- 2023-09-23 Pending — SW Michigan MLS
- 2023-09-23 Listed $289,775 MiRealSource-MiMLS
- 2023-09-23 Listing Removed — MiRealSource-MiMLS
- 2023-09-23 Listed $289,775 SW Michigan MLS
- 2023-09-23 Listing Removed — REALCOMP
- 2023-09-23 Listed $289,775 REALCOMP
- 2023-08-30 Sold (Public Records) $49,500 Public Records
Property tax history
+275.6%/yrLatest (2025): $5,196 · +109.8% YoY. Source: county tax records.
Cash-flow waterfall
monthlySold comps — $/sqft
last 12 mo · ≤1 miLoading sold comps…