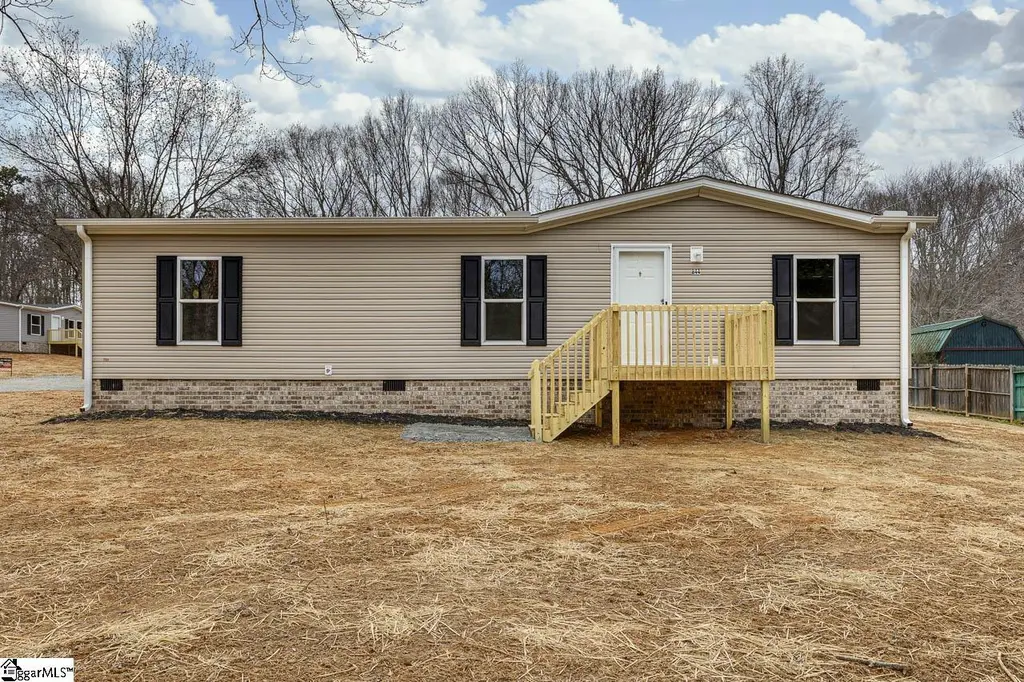
844 Black Snake Rd · Easley, SC
Flood risk 1/10 · Minimal
- FEMA flood zone
- X (unshaded)
- Chance of flooding over 30 yrs
- 0.0%
- Est. flood insurance / yr
- $507 – $1,088
Fire risk 5/10 · Moderate
- Est. fire insurance / yr
- $783 – $1,453
Heat risk 5/10 · Moderate
- Hot days now (above 105°F)
- 7 days/yr
- Hot days in 30 yrs
- 17 days/yr
Wind risk 2/10 · Minimal
- Chance of severe wind over 30 yrs
- 0.0%
Air-quality risk 4/10 · Minor
- Unhealthy air days now
- 3 days/yr
- Unhealthy air days in 30 yrs
- 4 days/yr
Risk factors via First Street. Map © Google.
Why this score? — see what drove the D grade
The composite is a weighted blend of 9 inputs, each scored 0–100. Each bar is that input's sub-score; the figure is the points it added to the 100-point composite (weight × sub-score).
- Cash flow +10.8/30.0
- ARV discount +8.0/15.0
- Condition / age +4.0/5.0
- Rent growth +3.9/5.0
- Schools +3.9/10.0
- Livability +3.6/5.0
- 1% rule +3.2/10.0
- DSCR +3.1/10.0
- Appreciation +0.0/10.0
$228,000
🖨 Deal sheet 📄 Offer letter ✓ Due diligence
Listing remarks
Move right into this brand-new 3-bedroom, 2-bath home offering 1,440 sq ft of thoughtfully designed living space on a private half-acre lot with peaceful wooded views. Bright natural light fills the open-concept floor plan, where the kitchen, dining, and living areas flow together perfectly for entertaining and everyday living. The stylish kitchen features stainless steel appliances and ample cabinet space, while the spacious primary suite includes a full bath with a separate shower and soaking tub for a relaxing retreat. Enjoy quiet mornings with coffee on the back deck or host weekend cookouts surrounded by nature. The additional bedrooms offer flexibility for guests, a home office, or ho
Key facts
- Full bath
- Ample cabinet space
- 0.5 acre lot
Tags
Property features AI
Finance
- HOA & community: No HOA fees; No community amenities
Exterior
- Parking: Driveway parking; Gravel driveway shared or common
- Utilities: Public water; Electric water heater; Septic system; Private garbage pickup
- Home design: Single-story property; New construction (approximate year built 2025); New / never lived in; Crawl space foundation; Level lot with some trees; Approximately 1/2 acre lot
- Construction: Composition shingle roof
- Exterior features: Deck; Tilt-out windows; Vinyl/aluminum trim; Vinyl siding
Interior
- Kitchen: Kitchen approximately 14 x 11; Dishwasher; Refrigerator; Electric oven and freestanding electric range
- Bedrooms: Primary bedroom on main level with double sink and full bath; Bedroom sizes approximately: Primary 13 x 14, Second 10 x 12, Third 14 x 9
- Flooring: Vinyl flooring
- Bathrooms: Two full bathrooms (both on main level)
- Heating & cooling: Electric heating; Electric cooling
- Interior features: Open floor plan; Smoke detector; Garden tub and separate tub; Walk-in closet; Laminate countertops; No fireplace
- Laundry & utility: First-floor laundry with washer connection and electric dryer hookup; Laundry room
Neighborhood map
What this means for you Summary
Snapshot
- This is a 3-bed/2.0-bath manufactured listed at $228k. Condition is rated good.
Deal economics
- At list price, monthly cash flow is $-102 ($-1k/yr) — negative.
- To cash-flow at today's rent, offer at most $213k (6.5% below list).
- To meet the 1% rule (rent ≥ 1% of price), the offer needs to be $186k (18.2% below list).
- Recommended offer: $186k (18.2% below list) — sets the bar for 1% rule.
- Cap rate 5.8% vs local median 4.0% in Easley — top-decile yield for the area; either an underpriced asset or a hidden risk that comps aren't pricing in. Stress-test before assuming the spread holds.
Location & tenants
- Location reads 71/100 on livability (#47 in SC) — a middle-class / working-renter tenant base. Strengths: cost of living A+, housing A+; Watch: amenities D, commute F.
- Pickens 01 (rural): math 42% / reading 50% proficiency, ranked #21 of 80 in SC (top 26%) — families likely to look elsewhere, expect single-tenant / working-renter base with shorter leases.
- Zoned schools: Forest Acres Elementary (math 58% / reading 55%, grade C+, #108 of 597 statewide, top 18%, 710 students, 55% FRL).
- Market conditions: Rents rising fast (+5.7%/yr); 229 active listings in the ZIP; 2 comparable units currently listed for rent nearby; 1,440 units permitted in Pickens County in 2024 (245 in 5+ unit buildings).
- This rent runs 36% of the median local income ($62k/yr) — at the standard rent-burdened threshold; future hikes will face affordability resistance.
Forward outlook
- Local home prices are declining (-3.0%/yr); year-one equity from $2k of loan paydown is wiped out by about $7k of value loss. Plan a longer hold.
- Pickens County population projected at +6% by 2050 — modest demand growth; plan on rents tracking national, not racing it.
Negotiation context
- It's been on market 35 days — a 3% lower offer ($221k) is reasonable based on typical stale-listing flexibility.
- 3 sale attempts with the ask held roughly flat each time — persistent listings suggest the price (not the market) is what's stuck; bring a comps-based counter.
Risks & watch-outs
- Climate carrying-cost: moderate wildfire risk; extreme-heat days projected 7→17/yr by 2055 (HVAC capex compounding) — expect insurance premiums to compound above CPI over the hold.
Questions for the listing agent
- What do current leases actually rent for vs. the listed asking? Can we see a recent rent roll and the last 12 months of T-12 income?
- It's been on market 35 days. Have you received any prior offers? Is the seller open to a 18% concession, seller financing, or rate buy-down credit?
- Is there a deadline driving the sale (1031 exchange, divorce, estate, relocation)? That informs how much negotiation room exists.
- Schools are D-rated, which usually means shorter tenancies and higher turnover. Who's the typical renter profile here, and what's been the actual vacancy rate?
- The area grade is low — what's the realistic commute time and amenity access for the typical tenant pool here? Any planned neighborhood developments (good or bad) we should know about?
- What's the average days-on-market for RENTAL listings here right now (not sales)? A rising rental-DOM trend means longer vacancies and softer asking-rent achievability than the comps imply.
- What's the recent tenant-quality profile in this submarket — average credit score on applications, eviction rate, late-payment / NSF rate, and stable-employment percentage? A property-management company in the area should have these aggregated.
- How much new for-sale + rental construction is in the pipeline within 1–3 miles? Heavy new supply typically softens prices + rents 12–24 months out; constrained supply supports both.
Investment metrics
- 1% rule
- 0.82% ✗
- Cap rate
- 5.75%
- Cash-on-cash
- -1.92%
- DSCR
- 0.91
- GRM
- 10.2
CMA / ARV
- ARV (on-the-fly)
- $230,400
- Comps found
- 2
Show comp detail 2 sales within ~0.75 mi
| Address | Dist | Beds/Ba | Sqft | Sold | Price | $/sf | Match |
|---|---|---|---|---|---|---|---|
| 852 Black Snake Rd | 0.05mi | 3/2.0 | 1,440 (0%) | 3mo | $230,000 | $160 | 96 |
| 879 Black Snake Rd | 0.14mi | 4/2.0 (+1) | 1,630 (+13%) | 2mo | $207,500 | $127 | 65 |
Match score weights: distance 35% · size 25% · config 20% · recency 20%. Top-matched comps best support the ARV.
Projected returns pro-forma
-3.0% appreciation · 5.69% rent growth · sell at horizon
- IRR
- -16.5%
- Equity multiple
- 0.40×
- Total profit
- $-38,252
- Equity at exit
- $33,996
- IRR
- -4.0%
- Equity multiple
- 0.70×
- Total profit
- $-19,111
- Equity at exit
- $19,713
Cash invested: $63,840 (down + closing). Projections, not guarantees.
Landlord ↔ Tenant lean methodology
- Overall (STATE)
- 90 Strongly Landlord-Friendly
- State South Carolina
- 90 Strongly Landlord-Friendly · R+6
- County
- — inherits STATE
- City
- — inherits STATE
ZIP-level market 29640
- Home prices YoY
- -28.0%
- Rents YoY
- 5.7%
- Active inventory
- 229
- Price-to-rent
- 10.2×
Monthly cashflow live
- Estimated rent
- $1,865 medium interval (Pro) →
- Mortgage (P&I)
- −$1,196
- Tax est. 1.5%
- −$285 /mo · $3,420/yr
- Insurance
- −$95
- HOA
- −$0
- Vacancy / Maint / Mgmt
- −$392
- Net cashflow
- $-102
Break-even live
UW: 25.0% down · 7.5% · 30yr · 1.5% tax · 5.0% vac · 8.0% maint · 8.0% mgmt
Financing live
Cash to close
- Down payment
- $57,000
- Closing costs
- $6,840
- Reserves months
- —
- Total cash needed
- —
Loan-product check · same deal, 3 products live
Conventional
25% down · 7.5% · 30yr
- Down + closing
- —
- Monthly P&I
- —
- Monthly cashflow
- —
- DSCR
- —
- Eligible?
- —
Personal DTI + credit; lowest rate.
DSCR
20% down · 8.5% · 30yr
- Down + closing
- —
- Monthly P&I
- —
- Monthly cashflow
- —
- DSCR
- —
- Eligible?
- —
No personal income docs; deal must DSCR.
Hard money
10% down · 12.0% · 12mo
- Down + closing
- —
- Monthly P&I
- —
- Monthly cashflow
- —
- DSCR
- —
- Eligible?
- —
Short-term bridge; refi at stabilization.
Rent comps 2 comps
| Address | Beds | Baths | Sqft | Rent | $/sqft | DOM | Units | Dist |
|---|---|---|---|---|---|---|---|---|
| 402 Jamestown Rd Easley, SC | 3.0 | 1.5 | 1300 | $1,750 | $1.35 | 12d | 1 | 0.59mi |
| 423 Rollingwood Dr Easley, SC | 3.0 | 2.5 | 1390 | $1,695 | $1.22 | 3d | 1 | 0.79mi |
Listing history 22 events
-
2026-06-18days on market $228,000 Active 35 DOM
-
2026-06-17price $228,000 Active 34 DOM
-
2026-06-17days on market $229,000 Active 34 DOM
-
2026-06-16days on market $229,000 Active 33 DOM
-
2026-06-15days on market $229,000 Active 32 DOM
-
2026-06-13days on market $229,000 Active 30 DOM
-
2026-06-10days on market $229,000 Active 27 DOM
-
2026-06-09days on market $229,000 Active 26 DOM
-
2026-06-08days on market $229,000 Active 25 DOM
-
2026-06-07pricedays on market $229,000 Active 24 DOM
-
2026-06-05pricedays on market $236,000 Active 21 DOM
-
2026-06-03days on market $237,000 Active 20 DOM
-
2026-06-03pricedays on market $237,000 Active 19 DOM
-
2026-06-01pricedays on market $238,000 Active 18 DOM
-
2026-05-31days on market $239,000 Active 17 DOM
-
2026-05-15price $239,000
-
2026-05-14status Active
-
2026-05-14historical
-
2026-05-14$239,000 Active
-
2026-03-20historical Contingency Contract
-
2026-03-07price $237,000
-
2026-02-12$239,000 Active
ⓘ Source: listings_history table (triggers on properties + properties_extension) + one-shot
backfill from property_details.listing_events for pre-trigger history.
Climate risk First Street
- Flood 1/10 Low FEMA zone X (unshaded) · 0% chance over 30 yrs
- Wildfire 5/10 Major
- Heat 5/10 Major 7 d/yr ≥105°F today · 17 d/yr by 30 yrs out
- Wind 2/10 Low 0% chance of damaging wind over 30 yrs
- Air quality 4/10 Moderate 3 unhealthy d/yr today · 4 by 30 yrs out
Nearby sold comps map
Loading sold comps map…
Walkable amenities ~0.75 mi
Loading nearby amenities…
Taxation est. · year 1
- Rental income
- $22,380
- − Mortgage interest
- −$12,772
- − Property taxes
- −$3,420
- − Insurance
- −$1,140
- − Repairs & maintenance
- −$1,790
- − Management
- −$1,790
- − Depreciation
- −$6,633
- Taxable loss
- −$5,165
- Est. tax savings @ 24.0%
- +$1,240
- After-tax cash flow
- $12/yr
For passive investors: Depreciation is non-cash, so a rental often shows a tax loss while cash-flowing — sheltering income. Rental losses are passive: they offset passive income freely, and up to $25,000/yr can offset ordinary (W-2) income if you actively participate and your MAGI is under $100k (phasing out to $0 by $150k); unused losses carry forward. On sale, claimed depreciation is recaptured at up to 25%, and gains may owe capital-gains tax (a 1031 exchange can defer both). Figures are a year-1 estimate at your 24.0% rate — not tax advice; consult a CPA.
Condition & rehab AI · 12 photos
This move-in-ready manufactured home offers a spacious and well-maintained interior with modern finishes and a private half-acre lot. It is in excellent condition with minimal maintenance required.
Value-add opportunities
- Both Painting the exterior and interior walls — Fresh paint can enhance curb appeal and interior aesthetics.
- Both Landscaping improvements — Enhanced landscaping can increase curb appeal and property value.
- Rental Adding a small shed or storage unit — Can provide additional storage for tenants or renters.
Renovation cost estimate screening
Value-add ROI direction
- Both Painting the exterior and interior walls — Fresh paint can enhance curb appeal and interior aesthetics. ↑
- Both Landscaping improvements — Enhanced landscaping can increase curb appeal and property value. ↑
- Rental Adding a small shed or storage unit — Can provide additional storage for tenants or renters. ↑
ⓘ Cost ranges are severity-bucket heuristics (US national rule-of-thumb). Get contractor quotes + a written scope before underwriting a rehab budget.
Schools (NCES district)
- District
- Pickens 01
- NCES district ID
- 4503330
- Math proficiency
- 42% ▼ -11.00%
- Reading proficiency
- 50% ▼ -2.00%
- Median HH income
- $42,534
- Composite
- 38.73/100
- National rank
- #4130
- State rank
- #21 of 80 in SC
Livability — Easley
- Score
- 71/100
- State rank
- #47
- US rank
- #6783
Category grades
Schools grade is shown separately in the Schools card above.
Census & demographics
- County
- Pickens County · 102,825 people
- City population
- 69,994
- Metro
- Greenville-Anderson, SC
- Population (ZIP)
- 33,142
- Household income
- $62,207
- Rent vs Own
- Severe rent burden
- 789.0
Population outlook (Pickens County) Hauer SSP2
- Today (2025)
- 126,530 people
- By 2030
- 128,780 · +1.8%
- By 2040
- 132,151 · +4.4%
- By 2050
- 133,800 · +5.7%
- By 2075
- 137,594 · +8.7%
- By 2100
- 139,784 · +10.5%
Race, ethnicity, and origin ACS 2023
- Neighborhood character
- Predominantly White (81%)
- Race & ethnicity
- White 81% Hispanic / Latino 8% Black 8% Two or more races 4%
- Hispanic origin (detail)
- Mexican 4% Puerto Rican 3%
- Common ancestry
- Slovak 2% Serbian 2% Italian 2%
- Foreign-born
- 3% · Canada
- Languages at home
- 95% English-only · Spanish 4%
Political lean MEDSL · Pickens
- 2024 margin
- Solid R (+52.7) · D 23.0% · R 75.6% · Other 1.4%
- 2008→2024 swing
- -6.4pp toward R · 2008: -46.2pp · 2024: -52.7pp
- All cycles
- 2024: R+52.7 2020: R+50.9 2016: R+52.7 2012: R+49.0 2008: R+46.2
Not yet ingested
- Civics
- —
Market trends
- HPI YoY
- ▼ -106.69%
- Current HPI
- 274.4751
- Rent YoY
- ▲ 5.69%
- Metro
- Greenville-Anderson, SC
- State GDP YoY
- ▲ 4.51%
- F500 in state
- 2
Industry mix (Fortune 500 HQ in SC)
| Industry | F500 HQs | Revenue |
|---|---|---|
| Packaging | 1 | $7B |
|
||
Price history
+0.0% since first listed7 events — show timeline
- 2026-05-15 Price Changed $239,000 Greater Greenville MLS
- 2026-05-14 Relisted — Greater Greenville MLS
- 2026-05-14 Listed $239,000 Greater Greenville MLS
- 2026-05-14 Listing Removed — Greater Greenville MLS
- 2026-03-20 Contingent — Greater Greenville MLS
- 2026-03-07 Price Changed $237,000 Greater Greenville MLS
- 2026-02-12 Listed $239,000 Greater Greenville MLS
Cash-flow waterfall
monthlySold comps — $/sqft
last 12 mo · ≤1 miLoading sold comps…