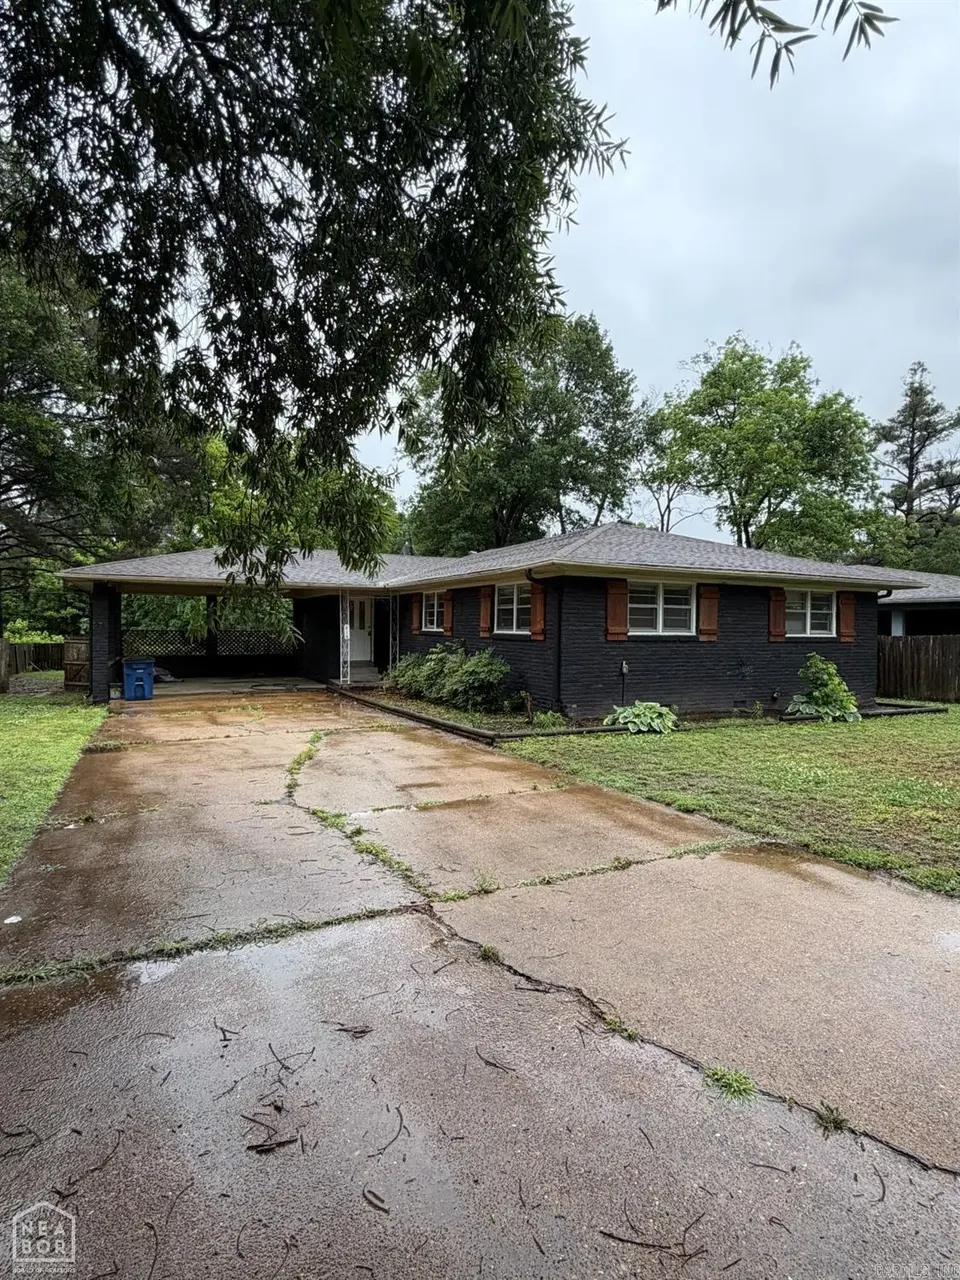
618 S Roselawn · West Memphis, AR
Flood risk 1/10 · Minimal
- FEMA flood zone
- X (shaded)
- Chance of flooding over 30 yrs
- 0.0%
- Est. flood insurance / yr
- $507 – $1,088
Fire risk 1/10 · Minimal
- Est. fire insurance / yr
- $1,499 – $2,785
Heat risk 7/10 · Major
- Hot days now (above 109°F)
- 7 days/yr
- Hot days in 30 yrs
- 21 days/yr
Wind risk 4/10 · Minor
- Chance of severe wind over 30 yrs
- 16.0%
Air-quality risk 2/10 · Minimal
- Unhealthy air days now
- 2 days/yr
- Unhealthy air days in 30 yrs
- 2 days/yr
Risk factors via First Street. Map © Google.
Why this score? — see what drove the C grade
The composite is a weighted blend of 9 inputs, each scored 0–100. Each bar is that input's sub-score; the figure is the points it added to the 100-point composite (weight × sub-score).
- Cash flow +21.9/30.0
- ARV discount +13.5/15.0
- DSCR +7.0/10.0
- 1% rule +4.6/10.0
- Livability +2.8/5.0
- Rent growth +2.5/5.0
- Condition / age +2.5/5.0
- Schools +1.2/10.0
- Appreciation +0.0/10.0
$160,000
🖨 Deal sheet (PDF) 📄 Offer letter ✓ Due diligence
Listing remarks
Unlock the potential in this foreclosed property offering a great opportunity for investors, flippers, or buyers looking to customize a home to their vision. This residential property is being sold as is, where is, with no repairs or warranties provided by the seller. With solid possibilities and plenty of potential, this home is ready for the right buyer to bring it back to life. Whether you're searching for your next renovation project, rental investment, or future residence, this property presents a chance to add value and make it your own. Conveniently located and priced to reflect its current condition, this is an excellent opportunity for those ready to invest in potential. Property i
Key facts
- Residential property
- Foreclosed property
- Rental investment
Tags
Property features AI
Finance
- Financial info: Potential financing: other (see remarks)
Exterior
- Parking: Carport for 2 cars
- Utilities: Public sewer; Public water; Municipal electric (Entergy); Natural gas
- Home design: Brick exterior; Inside city limits; Subdivision: Avalon Heights
- Construction: Architectural shingle roof; Crawl space foundation
- Exterior features: Patio; Wood fence; Paved road access; Zero lot line
Interior
- Flooring: Wood flooring; Luxury vinyl flooring
- Bathrooms: 2 full bathrooms
- Heating & cooling: Central gas heating; Central gas cooling
- Interior features: Wood and luxury vinyl flooring; Kitchen equipment: other (see remarks)
Neighborhood map
What this means for you Summary
Snapshot
- This is a 3-bed/1.5-bath single-family listed at $160k.
Deal economics
- At list price, monthly cash flow is $252 ($3k/yr) — positive.
- The deal already cash-flows at list — no discount required.
- To meet the 1% rule (rent ≥ 1% of price), the offer needs to be $153k (4.2% below list).
- Recommended offer: $153k (4.2% below list) — sets the bar for 1% rule.
Location & tenants
- Location reads 55/100 on livability (#413 in AR) — a working-class tenant base; expect higher turnover. Strengths: cost of living A+, housing A; Watch: crime F, amenities F, commute F.
- West Memphis School District (suburban): math 16% / reading 15% proficiency, ranked #224 of 238 in AR (top 94%) — low school quality limits family demand, transient renter base, plan for 1-2y turnover; 96% free/reduced lunch — lower-income household profile, screen leases tightly.
- Zoned schools: The Academies of West Memphis Charter School (math 7% / reading 22%, grade F, #265 of 292 statewide, top 91%, 952 students, 100% FRL, charter) — zoned schools at 100% FRL track the district average.
- Market conditions: 133 active listings in the ZIP; 3 comparable units currently listed for rent nearby; rentals leasing fast (median 2d on market — plan ~1-2 weeks tenant-placement turnaround); 69 units permitted in Crittenden County in 2024 (0 in 5+ unit buildings).
Forward outlook
- Local home prices are declining (-3.0%/yr); year-one equity from $1k of loan paydown is wiped out by about $5k of value loss. Plan a longer hold.
- Crittenden County population projected at -26% by 2050 — secular population decline; favor cash flow + early exit over multi-decade hold.
Negotiation context
- Only 3 days on market — expect competitive offers; lowballing is unlikely to land.
- 5 sale attempts since 2y ago with the ask held roughly flat each time — persistent listings suggest the price (not the market) is what's stuck; bring a comps-based counter.
Risks & watch-outs
- Climate carrying-cost: extreme-heat days projected 7→21/yr by 2055 (HVAC capex compounding) — expect insurance premiums to compound above CPI over the hold.
Questions for the listing agent
- Built in 1964 — when were the roof, HVAC, electrical panel, plumbing, and water heater last replaced?
- Is there a deadline driving the sale (1031 exchange, divorce, estate, relocation)? That informs how much negotiation room exists.
- Schools are D-rated, which usually means shorter tenancies and higher turnover. Who's the typical renter profile here, and what's been the actual vacancy rate?
- Crime grade is F in this area — have there been break-ins, vandalism, or insurance claims at this property in the last 3 years? What carrier currently insures it and at what premium?
- What's the average days-on-market for RENTAL listings here right now (not sales)? A rising rental-DOM trend means longer vacancies and softer asking-rent achievability than the comps imply.
- What's the recent tenant-quality profile in this submarket — average credit score on applications, eviction rate, late-payment / NSF rate, and stable-employment percentage? A property-management company in the area should have these aggregated.
- How much new for-sale + rental construction is in the pipeline within 1–3 miles? Heavy new supply typically softens prices + rents 12–24 months out; constrained supply supports both.
Investment metrics
- 1% rule
- 0.96% ✗
- Cap rate
- 8.18%
- Cash-on-cash
- 6.74%
- DSCR
- 1.30
- GRM
- 8.7
CMA / ARV
- ARV (on-the-fly)
- $184,440
- Comps found
- 12
Show comp detail 12 sales within ~0.75 mi
| Address | Dist | Beds/Ba | Sqft | Sold | Price | $/sf | Match |
|---|---|---|---|---|---|---|---|
| 618 S Roselawn | 0.00mi | 3/2.0 | 1,537 (0%) | 0mo | $140,000 | $91 | 98 |
| 813 Pryor Dr | 0.30mi | 3/2.0 | 1,581 (+3%) | 8mo | $175,000 | $111 | 73 |
| 908 Roselawn Dr | 0.53mi | 3/2.0 | 1,442 (-6%) | 2mo | $90,000 | $62 | 61 |
| 702 Dover Rd | 0.39mi | 3/1.0 | 1,695 (+10%) | 2mo | $63,000 | $37 | 61 |
| 1108 N Rich Rd | 0.33mi | 3/1.5 | 1,335 (-13%) | 2mo | $190,000 | $142 | 61 |
| 906 N Roselawn Dr | 0.52mi | 4/2.0 (+1) | 1,560 (+2%) | 8mo | $187,900 | $120 | 60 |
| 1010 Arlington Dr | 0.61mi | 3/2.0 | 1,467 (-5%) | 3mo | $239,000 | $163 | 59 |
| 1010 Clement Rd | 0.72mi | 3/2.0 | 1,510 (-2%) | 8mo | $235,000 | $156 | 55 |
| 511 Balfour Rd | 0.62mi | 3/2.0 | 1,736 (+13%) | 3mo | $190,000 | $109 | 46 |
| 213 S Worthington Dr | 0.68mi | 3/2.0 | 1,375 (-10%) | 6mo | $169,900 | $124 | 43 |
| 1012 Clement Rd | 0.72mi | 4/2.0 (+1) | 1,706 (+11%) | 8mo | $280,000 | $164 | 34 |
| 1417 Chester Ln | 0.73mi | 4/2.5 (+1) | 1,683 (+10%) | 9mo | $202,000 | $120 | 34 |
Match score weights: distance 35% · size 25% · config 20% · recency 20%. Top-matched comps best support the ARV.
Projected returns pro-forma
-3.0% appreciation · 3.0% rent growth · sell at horizon
- IRR
- -6.0%
- Equity multiple
- 0.78×
- Total profit
- $-9,958
- Equity at exit
- $23,857
- IRR
- 3.6%
- Equity multiple
- 1.26×
- Total profit
- $11,705
- Equity at exit
- $13,834
Cash invested: $44,800 (down + closing). Projections, not guarantees.
Landlord ↔ Tenant lean methodology
- Overall (STATE)
- 92 Strongly Landlord-Friendly
- State Arkansas
- 92 Strongly Landlord-Friendly · R+14
- County
- — inherits STATE
- City
- — inherits STATE
ZIP-level market 72301
- Active inventory
- 133
- Price-to-rent
- 8.7×
Monthly cashflow live
- Estimated rent
- $1,533 medium interval (Pro) →
- Mortgage (P&I)
- −$839
- Tax from tax record
- −$54 /mo · $642/yr
- Insurance
- −$67
- HOA
- −$0
- Vacancy / Maint / Mgmt
- −$322
- Net cashflow
- $252
Break-even live
Sensitivity live
| Price | -10% $342 | -5% $297 | +0% $252 | +5% $206 | +10% $161 |
|---|---|---|---|---|---|
| Rent | -10% $131 | -5% $191 | +0% $252 | +5% $312 | +10% $373 |
| Rate | -1.0pp $332 | -0.5pp $292 | base $252 | +0.5pp $210 | +1.0pp $168 |
UW: 25.0% down · 7.5% · 30yr · 1.5% tax · 5.0% vac · 8.0% maint · 8.0% mgmt
Financing live
Cash to close
- Down payment
- $40,000
- Closing costs
- $4,800
- Reserves months
- —
- Total cash needed
- —
Loan-product check · same deal, 3 products live
Conventional
25% down · 7.5% · 30yr
- Down + closing
- —
- Monthly P&I
- —
- Monthly cashflow
- —
- DSCR
- —
- Eligible?
- —
Personal DTI + credit; lowest rate.
DSCR
20% down · 8.5% · 30yr
- Down + closing
- —
- Monthly P&I
- —
- Monthly cashflow
- —
- DSCR
- —
- Eligible?
- —
No personal income docs; deal must DSCR.
Hard money
10% down · 12.0% · 12mo
- Down + closing
- —
- Monthly P&I
- —
- Monthly cashflow
- —
- DSCR
- —
- Eligible?
- —
Short-term bridge; refi at stabilization.
Rent comps 3 comps
| Address | Beds | Baths | Sqft | Rent | $/sqft | DOM | Units | Dist |
|---|---|---|---|---|---|---|---|---|
| 911 N Avalon St Unit Future applicants West Memphis, AR | 2.0 | 2.0 | 1057 | $1,500 | $1.42 | 2d | 1 | 0.33mi |
| 905 Maple Dr West Memphis, AR | 4.0 | 2.0 | 1176 | $1,495 | $1.27 | 24d | 1 | 1.43mi |
| 905 Maple Dr West Memphis, AR | 4.0 | 2.0 | 1176 | $1,699 | $1.44 | 2d | 1 | 1.43mi |
Listing history 16 events
-
2026-05-14status Under Contract
-
2026-05-08$160,000 New Listing
-
2025-05-08$174,900 Active
-
2024-12-03$184,900 Active
-
2024-11-13price $180,000
-
2024-11-08status Active
-
2024-10-29status Pending
-
2024-09-03price $170,000
-
2024-08-14price $190,000
-
2024-06-25price $199,000
-
2024-06-06price $210,000
-
2024-05-25$215,000 Active
-
2021-07-20soldstatus $149,900
-
2017-10-13soldstatus $113,000
-
2006-05-31soldstatus $106,000
-
2003-10-15soldstatus $95,000
ⓘ Source: listings_history table (triggers on properties + properties_extension) + one-shot
backfill from property_details.listing_events for pre-trigger history.
Tax reassessment forecast AR · Resets to sale price
- Current annual tax
- $642 · $54/mo
- Projected year-2 tax
- $1,024 · $85/mo
- Expected delta
- +$382/yr (+$32/mo · 59.5%)
ⓘ Screening estimate from a state-policy table — verify with the county assessor before closing.
Climate risk First Street
- Flood 1/10 Low FEMA zone X (shaded) · 0% chance over 30 yrs
- Wildfire 1/10 Low
- Heat 7/10 Severe 7 d/yr ≥109°F today · 21 d/yr by 30 yrs out
- Wind 4/10 Moderate 16% chance of damaging wind over 30 yrs
- Air quality 2/10 Low 2 unhealthy d/yr today · 2 by 30 yrs out
Nearby sold comps map
Loading sold comps map…
Walkable amenities ~0.75 mi
Loading nearby amenities…
Taxation est. · year 1
- Rental income
- $18,395
- − Mortgage interest
- −$8,962
- − Property taxes
- −$642
- − Insurance
- −$800
- − Repairs & maintenance
- −$1,472
- − Management
- −$1,472
- − Depreciation
- −$4,655
- Taxable income
- $393
- Est. tax owed @ 24.0%
- −$94
- After-tax cash flow
- $2,927/yr
For passive investors: Depreciation is non-cash, so a rental often shows a tax loss while cash-flowing — sheltering income. Rental losses are passive: they offset passive income freely, and up to $25,000/yr can offset ordinary (W-2) income if you actively participate and your MAGI is under $100k (phasing out to $0 by $150k); unused losses carry forward. On sale, claimed depreciation is recaptured at up to 25%, and gains may owe capital-gains tax (a 1031 exchange can defer both). Figures are a year-1 estimate at your 24.0% rate — not tax advice; consult a CPA.
Schools (NCES district)
- District
- West Memphis School District
- NCES district ID
- 0508040
- Math proficiency
- 16% ▼ -14.00%
- Reading proficiency
- 15% ▼ -14.00%
- Median HH income
- $29,382
- Composite
- 12.22/100
- National rank
- #9647
- State rank
- #224 of 238 in AR
Livability — West Memphis
- Score
- 55/100
- State rank
- #413
- US rank
- #23638
Category grades
Schools grade is shown separately in the Schools card above.
Census & demographics
- Census place
- West Memphis, AR
- City population
- 24,182
- Population (ZIP)
- 24,182
Population outlook (Crittenden County) Hauer SSP2
- Today (2025)
- 45,254 people
- By 2030
- 42,953 · -5.1%
- By 2040
- 38,235 · -15.5%
- By 2050
- 33,670 · -25.6%
- By 2075
- 24,315 · -46.3%
- By 2100
- 17,173 · -62.1%
Race, ethnicity, and origin ACS 2023
- Neighborhood character
- Majority Black (64%)
- Race & ethnicity
- Black 64% White 29% Two or more races 6% Hispanic / Latino 2%
- Common ancestry
- Serbian 1%
- Foreign-born
- 1% · Canada
- Languages at home
- 98% English-only · Spanish 1%
Political lean MEDSL · Crittenden
- 2024 margin
- Toss-up / Even · D 50.1% · R 47.9% · Other 2.0%
- 2008→2024 swing
- -12.4pp toward R · 2008: 14.7pp · 2024: 2.3pp
- All cycles
- 2024: D+2.3 2020: D+7.2 2016: D+9.0 2012: D+18.7 2008: D+14.7
Not yet ingested
- Civics
- —
Market trends
- HPI YoY
- ▼ -143.63%
- Current HPI
- 182.7665
- Rent YoY
- —
- Metro
- —
- State GDP YoY
- ▲ 3.80%
- F500 in state
- 10
Industry mix (Fortune 500 HQ in AR)
| Industry | F500 HQs | Revenue |
|---|---|---|
| Retail | 1 | $681B |
|
||
| Food / Agriculture | 1 | $53B |
|
||
| Retail / Energy | 1 | $22B |
|
||
| Transportation / Logistics | 1 | $12B |
|
||
| Energy | 1 | $4B |
|
||
Price history
+68.4% since first listed16 events — show timeline
- 2026-05-14 Pending — CARMLS
- 2026-05-08 Listed $160,000 CARMLS
- 2025-05-08 Listed $174,900 EARA
- 2024-12-03 Listed $184,900 EARA
- 2024-11-13 Price Changed $180,000 EARA
- 2024-11-08 Relisted — EARA
- 2024-10-29 Pending — EARA
- 2024-09-03 Price Changed $170,000 EARA
- 2024-08-14 Price Changed $190,000 EARA
- 2024-06-25 Price Changed $199,000 EARA
- 2024-06-06 Price Changed $210,000 EARA
- 2024-05-25 Listed $215,000 EARA
- 2021-07-20 Sold (Public Records) $149,900 Public Records
- 2017-10-13 Sold (Public Records) $113,000 Public Records
- 2006-05-31 Sold (Public Records) $106,000 Public Records
- 2003-10-15 Sold (Public Records) $95,000 Public Records
Property tax history
-2.9%/yrLatest (2025): $642 · -5.9% YoY. Source: county tax records.
Cash-flow waterfall
monthlySold comps — $/sqft
last 12 mo · ≤1 miLoading sold comps…