6058 National Blvd Ave #318 · Ave Maria, FL
Flood risk No data
- FEMA flood zone
- —
- Chance of flooding over 30 yrs
- —
- Est. flood insurance / yr
- —
Fire risk No data
- Est. fire insurance / yr
- —
Heat risk No data
- Hot days now (above threshold)
- —
- Hot days in 30 yrs
- —
Wind risk No data
- Chance of severe wind over 30 yrs
- —
Air-quality risk No data
- Unhealthy air days now
- —
- Unhealthy air days in 30 yrs
- —
Risk factors via First Street. Map © Google.
Why this score? — see what drove the F grade
The composite is a weighted blend of 9 inputs, each scored 0–100. Each bar is that input's sub-score; the figure is the points it added to the 100-point composite (weight × sub-score).
- ARV discount +7.5/15.0
- Schools +5.0/10.0
- Appreciation +4.5/10.0
- Rent growth +3.2/5.0
- 1% rule +2.9/10.0
- Cash flow +2.5/30.0
- Livability +2.5/5.0
- Condition / age +2.5/5.0
- DSCR +0.0/10.0
$311,846
🖨 Deal sheet (PDF) 📄 Offer letter ✓ Due diligence
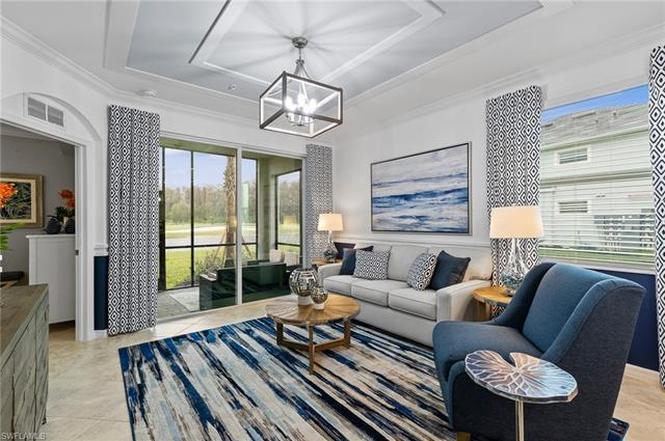
Listing remarks
Former Model – Largest Floor Plan | Never Lived In | Deeded Golf Membership | Fully Furnished & decorated! Welcome to 6058 National Blvd #318, a stunning, never-lived-in former model home featuring the largest single-story condo floor plan in the community—offered fully furnished and complete with a deeded golf membership in the highly sought-after National Golf & Country Club at Ave Maria. This spacious and stylish residence offers 2 bedrooms plus a den (ideal as a third bedroom, home office, or flex space), 2 full bathrooms, and a bright, open-concept layout perfect for both entertaining and relaxed everyday living. The modern kitchen opens to a dedicated dining ar
Key facts
- Built 2021
Property features AI
Finance
- HOA & community: Building fitness center
Exterior
- Home design: Condo
- Construction: Living area approximately 1301
Interior
- Kitchen: Dishwasher
- Bedrooms: 2 bedrooms
- Bathrooms: 2 bathrooms
- Heating & cooling: Air conditioning
- Interior features: Furnished; 3 total rooms
Neighborhood map
What this means for you Summary
Snapshot
- This is a 2-bed/2.0-bath condo listed at $312k.
Deal economics
- At list price, monthly cash flow is $-1k ($-13k/yr) — negative.
- To cash-flow at today's rent, offer at most $281k (9.8% below list).
- To meet the 1% rule (rent ≥ 1% of price), the offer needs to be $246k (21.1% below list).
- Recommended offer: $246k (21.1% below list) — sets the bar for 1% rule.
Location & tenants
- Location reads: area grade F — affects rentability + tenant quality, not the cash-flow math above.
- Collier (suburban): math 60% / reading 56% proficiency, ranked #16 of 73 in FL (top 22%) — acceptable for families but not a draw, mixed tenant base, ~2y average lease.
- Zoned schools: Estates Elementary School (math 70% / reading 67%, grade B+, #409 of 2,144 statewide, top 20%, 862 students, 53% FRL); Corkscrew Middle School (math 68% / reading 59%, grade B+, #109 of 571 statewide, top 19%, 958 students, 43% FRL); Palmetto Ridge High School (math 43% / reading 51%, grade D-, #207 of 667 statewide, top 32%, 2,347 students, 38% FRL).
- Market conditions: Rents rising (+3.0%/yr); 453 active listings in the ZIP; 40 comparable units currently listed for rent nearby; rentals at typical pace (median 25d on market — plan ~3-4 weeks tenant-placement turnaround); 3,520 units permitted in Collier County in 2024 (959 in 5+ unit buildings).
- At $2,460/mo this rent would consume 47% of the median local household income ($62k/yr) (locally 1093% of renters already pay >50% of income on rent) — very limited rent-growth headroom before tenants either downsize or default.
Forward outlook
- Local home prices are declining (-1.1%/yr); year-one equity from $2k of loan paydown is wiped out by about $3k of value loss. Plan a longer hold.
- Collier County population projected at +30% by 2050 — long-run rental-demand tailwind backs the buy-and-hold thesis.
Negotiation context
- It's been on market 97 days — a 9% lower offer ($284k) is reasonable based on typical stale-listing flexibility.
Risks & watch-outs
- Watch-outs: HOA is 35% of rent.
Questions for the listing agent
- What do current leases actually rent for vs. the listed asking? Can we see a recent rent roll and the last 12 months of T-12 income?
- It's been on market 97 days. Have you received any prior offers? Is the seller open to a 21% concession, seller financing, or rate buy-down credit?
- What does the HOA fee cover, when was the last increase, and are there any pending special assessments or reserve-fund shortfalls?
- Any open or pending special assessments — roof, HVAC, plumbing, elevator, façade? What's the per-unit balance and payoff schedule, and is the seller paying it off at close or rolling it to the buyer?
- Why hasn't it sold? Are there any deal-killer items the seller is aware of (foundation, flood, title, zoning, code violations)?
- Is there a deadline driving the sale (1031 exchange, divorce, estate, relocation)? That informs how much negotiation room exists.
- The area grade is low — what's the realistic commute time and amenity access for the typical tenant pool here? Any planned neighborhood developments (good or bad) we should know about?
- What's the average days-on-market for RENTAL listings here right now (not sales)? A rising rental-DOM trend means longer vacancies and softer asking-rent achievability than the comps imply.
- What's the recent tenant-quality profile in this submarket — average credit score on applications, eviction rate, late-payment / NSF rate, and stable-employment percentage? A property-management company in the area should have these aggregated.
- How much new apartment / multifamily construction is in the pipeline within 1–3 miles? Heavy new supply (>2% of stock underway) typically softens rents 12–24 months out; light construction supports rent growth.
Investment metrics
- 1% rule
- 0.79% ✗
- Cap rate
- 2.15%
- Cash-on-cash
- -14.80%
- DSCR
- 0.34
- GRM
- 10.6
CMA / ARV
No comps found within radius.
Projected returns pro-forma
-1.05% appreciation · 2.95% rent growth · sell at horizon
- IRR
- -25.5%
- Equity multiple
- -0.06×
- Total profit
- $-92,298
- Equity at exit
- $74,555
- IRR
- -19.3%
- Equity multiple
- -0.63×
- Total profit
- $-142,179
- Equity at exit
- $77,675
Cash invested: $87,317 (down + closing). Projections, not guarantees.
Landlord ↔ Tenant lean methodology
- Overall (STATE)
- 87 Strongly Landlord-Friendly
- State Florida
- 87 Strongly Landlord-Friendly · R+3
- County
- — inherits STATE
- City
- — inherits STATE
ZIP-level market 34142
- Home prices YoY
- -0.5%
- Rents YoY
- 3.0%
- Active inventory
- 453
- Price-to-rent
- 10.6×
Monthly cashflow live
- Estimated rent
- $2,460 medium interval (Pro) →
- Mortgage (P&I)
- −$1,635
- Tax est. 1.5%
- −$390 /mo · $4,678/yr
- Insurance
- −$130
- HOA est. from 1 same-building comp
- −$865
- Vacancy / Maint / Mgmt
- −$517
- Net cashflow
- $-1,077
Break-even live
Sensitivity live
| Price | -10% $-861 | -5% $-969 | +0% $-1,077 | +5% $-1,185 | +10% $-1,292 |
|---|---|---|---|---|---|
| Rent | -10% $-1,271 | -5% $-1,174 | +0% $-1,077 | +5% $-980 | +10% $-883 |
| Rate | -1.0pp $-920 | -0.5pp $-998 | base $-1,077 | +0.5pp $-1,158 | +1.0pp $-1,240 |
UW: 25.0% down · 7.5% · 30yr · 1.5% tax · 5.0% vac · 8.0% maint · 8.0% mgmt
Financing live
Cash to close
- Down payment
- $77,962
- Closing costs
- $9,355
- Reserves months
- —
- Total cash needed
- —
Loan-product check · same deal, 3 products live
Conventional
25% down · 7.5% · 30yr
- Down + closing
- —
- Monthly P&I
- —
- Monthly cashflow
- —
- DSCR
- —
- Eligible?
- —
Personal DTI + credit; lowest rate.
DSCR
20% down · 8.5% · 30yr
- Down + closing
- —
- Monthly P&I
- —
- Monthly cashflow
- —
- DSCR
- —
- Eligible?
- —
No personal income docs; deal must DSCR.
Hard money
10% down · 12.0% · 12mo
- Down + closing
- —
- Monthly P&I
- —
- Monthly cashflow
- —
- DSCR
- —
- Eligible?
- —
Short-term bridge; refi at stabilization.
Rent comps 40 comps
| Address | Beds | Baths | Sqft | Rent | $/sqft | DOM | Units | Dist |
|---|---|---|---|---|---|---|---|---|
| 6058 National Blvd #335 Ave Maria, FL | 2.0 | 2.0 | 1120 | $5,795 | $5.17 | 15d | 1 | 0.01mi |
| 6058 National Blvd Ave Maria, FL | 2.0–3.0 | 2.0 | 1210 | $2,995 | $2.47 | 25d | 2 | 0.01mi |
| 6058 National Blvd #343 Ave Maria, FL | 2.0 | 2.0 | 1194 | $4,000 | $3.35 | 25d | 1 | 0.02mi |
| 6023 Ellerston Way #1823 Ave Maria, FL | 3.0 | 2.0 | 1695 | $2,995 | $1.77 | 25d | 1 | 0.06mi |
| 6046 National Blvd Ave Maria, FL | 2.0 | 2.0 | 1154 | $4,395 | $3.81 | 25d | 2 | 0.08mi |
| 6082 National Blvd Ave Maria, FL | 2.0 | 2.0 | 1366 | $4,145 | $3.03 | 25d | 2 | 0.09mi |
| 6034 National Blvd Ave Maria, FL | 2.0 | 2.0 | 1137 | $4,046 | $3.56 | 15d | 3 | 0.12mi |
| 6036 Ellerston WAY #1311 Ave Maria, FL | 3.0 | 2.0 | 1741 | $4,490 | $2.58 | 25d | 1 | 0.24mi |
| 5651 Double Eagle Cir #4316 Ave Maria, FL | 2.0 | 2.0 | 1154 | $5,495 | $4.76 | 25d | 1 | 0.24mi |
| 5651 Double Eagle Cir #4338 Ave Maria, FL | 2.0 | 2.0 | 1301 | $6,295 | $4.84 | 25d | 1 | 0.24mi |
| 5629 Double Eagle Cir #4218 Ave Maria, FL | 3.0 | 2.0 | 1301 | $6,295 | $4.84 | 25d | 1 | 0.24mi |
| 6039 Ellerston WAY #2017 Ave Maria, FL | 2.0 | 2.0 | 1355 | $6,295 | $4.65 | 25d | 1 | 0.24mi |
| 5835 Double Eagle CIR #4714 Ave Maria, FL | 2.0 | 2.0 | 1120 | $1,895 | $1.69 | 25d | 1 | 0.24mi |
| 5629 Double Eagle Cir #4223 Ave Maria, FL | 2.0 | 2.0 | 1154 | $2,395 | $2.08 | 25d | 1 | 0.24mi |
| 5445 Double Eagle Cir #3011 Ave Maria, FL | 2.0 | 2.0 | 1569 | $2,495 | $1.59 | 25d | 1 | 0.24mi |
| 5715 Double Eagle Cir #4416 Ave Maria, FL | 2.0 | 2.0 | 1154 | $2,100 | $1.82 | 25d | 1 | 0.24mi |
| 5704 Melbourne Ct #6712 Ave Maria, FL | 3.0 | 2.0 | 1741 | $7,295 | $4.19 | 25d | 1 | 0.24mi |
| 5629 Double Eagle Cir #4217 Ave Maria, FL | 2.0 | 2.0 | 1154 | $5,795 | $5.02 | 25d | 1 | 0.24mi |
| 5835 Double Eagle Cir #4726 Ave Maria, FL | 2.0 | 2.0 | 1154 | $2,095 | $1.82 | 15d | 1 | 0.24mi |
| 5710 Melbourne Ct #6511 Ave Maria, FL | 3.0 | 2.0 | 1741 | $7,295 | $4.19 | 25d | 1 | 0.24mi |
| 5909 Berwick Ln Ave Maria, FL | 2.0 | 2.0 | 1850 | $10,995 | $5.94 | 25d | 1 | 0.25mi |
| 6011 Ellerston Way #811 Ave Maria, FL | 3.0 | 2.0 | 1741 | $2,595 | $1.49 | 15d | 1 | 0.29mi |
| 5943 Sunningdale St Ave Maria, FL | 3.0 | 2.5 | 1850 | $10,995 | $5.94 | 25d | 1 | 0.29mi |
| 6040 Ellerston Way #1411 Ave Maria, FL | 3.0 | 2.0 | 1741 | $2,695 | $1.55 | 25d | 1 | 0.29mi |
| 5410 Double Eagle Cir #2222 Ave Maria, FL | 2.0 | 2.0 | 1355 | $2,395 | $1.77 | 25d | 1 | 0.31mi |
| 5807 Double Eagle Cir #4631 Ave Maria, FL | 3.0 | 2.0 | 1301 | $5,695 | $4.38 | 25d | 1 | 0.32mi |
| 5835 Double Eagle Cir Unit 4742 Ave Maria, FL | 2.0 | 2.0 | 1154 | $5,795 | $5.02 | 25d | 1 | 0.32mi |
| 5428 Double Eagle Cir #2517 Ave Maria, FL | 2.0 | 2.0 | 1355 | $2,695 | $1.99 | 25d | 1 | 0.32mi |
| 6047 Ellerston Way Unit 1 Ave Maria, FL | 2.0 | 2.0 | 1366 | $2,500 | $1.83 | 25d | 1 | 0.32mi |
| 6044 Ellerston Way #1511 Ave Maria, FL | 2.0 | 2.0 | 1741 | $2,695 | $1.55 | 21d | 1 | 0.35mi |
| 5427 Double Eagle Cir Ave Maria, FL | 2.0 | 2.0 | 1355 | $2,995 | $2.21 | 25d | 1 | 0.38mi |
| 5427 Double Eagle Cir #2812 Ave Maria, FL | 2.0 | 2.0 | 1355 | $2,395 | $1.77 | 15d | 1 | 0.38mi |
| 8010 Helena Ct Ave Maria, FL | 2.0 | 2.0 | 1554 | $2,500 | $1.61 | 23d | 1 | 0.38mi |
| 5433 Double Eagle Cir #2915 Ave Maria, FL | 2.0 | 2.0 | 1366 | $6,295 | $4.61 | 23d | 1 | 0.39mi |
| 5433 Double Eagle Cir Ave Maria, FL | 2.0 | 2.0 | 1366 | $3,295 | $2.41 | 25d | 1 | 0.41mi |
| 5478 Double Eagle Cir #3515 Ave Maria, FL | 2.0 | 2.0 | 1355 | $2,395 | $1.77 | 25d | 1 | 0.44mi |
| 5835 Double Eagle Cir Ave Maria, FL | 2.0 | 2.0 | 1154 | $5,495 | $4.76 | 25d | 1 | 0.47mi |
| 5466 Double Eagle Cir #3425 Ave Maria, FL | 2.0 | 2.0 | 1355 | $5,995 | $4.42 | 25d | 1 | 0.48mi |
| 5807 Double Eagle Cir #4635 Ave Maria, FL | 2.0 | 2.0 | 1120 | $5,195 | $4.64 | 25d | 1 | 0.51mi |
| 5807 Double Eagle Cir Ave Maria, FL | 3.0 | 2.0 | 1301 | $2,995 | $2.30 | 25d | 1 | 0.52mi |
HOA detail condo
- Monthly dues
- $0 · $0/yr
- Assessments
- None detected in remarks — confirm with the listing agent.
Listing history 15 events
-
2026-06-21days on market $311,846 Coming Soon 97 DOM
-
2026-06-18days on market $311,846 Coming Soon 94 DOM
-
2026-06-17days on market $311,846 Coming Soon 93 DOM
-
2026-06-16days on market $311,846 Coming Soon 92 DOM
-
2026-06-15days on market $311,846 Coming Soon 91 DOM
-
2026-06-14days on market $311,846 Coming Soon 89 DOM
-
2026-06-10days on market $311,846 Coming Soon 86 DOM
-
2026-06-09days on market $311,846 Coming Soon 85 DOM
-
2026-06-08days on market $311,846 Coming Soon 84 DOM
-
2026-06-07days on market $311,846 Coming Soon 83 DOM
-
2026-06-03days on market $311,846 Coming Soon 79 DOM
-
2026-06-02days on market $311,846 Coming Soon 78 DOM
-
2026-06-01days on market $311,846 Coming Soon 77 DOM
-
2026-05-31days on market $311,846 Coming Soon 76 DOM
-
2026-05-30days on market $311,846 Coming Soon 75 DOM
ⓘ Source: listings_history table (triggers on properties + properties_extension) + one-shot
backfill from property_details.listing_events for pre-trigger history.
Nearby sold comps map
Loading sold comps map…
Walkable amenities ~0.75 mi
Loading nearby amenities…
Taxation est. · year 1
- Rental income
- $29,518
- − Mortgage interest
- −$17,468
- − Property taxes
- −$4,678
- − Insurance
- −$1,559
- − Repairs & maintenance
- −$2,361
- − Management
- −$2,361
- − HOA
- −$10,380
- − Depreciation
- −$9,072
- Taxable loss
- −$18,362
- Est. tax savings @ 24.0%
- +$4,407
- After-tax cash flow
- $-8,515/yr
For passive investors: Depreciation is non-cash, so a rental often shows a tax loss while cash-flowing — sheltering income. Rental losses are passive: they offset passive income freely, and up to $25,000/yr can offset ordinary (W-2) income if you actively participate and your MAGI is under $100k (phasing out to $0 by $150k); unused losses carry forward. On sale, claimed depreciation is recaptured at up to 25%, and gains may owe capital-gains tax (a 1031 exchange can defer both). Figures are a year-1 estimate at your 24.0% rate — not tax advice; consult a CPA.
Schools (NCES district)
- District
- Collier
- NCES district ID
- 1200330
- Math proficiency
- 60% ▼ -4.00%
- Reading proficiency
- 56% ▼ -2.00%
- Median HH income
- $58,275
- Composite
- 50.23/100
- National rank
- #1892
- State rank
- #16 of 73 in FL
Livability — Ave Maria
No livability data for this city. (Only ~50 U.S. cities are tracked.)
Census & demographics
- Census place
- Ave Maria, FL
- County
- Collier County · 396,295 people
- Metro
- Naples-Marco Island, FL
- Population (ZIP)
- 35,149
- Household income
- $62,333
- Rent vs Own
- Severe rent burden
- 1093.0
Population outlook (Collier County) Hauer SSP2
- Today (2025)
- 420,858 people
- By 2030
- 450,054 · +6.9%
- By 2040
- 502,232 · +19.3%
- By 2050
- 544,932 · +29.5%
- By 2075
- 627,203 · +49.0%
- By 2100
- 659,015 · +56.6%
Race, ethnicity, and origin ACS 2023
- Neighborhood character
- Majority Hispanic (63%)
- Race & ethnicity
- Hispanic / Latino 63% Two or more races 39% Black 19% White 16% Native American 7%
- Hispanic origin (detail)
- Mexican 43% Puerto Rican 3% Cuban 2% Dominican 1%
- Common ancestry
- Hispanic 8% Slovak 1% Serbian 1%
- Foreign-born
- 32% · Canada, Jamaica
- Languages at home
- 34% English-only · Spanish 53% French/Haitian/Cajun 12%
Political lean MEDSL · Collier
- 2024 margin
- Solid R (+33.1) · D 33.1% · R 66.2%
- 2008→2024 swing
- -10.6pp toward R · 2008: -22.5pp · 2024: -33.1pp
- All cycles
- 2024: R+33.1 2020: R+24.7 2016: R+26.0 2012: R+30.1 2008: R+22.5
Not yet ingested
- Civics
- —
Market trends
- HPI YoY
- ▼ -1.05%
- Current HPI
- 226.9105
- Rent YoY
- ▲ 2.95%
- Metro
- Naples-Marco Island, FL
- State GDP YoY
- ▲ 3.28%
- F500 in state
- 36
Industry mix (Fortune 500 HQ in FL)
| Industry | F500 HQs | Revenue |
|---|---|---|
| Industrial Technology | 2 | $29B |
|
||
| Insurance | 2 | $17B |
|
||
| Retail | 1 | $60B |
|
||
| Technology Distribution | 1 | $58B |
|
||
| Homebuilding | 1 | $35B |
|
||
| Technology Manufacturing | 1 | $35B |
|
||
Cash-flow waterfall
monthlySold comps — $/sqft
last 12 mo · ≤1 miLoading sold comps…