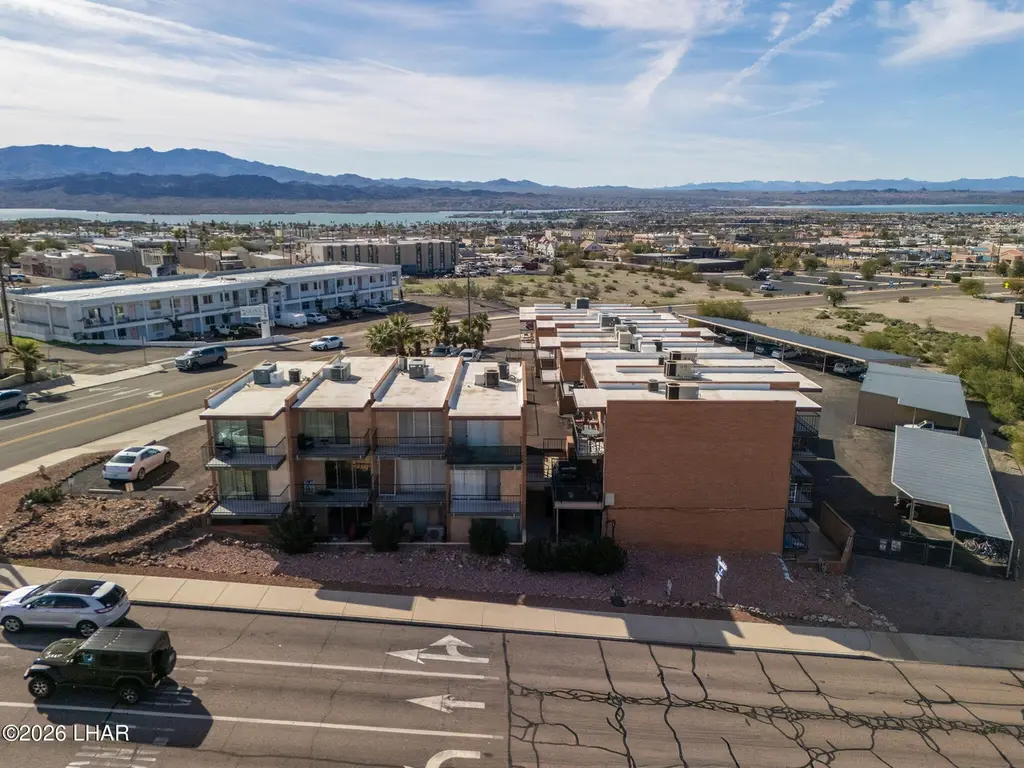
89 Acoma Blvd N #2 · Lake Havasu City, AZ
Flood risk 1/10 · Minimal
- FEMA flood zone
- X (unshaded)
- Chance of flooding over 30 yrs
- 0.0%
- Est. flood insurance / yr
- $507 – $1,088
Fire risk 3/10 · Minor
- Est. fire insurance / yr
- $610 – $1,132
Heat risk 9/10 · Severe
- Hot days now (above 115°F)
- 7 days/yr
- Hot days in 30 yrs
- 17 days/yr
Wind risk 1/10 · Minimal
- Chance of severe wind over 30 yrs
- —
Air-quality risk 1/10 · Minimal
- Unhealthy air days now
- 0 days/yr
- Unhealthy air days in 30 yrs
- 0 days/yr
Risk factors via First Street. Map © Google.
Why this score? — see what drove the D+ grade
The composite is a weighted blend of 9 inputs, each scored 0–100. Each bar is that input's sub-score; the figure is the points it added to the 100-point composite (weight × sub-score).
- ARV discount +15.0/15.0
- Cash flow +13.5/30.0
- 1% rule +4.9/10.0
- DSCR +4.1/10.0
- Rent growth +3.4/5.0
- Schools +3.4/10.0
- Livability +3.2/5.0
- Condition / age +2.5/5.0
- Appreciation +0.0/10.0
$122,900
🖨 Deal sheet (PDF) 📄 Offer letter ✓ Due diligence
Listing remarks
Your chance to own a condo in Lake Havasu! The Acoma Condominium is offering a rare opportunity to live on the ground level. This 1-bedroom, 1-bath condo provides 503 sq ft of efficient, open-concept living. Features include durable laminate flooring and carpet. Easy ground-level access with no stairs. You can decorate your private patio, which is just steps away from the community pool and on-site laundry facilities. An assigned covered carport is included. Located in the heart of Lake Havasu City, this condo is within walking distance to shopping, grocery stores, and medical services, and is just minutes from dining, entertainment, and the beautiful Lake Havasu. It is ideal as a full-time
Key facts
- $229 HOA
- Garage
- Pool
Property features AI
Finance
- HOA & community: Homeowners association with monthly fee; Association fee: $229.24 monthly; Association provides laundry
Exterior
- Parking: Has carport; Detached parking
- Utilities: Public water; Public sewer; Electricity available
- Home design: Residential condominium; Single-story
- Construction: Block construction; Shingle roof; Built by unknown builder
- Exterior features: Patio; Block fencing; Has a view; Level lot
Interior
- Kitchen: Electric water heater (appliance listed)
- Bedrooms: Total of 3 rooms (includes bedrooms and living areas)
- Flooring: Laminate flooring; Carpet; Vinyl flooring
- Bathrooms: 1 full bathroom
- Heating & cooling: Central heating (electric); Central air conditioning (electric); Ceiling fans
- Interior features: Breakfast bar; Ceiling fans; Open floor plan; Window coverings
- Laundry & utility: Laundry available through the homeowners association
Neighborhood map
What this means for you Summary
Snapshot
- This is a 1-bed/1.0-bath condo listed at $123k.
Deal economics
- At list price, monthly cash flow is $5 ($63/yr) — positive.
- The deal already cash-flows at list — no discount required.
- To meet the 1% rule (rent ≥ 1% of price), the offer needs to be $121k (1.4% below list).
- Recommended offer: $119k (3.0% below list) — sets the bar for market timing.
- Cap rate 6.3% vs local median 3.0% in Lake Havasu City — top-decile yield for the area; either an underpriced asset or a hidden risk that comps aren't pricing in. Stress-test before assuming the spread holds.
Location & tenants
- Location reads 63/100 on livability (#124 in AZ) — a middle-class / working-renter tenant base. Strengths: housing A; Watch: health & safety C-, amenities F, commute F.
- Lake Havasu Unified District (4368) (urban): math 39% / reading 41% proficiency, ranked #66 of 249 in AZ (top 26%) — families likely to look elsewhere, expect single-tenant / working-renter base with shorter leases.
- Zoned schools: Smoketree Elementary School (math 39% / reading 38%, grade F, #418 of 1,109 statewide, top 38%, 621 students, 49% FRL); Thunderbolt Middle School (math 27% / reading 34%, grade F, #81 of 218 statewide, top 37%, 851 students, 41% FRL); Lake Havasu High School (math 29% / reading 33%, grade F, #111 of 381 statewide, top 29%, 1,813 students, 31% FRL) — zoned schools at 40% FRL track the district average.
- Market conditions: Rents rising (+3.4%/yr); 393 active listings in the ZIP; 30 comparable units currently listed for rent nearby; rentals lingering (median 45d on market — plan ~5-8 weeks vacancy on turnover, expect pricing pressure); 60% of comp listings sitting > 30 days — soft ceiling on asking rent; 2,543 units permitted in Mohave County in 2024 (33 in 5+ unit buildings).
Forward outlook
- Local home prices are declining (-3.0%/yr); year-one equity from $850 of loan paydown is wiped out by about $4k of value loss. Plan a longer hold.
- Mohave County population projected to shrink 6% by 2050 — rents likely to lag national; underwrite the cash flow, not the appreciation.
Negotiation context
- It's been on market 47 days — a 3% lower offer ($119k) is reasonable based on typical stale-listing flexibility.
- 2 sale attempts since 6y ago; this cycle's ask has dropped $12k (9%) from the opening price — seller is motivated, your offer sets the floor, not the list.
Risks & watch-outs
- Climate carrying-cost: extreme-heat days projected 7→17/yr by 2055 (HVAC capex compounding) — expect insurance premiums to compound above CPI over the hold.
Questions for the listing agent
- It's been on market 47 days. Have you received any prior offers? Is the seller open to a 3% concession, seller financing, or rate buy-down credit?
- Built in 1967 — when were the roof, HVAC, electrical panel, plumbing, and water heater last replaced?
- What does the HOA fee cover, when was the last increase, and are there any pending special assessments or reserve-fund shortfalls?
- Any open or pending special assessments — roof, HVAC, plumbing, elevator, façade? What's the per-unit balance and payoff schedule, and is the seller paying it off at close or rolling it to the buyer?
- Is there a deadline driving the sale (1031 exchange, divorce, estate, relocation)? That informs how much negotiation room exists.
- Schools are B-rated — typically a magnet for longer-tenancy family renters. What's the average tenant stay here, and is there a school-zone premium baked into asking?
- The area grade is low — what's the realistic commute time and amenity access for the typical tenant pool here? Any planned neighborhood developments (good or bad) we should know about?
- What's the average days-on-market for RENTAL listings here right now (not sales)? A rising rental-DOM trend means longer vacancies and softer asking-rent achievability than the comps imply.
- What's the recent tenant-quality profile in this submarket — average credit score on applications, eviction rate, late-payment / NSF rate, and stable-employment percentage? A property-management company in the area should have these aggregated.
- How much new apartment / multifamily construction is in the pipeline within 1–3 miles? Heavy new supply (>2% of stock underway) typically softens rents 12–24 months out; light construction supports rent growth.
Investment metrics
- 1% rule
- 0.99% ✗
- Cap rate
- 6.34%
- Cash-on-cash
- 0.18%
- DSCR
- 1.01
- GRM
- 8.4
CMA / ARV
- ARV (median comp)
- $151,266
- List price
- $122,900
- Delta
- -18.75%
- Verdict
- UNDERPRICED
- Comps
- 20 within 1.0 mi
Projected returns pro-forma
-3.0% appreciation · 3.43% rent growth · sell at horizon
- IRR
- -15.4%
- Equity multiple
- 0.45×
- Total profit
- $-18,970
- Equity at exit
- $18,325
- IRR
- -6.0%
- Equity multiple
- 0.61×
- Total profit
- $-13,574
- Equity at exit
- $10,626
Cash invested: $34,412 (down + closing). Projections, not guarantees.
Landlord ↔ Tenant lean methodology
- Overall (STATE)
- 87 Strongly Landlord-Friendly
- State Arizona
- 87 Strongly Landlord-Friendly · R+3
- County
- — inherits STATE
- City
- — inherits STATE
ZIP-level market 86403
- Home prices YoY
- -33.5%
- Rents YoY
- 3.4%
- Active inventory
- 393
- Price-to-rent
- 8.4×
Monthly cashflow live
- Estimated rent
- $1,212 high interval (Pro) →
- Mortgage (P&I)
- −$645
- Tax from tax record
- −$28 /mo · $331/yr
- Insurance
- −$51
- HOA
- −$229
- Vacancy / Maint / Mgmt
- −$255
- Net cashflow
- $5
Break-even live
Sensitivity live
| Price | -10% $75 | -5% $40 | +0% $5 | +5% $-30 | +10% $-64 |
|---|---|---|---|---|---|
| Rent | -10% $-90 | -5% $-43 | +0% $5 | +5% $53 | +10% $101 |
| Rate | -1.0pp $67 | -0.5pp $37 | base $5 | +0.5pp $-27 | +1.0pp $-59 |
UW: 25.0% down · 7.5% · 30yr · 1.5% tax · 5.0% vac · 8.0% maint · 8.0% mgmt
Financing live
Cash to close
- Down payment
- $30,725
- Closing costs
- $3,687
- Reserves months
- —
- Total cash needed
- —
Loan-product check · same deal, 3 products live
Conventional
25% down · 7.5% · 30yr
- Down + closing
- —
- Monthly P&I
- —
- Monthly cashflow
- —
- DSCR
- —
- Eligible?
- —
Personal DTI + credit; lowest rate.
DSCR
20% down · 8.5% · 30yr
- Down + closing
- —
- Monthly P&I
- —
- Monthly cashflow
- —
- DSCR
- —
- Eligible?
- —
No personal income docs; deal must DSCR.
Hard money
10% down · 12.0% · 12mo
- Down + closing
- —
- Monthly P&I
- —
- Monthly cashflow
- —
- DSCR
- —
- Eligible?
- —
Short-term bridge; refi at stabilization.
Rent comps 30 comps
| Address | Beds | Baths | Sqft | Rent | $/sqft | DOM | Units | Dist |
|---|---|---|---|---|---|---|---|---|
| 2085 Mesquite Ave Lake Havasu City, AZ | 1.0–2.0 | 1.0–2.0 | 827 | $1,275 | $1.54 | 15d | 2 | 0.20mi |
| 2115 Swanson Ave #4 Lake Havasu City, AZ | 1.0 | 1.0 | 500 | $850 | $1.70 | 45d | 1 | 0.25mi |
| 2291 McCulloch Blvd N #12 Lake Havasu City, AZ | 1.0 | 1.0 | 697 | $1,200 | $1.72 | 45d | 1 | 0.27mi |
| 2301 McCulloch Blvd N Unit J Lake Havasu City, AZ | 1.0 | 1.0 | 623 | $1,100 | $1.77 | 45d | 1 | 0.29mi |
| 2076 Swanson Ave Lake Havasu City, AZ | 1.0 | 1.0 | 564 | $1,250 | $2.22 | 22d | 1 | 0.30mi |
| 2076 Swanson Ave Lake Havasu City, AZ | 1.0 | 1.0 | 551 | $1,250 | $2.27 | 45d | 1 | 0.30mi |
| 2076 Swanson Ave Unit 102 Lake Havasu City, AZ | 1.0 | 1.0 | 551 | $1,800 | $3.27 | 22d | 1 | 0.30mi |
| 2042 Swanson Ave Lake Havasu City, AZ | 1.0 | 2.0 | 722 | $1,990 | $2.76 | 45d | 1 | 0.34mi |
| 2060 Smoketree Ave N Apt 07 Lake Havasu City, AZ | 2.0 | 1.0 | 650 | $1,000 | $1.54 | 45d | 1 | 0.35mi |
| 1993 Mesquite Ave #3 Lake Havasu City, AZ | 2.0 | 1.0 | 727 | $1,250 | $1.72 | 15d | 1 | 0.39mi |
| 2010 Swanson Ave Unit 22 Lake Havasu City, AZ | 1.0 | 1.0 | 650 | $900 | $1.38 | 45d | 1 | 0.41mi |
| 2351 McCulloch Blvd N Unit 25 Lake Havasu City, AZ | 1.0 | 1.0 | 700 | $750 | $1.07 | 45d | 1 | 0.41mi |
| 1957 Mesquite Ave Lake Havasu City, AZ | 1.0–2.0 | 1.0–2.0 | 805 | $1,200 | $1.49 | 22d | 4 | 0.49mi |
| 2460 Tradewind Dr Lake Havasu City, AZ | 1.0 | 1.0 | 595 | $1,000 | $1.68 | 46d | 1 | 0.52mi |
| 1806 Swanson Ave Lake Havasu City, AZ | 1.0 | 1.5–2.0 | 692 | $1,375 | $1.99 | 15d | 1 | 0.70mi |
| 1767 Magnolia Dr Unit 103 Lake Havasu City, AZ | 1.0 | 1.0 | 635 | $1,175 | $1.85 | 22d | 1 | 0.72mi |
| 2444 Hummingbird Ln Apt D Lake Havasu City, AZ | 2.0 | 2.0 | 700 | $1,045 | $1.49 | 22d | 1 | 0.89mi |
| 2444 Hummingbird Ln Apt D Lake Havasu City, AZ | 2.0 | 2.0 | 700 | $1,100 | $1.57 | 45d | 1 | 0.89mi |
| 276 Lake Havasu Ave Unit C-14 Lake Havasu City, AZ | 1.0 | 1.0 | 670 | $1,100 | $1.64 | 22d | 1 | 0.91mi |
| 276 Lake Havasu Ave Unit C-24 Lake Havasu City, AZ | 1.0 | 1.0 | 670 | $1,195 | $1.78 | 45d | 1 | 0.91mi |
| 2690 McCulloch Blvd N Unit 1 Lake Havasu City, AZ | 2.0 | 1.0 | 672 | $975 | $1.45 | 45d | 1 | 0.93mi |
| 2690 McCulloch Blvd N Unit 6 Lake Havasu City, AZ | 2.0 | 1.0 | 672 | $1,075 | $1.60 | 22d | 1 | 0.93mi |
| 276 Lake Havasu Ave Unit B24 Lake Havasu City, AZ | 1.0 | 1.0 | 672 | $1,800 | $2.68 | 45d | 1 | 0.94mi |
| 256 Lake Havasu Ave S Unit C53 Lake Havasu City, AZ | 1.0 | 1.0 | 670 | $1,100 | $1.64 | 22d | 1 | 0.94mi |
| 256 Lake Havasu Ave S Lake Havasu City, AZ | 1.0–2.0 | 1.0–2.0 | 699 | $1,100 | $1.57 | 45d | 2 | 0.94mi |
| 2700 McCulloch Blvd N Unit 3 Lake Havasu City, AZ | 2.0 | 1.0 | 700 | $1,100 | $1.57 | 22d | 1 | 0.95mi |
| 1650 Smoketree Ave S #125 Lake Havasu City, AZ | 1.0 | 1.0 | 667 | $1,400 | $2.10 | 45d | 1 | 1.08mi |
| 1650 S Smoketree Ave Unit 275a Lake Havasu City, AZ | 1.0 | 1.0 | 672 | $1,700 | $2.53 | 45d | 1 | 1.13mi |
| 2735 Minnow Ln Unit B Lake Havasu City, AZ | 1.0 | 1.0 | 506 | $1,100 | $2.17 | 45d | 1 | 1.42mi |
| 1810 Bimini Ln Unit 3 Lake Havasu City, AZ | 1.0 | 1.0 | 700 | $1,100 | $1.57 | 45d | 1 | 1.46mi |
HOA detail condo
- Monthly dues
- $229 · $2,748/yr
- Likely covers
- pool
- Assessments
- None detected in remarks — confirm with the listing agent.
Listing history 18 events
-
2026-06-21days on market $122,900 Active 47 DOM
-
2026-06-18days on market $122,900 Active 44 DOM
-
2026-06-17days on market $122,900 Active 43 DOM
-
2026-06-16days on market $122,900 Active 42 DOM
-
2026-06-15days on market $122,900 Active 41 DOM
-
2026-06-14days on market $122,900 Active 39 DOM
-
2026-06-13pricedays on market $122,900 Active 38 DOM
-
2026-06-10days on market $134,900 Active 36 DOM
-
2026-06-09days on market $134,900 Active 35 DOM
-
2026-06-08days on market $134,900 Active 34 DOM
-
2026-06-07days on market $134,900 Active 33 DOM
-
2026-06-03days on market $134,900 Active 29 DOM
-
2026-06-02days on market $134,900 Active 28 DOM
-
2026-06-01days on market $134,900 Active 27 DOM
-
2026-05-31days on market $134,900 Active 26 DOM
-
2026-05-30days on market $134,900 Active 25 DOM
-
2026-05-05$134,900 Active 810-char remark
-
2020-01-23$62,500
ⓘ Source: listings_history table (triggers on properties + properties_extension) + one-shot
backfill from property_details.listing_events for pre-trigger history.
Tax reassessment forecast AZ · Resets to sale price
- Current annual tax
- $331 · $28/mo
- Projected year-2 tax
- $811 · $68/mo
- Expected delta
- +$480/yr (+$40/mo · 144.7%)
ⓘ Screening estimate from a state-policy table — verify with the county assessor before closing.
Climate risk First Street
- Flood 1/10 Low FEMA zone X (unshaded) · 0% chance over 30 yrs
- Wildfire 3/10 Moderate
- Heat 9/10 Extreme 7 d/yr ≥115°F today · 17 d/yr by 30 yrs out
- Wind 1/10 Low
- Air quality 1/10 Low 0 unhealthy d/yr today · 0 by 30 yrs out
Nearby sold comps map
Loading sold comps map…
Walkable amenities ~0.75 mi
Loading nearby amenities…
Taxation est. · year 1
- Rental income
- $14,546
- − Mortgage interest
- −$6,884
- − Property taxes
- −$331
- − Insurance
- −$614
- − Repairs & maintenance
- −$1,164
- − Management
- −$1,164
- − HOA
- −$2,748
- − Depreciation
- −$3,575
- Taxable loss
- −$1,935
- Est. tax savings @ 24.0%
- +$464
- After-tax cash flow
- $528/yr
For passive investors: Depreciation is non-cash, so a rental often shows a tax loss while cash-flowing — sheltering income. Rental losses are passive: they offset passive income freely, and up to $25,000/yr can offset ordinary (W-2) income if you actively participate and your MAGI is under $100k (phasing out to $0 by $150k); unused losses carry forward. On sale, claimed depreciation is recaptured at up to 25%, and gains may owe capital-gains tax (a 1031 exchange can defer both). Figures are a year-1 estimate at your 24.0% rate — not tax advice; consult a CPA.
Schools (NCES district)
- District
- Lake Havasu Unified District (4368)
- NCES district ID
- 0404280
- Math proficiency
- 39% ▼ -16.00%
- Reading proficiency
- 41% ▼ -8.00%
- Median HH income
- $43,993
- Composite
- 33.92/100
- National rank
- #5339
- State rank
- #66 of 249 in AZ
Livability — Lake Havasu City
- Score
- 63/100
- State rank
- #124
- US rank
- #15839
Category grades
Schools grade is shown separately in the Schools card above.
Census & demographics
- Census place
- Lake Havasu City, AZ
- County
- Mohave County · 181,906 people
- City population
- 62,596
- Metro
- Lake Havasu City-Kingman, AZ
- Population (ZIP)
- 18,295
- Household income
- $58,967
- Rent vs Own
- Severe rent burden
- 703.0
Population outlook (Mohave County) Hauer SSP2
- Today (2025)
- 209,184 people
- By 2030
- 209,674 · +0.2%
- By 2040
- 205,897 · -1.6%
- By 2050
- 196,810 · -5.9%
- By 2075
- 169,454 · -19.0%
- By 2100
- 136,630 · -34.7%
Race, ethnicity, and origin ACS 2023
- Neighborhood character
- Predominantly White (78%)
- Race & ethnicity
- White 78% Hispanic / Latino 19% Two or more races 12%
- Hispanic origin (detail)
- Mexican 15% Puerto Rican 2%
- Common ancestry
- Lithuanian 8% Portuguese 2% Slovak 2%
- Foreign-born
- 6% · Canada
- Languages at home
- 91% English-only · Spanish 8%
Political lean MEDSL · Mohave
- 2024 margin
- Solid R (+55.8) · D 21.8% · R 77.6%
- 2008→2024 swing
- -22.9pp toward R · 2008: -32.9pp · 2024: -55.8pp
- All cycles
- 2024: R+55.8 2020: R+51.3 2016: R+51.5 2012: R+42.6 2008: R+32.9
Not yet ingested
- Civics
- —
Market trends
- HPI YoY
- ▼ -194.25%
- Current HPI
- 384.7996
- Rent YoY
- ▲ 3.43%
- Metro
- Lake Havasu City-Kingman, AZ
- State GDP YoY
- ▲ 4.54%
- F500 in state
- 20
Industry mix (Fortune 500 HQ in AZ)
| Industry | F500 HQs | Revenue |
|---|---|---|
| Technology | 2 | $13B |
|
||
| Mining / Metals | 1 | $23B |
|
||
| Environmental Services | 1 | $16B |
|
||
| Metals / Steel | 1 | $14B |
|
||
| Technology Distribution | 1 | $9B |
|
||
| Homebuilding | 1 | $8B |
|
||
Price history
+96.6% since first listed3 events — show timeline
- 2026-06-11 Price Changed $122,900 LHAR
- 2026-05-05 Listed $134,900 LHAR
- 2020-01-23 Listed $62,500 LHAR
Property tax history
-2.1%/yrLatest (2025): $331 · +1.7% YoY. Source: county tax records.
Cash-flow waterfall
monthlySold comps — $/sqft
last 12 mo · ≤1 miLoading sold comps…