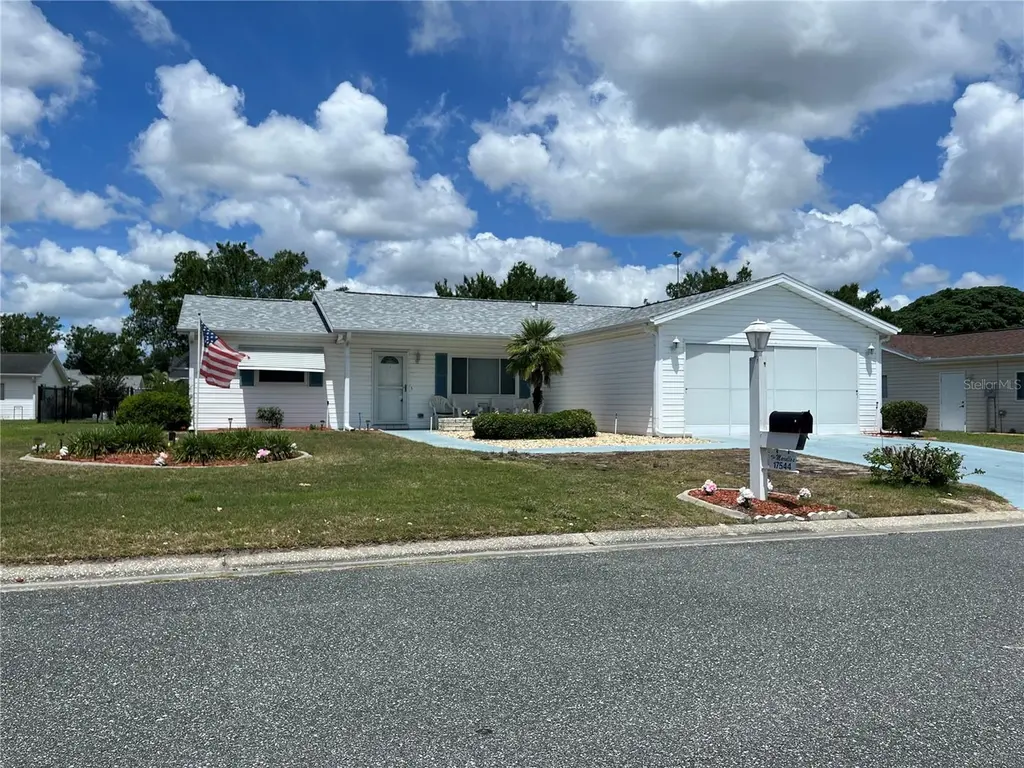
17544 SE 97th Ave · The Villages, FL
Flood risk 1/10 · Minimal
- FEMA flood zone
- X (unshaded)
- Chance of flooding over 30 yrs
- 0.0%
- Est. flood insurance / yr
- $507 – $1,088
Fire risk 1/10 · Minimal
- Est. fire insurance / yr
- $947 – $1,759
Heat risk 8/10 · Major
- Hot days now (above 109°F)
- 7 days/yr
- Hot days in 30 yrs
- 21 days/yr
Wind risk 9/10 · Severe
- Chance of severe wind over 30 yrs
- 99.0%
Air-quality risk 3/10 · Minor
- Unhealthy air days now
- 2 days/yr
- Unhealthy air days in 30 yrs
- 2 days/yr
Risk factors via First Street. Map © Google.
Why this score? — see what drove the C- grade
The composite is a weighted blend of 9 inputs, each scored 0–100. Each bar is that input's sub-score; the figure is the points it added to the 100-point composite (weight × sub-score).
- ARV discount +15.0/15.0
- Cash flow +13.8/30.0
- 1% rule +5.4/10.0
- DSCR +4.2/10.0
- Schools +3.6/10.0
- Livability +3.5/5.0
- Rent growth +2.5/5.0
- Condition / age +2.5/5.0
- Appreciation +0.0/10.0
$189,000
🖨 Deal sheet (PDF) 📄 Offer letter ✓ Due diligence
Listing remarks
Under contract-accepting backup offers. Original "Snowbird" owner says its time to Sell. You will love the awesome GOLF COURSE VIEWS from your comfortable FRONT PORCH! This property has been well maintained and lived in only part-time since built. Home features open concept living (Open Chestnut model), Granite kitchen countertops, tiled kitchen backsplash, doubled paned replacement windows, inside laundry room, ceiling fans, fenced back yard and 2 large bedrooms both with large walk-in closets. Outside is as cute as a button! Nicely landscaped with concrete curbing surrounding the entire home and flower bed. Garage is 20x22 with sliding privacy screens and service door. Home in
Key facts
- Front porch
- Ceiling fans
- Golf course views
Tags
Property features AI
Finance
- Other: Lease restrictions apply; Irrigation equipment installed
- HOA & community: Has HOA (monthly fee $180) with required association approval; HOA includes 24-hour guard, pool, management, private road, recreational facilities, security, and trash; Community amenities: clubhouse, fitness center, pool, tennis courts, pickleball courts, shuffleboard, trails, golf; Senior community; Pets allowed (cats and dogs)
Exterior
- Parking: Attached 2-car garage with 20x22 dimensions; Driveway; Garage door opener
- Security: Gated community; Smoke detectors
- Utilities: Public water; Septic tank; Cable connected; Electricity connected; Water connected
- Home design: Single family residence (PUD); One story; Faces East; Entry level: One
- Construction: Vinyl siding and frame construction; Shingle roof; Slab foundation; Built as Open Chestnut model
- Exterior features: Covered and enclosed front porch and patio; Private mailbox; Rain gutters; Sidewalks; Chain link fencing; Mature landscaping; Level lot near golf course; Paved road access
Interior
- Kitchen: Dishwasher; Range; Refrigerator; Exhaust fan
- Bedrooms: 2 bedrooms
- Flooring: Carpet; Ceramic tile
- Bathrooms: 2 full bathrooms
- Heating & cooling: Heat pump heating; Central air conditioning
- Interior features: Cathedral ceilings; Ceiling fans; Open floor plan; Split bedroom layout; Thermostat; Walk-in closets; Double pane windows
- Laundry & utility: Inside laundry room; Electric water heater
Neighborhood map
What this means for you Summary
Snapshot
- This is a 2-bed/2.0-bath single-family listed at $189k.
Deal economics
- At list price, monthly cash flow is $18 ($213/yr) — positive.
- The deal already cash-flows at list — no discount required.
- Meets the 1% rule at list price ($2k rent vs $189k).
- Cap rate 6.4% vs local median 5.0% in The Villages — meaningfully above typical; check what's discounted (condition, days-on-market, listing class) to confirm the premium yield is real.
Location & tenants
- Location reads 70/100 on livability (#431 in FL) — a middle-class / working-renter tenant base. Strengths: crime A+, housing A, employment B+; Watch: amenities F, commute F, health & safety F.
- Marion (rural): math 42% / reading 43% proficiency, ranked #61 of 73 in FL (top 84%) — families likely to look elsewhere, expect single-tenant / working-renter base with shorter leases; 61% free/reduced lunch — lower-income household profile, screen leases tightly.
- Zoned schools: Stanton-Weirsdale Elementary School (math 42% / reading 36%, grade F, #1,560 of 2,144 statewide, top 73%, 544 students, 70% FRL); Lake Weir Middle School (math 37% / reading 33%, grade F, #416 of 571 statewide, top 74%, 1,207 students, 76% FRL); Belleview High School (math 31% / reading 46%, grade F, #321 of 667 statewide, top 49%, 1,783 students, 56% FRL).
- Market conditions: 713 active listings in the ZIP; 14 comparable units currently listed for rent nearby; rentals at typical pace (median 23d on market — plan ~3-4 weeks tenant-placement turnaround); 7,071 units permitted in Marion County in 2024 (534 in 5+ unit buildings).
- This rent runs 35% of the median local income ($67k/yr) — at the standard rent-burdened threshold; future hikes will face affordability resistance.
Forward outlook
- Local home prices are declining (-3.0%/yr); year-one equity from $1k of loan paydown is wiped out by about $6k of value loss. Plan a longer hold.
- Marion County population projected at +13% by 2050 — modest demand growth; plan on rents tracking national, not racing it.
Negotiation context
- Only 6 days on market — expect competitive offers; lowballing is unlikely to land.
Risks & watch-outs
- Climate carrying-cost: severe wind risk, 99% chance of damaging wind over 30y; extreme-heat days projected 7→21/yr by 2055 (HVAC capex compounding) — expect insurance premiums to compound above CPI over the hold.
Questions for the listing agent
- What does the HOA fee cover, when was the last increase, and are there any pending special assessments or reserve-fund shortfalls?
- Is there a deadline driving the sale (1031 exchange, divorce, estate, relocation)? That informs how much negotiation room exists.
- Schools are A-rated — typically a magnet for longer-tenancy family renters. What's the average tenant stay here, and is there a school-zone premium baked into asking?
- What's the average days-on-market for RENTAL listings here right now (not sales)? A rising rental-DOM trend means longer vacancies and softer asking-rent achievability than the comps imply.
- What's the recent tenant-quality profile in this submarket — average credit score on applications, eviction rate, late-payment / NSF rate, and stable-employment percentage? A property-management company in the area should have these aggregated.
- How much new for-sale + rental construction is in the pipeline within 1–3 miles? Heavy new supply typically softens prices + rents 12–24 months out; constrained supply supports both.
Investment metrics
- 1% rule
- 1.04% ✓
- Cap rate
- 6.41%
- Cash-on-cash
- 0.40%
- DSCR
- 1.02
- GRM
- 8.0
CMA / ARV
- ARV (on-the-fly)
- $250,848
- Comps found
- 12
Show comp detail 12 sales within ~0.75 mi
| Address | Dist | Beds/Ba | Sqft | Sold | Price | $/sf | Match |
|---|---|---|---|---|---|---|---|
| 10340 SE 177th Pl | 0.68mi | 2/2.0 | 1,296 (+4%) | 2mo | $207,000 | $160 | 60 |
| 10235 SE 179th Pl | 0.65mi | 2/2.0 | 1,144 (-8%) | 2mo | $180,599 | $158 | 55 |
| 2785 Privada Dr | 0.71mi | 2/2.0 | 1,226 (-2%) | 12mo | $275,000 | $224 | 54 |
| 17707 SE 92nd Grantham Ter | 0.30mi | 3/2.0 (+1) | 1,392 (+12%) | 10mo | $282,000 | $203 | 54 |
| 9613 SE 171st Argyll St | 0.65mi | 2/2.0 | 1,148 (-8%) | 3mo | $260,000 | $226 | 53 |
| 17815 SE 102nd Ter | 0.66mi | 2/2.0 | 1,372 (+10%) | 3mo | $235,000 | $171 | 50 |
| 2788 Privada Dr | 0.72mi | 2/2.0 | 1,148 (-8%) | 5mo | $220,000 | $192 | 49 |
| 2603 Olivarez Way | 0.72mi | 2/2.0 | 1,121 (-10%) | 2mo | $252,000 | $225 | 48 |
| 1647 Campos Dr | 0.74mi | 2/2.0 | 1,121 (-10%) | 1mo | $250,000 | $223 | 48 |
| 1649 Campos Dr | 0.74mi | 2/2.0 | 1,121 (-10%) | 3mo | $223,000 | $199 | 46 |
| 1713 EL Nino St | 0.69mi | 2/2.0 | 1,121 (-10%) | 12mo | $225,000 | $201 | 40 |
| 10385 SE 178th St | 0.74mi | 2/2.0 | 1,420 (+14%) | 13mo | $247,900 | $175 | 31 |
Match score weights: distance 35% · size 25% · config 20% · recency 20%. Top-matched comps best support the ARV.
Projected returns pro-forma
-3.0% appreciation · 3.0% rent growth · sell at horizon
- IRR
- -15.5%
- Equity multiple
- 0.45×
- Total profit
- $-29,325
- Equity at exit
- $28,181
- IRR
- -6.9%
- Equity multiple
- 0.56×
- Total profit
- $-23,382
- Equity at exit
- $16,341
Cash invested: $52,920 (down + closing). Projections, not guarantees.
Landlord ↔ Tenant lean methodology
- Overall (STATE)
- 87 Strongly Landlord-Friendly
- State Florida
- 87 Strongly Landlord-Friendly · R+3
- County
- — inherits STATE
- City
- — inherits STATE
ZIP-level market 34491
- Home prices YoY
- -35.0%
- Active inventory
- 713
- Price-to-rent
- 8.0×
Monthly cashflow live
- Estimated rent
- $1,969 high interval (Pro) →
- Mortgage (P&I)
- −$991
- Tax from tax record
- −$288 /mo · $3,459/yr
- Insurance
- −$79
- HOA
- −$180
- Vacancy / Maint / Mgmt
- −$414
- Net cashflow
- $18
Break-even live
Sensitivity live
| Price | -10% $125 | -5% $71 | +0% $18 | +5% $-36 | +10% $-89 |
|---|---|---|---|---|---|
| Rent | -10% $-138 | -5% $-60 | +0% $18 | +5% $96 | +10% $173 |
| Rate | -1.0pp $113 | -0.5pp $66 | base $18 | +0.5pp $-31 | +1.0pp $-81 |
UW: 25.0% down · 7.5% · 30yr · 1.5% tax · 5.0% vac · 8.0% maint · 8.0% mgmt
Financing live
Cash to close
- Down payment
- $47,250
- Closing costs
- $5,670
- Reserves months
- —
- Total cash needed
- —
Loan-product check · same deal, 3 products live
Conventional
25% down · 7.5% · 30yr
- Down + closing
- —
- Monthly P&I
- —
- Monthly cashflow
- —
- DSCR
- —
- Eligible?
- —
Personal DTI + credit; lowest rate.
DSCR
20% down · 8.5% · 30yr
- Down + closing
- —
- Monthly P&I
- —
- Monthly cashflow
- —
- DSCR
- —
- Eligible?
- —
No personal income docs; deal must DSCR.
Hard money
10% down · 12.0% · 12mo
- Down + closing
- —
- Monthly P&I
- —
- Monthly cashflow
- —
- DSCR
- —
- Eligible?
- —
Short-term bridge; refi at stabilization.
Rent comps 14 comps
| Address | Beds | Baths | Sqft | Rent | $/sqft | DOM | Units | Dist |
|---|---|---|---|---|---|---|---|---|
| 17713 SE 95th Cir Summerfield, FL | 3.0 | 2.0 | 1450 | $2,000 | $1.38 | 23d | 1 | 0.25mi |
| 17532 SE 100th Ct Summerfield, FL | 2.0 | 2.0 | 1217 | $1,800 | $1.48 | 23d | 1 | 0.40mi |
| 17199 SE 97th Ter Summerfield, FL | 3.0 | 2.0 | 1404 | $1,990 | $1.42 | 23d | 1 | 0.42mi |
| 16962 SE 94th Sunnybrook Cir The Villages, FL | 2.0 | 2.0 | 1160 | $2,000 | $1.72 | 23d | 1 | 0.73mi |
| 10397 SE 176th St Summerfield, FL | 2.0 | 2.0 | 1296 | $2,150 | $1.66 | 23d | 1 | 0.74mi |
| 9523 SE 168th Maplesong Ln The Villages, FL | 3.0 | 2.0 | 1265 | $1,975 | $1.56 | 23d | 1 | 0.75mi |
| 2909 Meadow Lawn Ln The Villages, FL | 2.0 | 2.0 | 1132 | $4,300 | $3.80 | 23d | 1 | 0.81mi |
| 1808 Peachtree Ave The Villages, FL | 2.0 | 2.0 | 1182 | $2,500 | $2.12 | 23d | 1 | 0.85mi |
| 1648 Belle Grove Dr The Villages, FL | 2.0 | 2.0 | 1132 | $4,250 | $3.75 | 23d | 1 | 0.89mi |
| 9990 SE 166th St Summerfield, FL | 3.0 | 2.0 | 962 | $1,395 | $1.45 | 15d | 1 | 1.04mi |
| 8544 SE 177th Bartram Loop The Villages, FL | 2.0 | 2.0 | 1265 | $1,900 | $1.50 | 23d | 1 | 1.32mi |
| 9195 SE 163rd St Summerfield, FL | 3.0 | 2.0 | 1410 | $1,800 | $1.28 | 23d | 1 | 1.39mi |
| 17324 SE 82nd Pecan Ter The Villages, FL | 2.0 | 2.0 | 1358 | $2,500 | $1.84 | 23d | 1 | 1.41mi |
| 17400 SE 82nd Roslyn Ct The Villages, FL | 2.0 | 2.0 | 1138 | $4,700 | $4.13 | 23d | 1 | 1.44mi |
HOA detail
- Monthly dues
- $180 · $2,160/yr
Listing history 1 events
-
2026-05-22$189,000 Active
ⓘ Source: listings_history table (triggers on properties + properties_extension) + one-shot
backfill from property_details.listing_events for pre-trigger history.
Tax reassessment forecast FL · Resets to sale price
- Current annual tax
- $3,459 · $288/mo
- Projected year-2 tax
- $3,459 · $288/mo
- Expected delta
- $0/yr ($0/mo · 0.0%)
ⓘ Screening estimate from a state-policy table — verify with the county assessor before closing.
Climate risk First Street
- Flood 1/10 Low FEMA zone X (unshaded) · 0% chance over 30 yrs
- Wildfire 1/10 Low
- Heat 8/10 Severe 7 d/yr ≥109°F today · 21 d/yr by 30 yrs out
- Wind 9/10 Extreme 99% chance of damaging wind over 30 yrs
- Air quality 3/10 Moderate 2 unhealthy d/yr today · 2 by 30 yrs out
Nearby sold comps map
Loading sold comps map…
Walkable amenities ~0.75 mi
Loading nearby amenities…
Taxation est. · year 1
- Rental income
- $23,633
- − Mortgage interest
- −$10,587
- − Property taxes
- −$3,459
- − Insurance
- −$945
- − Repairs & maintenance
- −$1,891
- − Management
- −$1,891
- − HOA
- −$2,160
- − Depreciation
- −$5,498
- Taxable loss
- −$2,797
- Est. tax savings @ 24.0%
- +$671
- After-tax cash flow
- $884/yr
For passive investors: Depreciation is non-cash, so a rental often shows a tax loss while cash-flowing — sheltering income. Rental losses are passive: they offset passive income freely, and up to $25,000/yr can offset ordinary (W-2) income if you actively participate and your MAGI is under $100k (phasing out to $0 by $150k); unused losses carry forward. On sale, claimed depreciation is recaptured at up to 25%, and gains may owe capital-gains tax (a 1031 exchange can defer both). Figures are a year-1 estimate at your 24.0% rate — not tax advice; consult a CPA.
Schools (NCES district)
- District
- Marion
- NCES district ID
- 1201260
- Math proficiency
- 42% ▼ -7.00%
- Reading proficiency
- 43% ▼ -4.00%
- Median HH income
- $40,015
- Composite
- 35.61/100
- National rank
- #4890
- State rank
- #61 of 73 in FL
Livability — The Villages
- Score
- 70/100
- State rank
- #431
- US rank
- #7363
Category grades
Schools grade is shown separately in the Schools card above.
Census & demographics
- Census place
- The Villages, FL
- County
- Marion County · 315,796 people
- City population
- 83,973
- Metro
- Ocala, FL
- Population (ZIP)
- 33,318
- Household income
- $66,679
- Rent vs Own
- Severe rent burden
- 256.0
Population outlook (Marion County) Hauer SSP2
- Today (2025)
- 365,905 people
- By 2030
- 376,768 · +3.0%
- By 2040
- 396,555 · +8.4%
- By 2050
- 412,723 · +12.8%
- By 2075
- 446,090 · +21.9%
- By 2100
- 436,193 · +19.2%
Race, ethnicity, and origin ACS 2023
- Neighborhood character
- Predominantly White (77%)
- Race & ethnicity
- White 77% Hispanic / Latino 14% Two or more races 9% Black 4% Asian 2%
- Hispanic origin (detail)
- Mexican 3% Puerto Rican 6% Cuban 1%
- Common ancestry
- Lithuanian 3% Slovak 2% Romanian 2%
- Foreign-born
- 8% · Canada, Vietnam, Jamaica
- Languages at home
- 85% English-only · Spanish 11% Vietnamese 1% French/Haitian/Cajun 1%
Political lean MEDSL · Marion
- 2024 margin
- Solid R (+31.6) · D 33.8% · R 65.5%
- 2008→2024 swing
- -20.0pp toward R · 2008: -11.6pp · 2024: -31.6pp
- All cycles
- 2024: R+31.6 2020: R+25.9 2016: R+26.2 2012: R+16.2 2008: R+11.6
Not yet ingested
- Civics
- —
Market trends
- HPI YoY
- ▼ -107.67%
- Current HPI
- 200.0792
- Rent YoY
- —
- Metro
- Ocala, FL
- State GDP YoY
- ▲ 3.28%
- F500 in state
- 36
Industry mix (Fortune 500 HQ in FL)
| Industry | F500 HQs | Revenue |
|---|---|---|
| Industrial Technology | 2 | $29B |
|
||
| Insurance | 2 | $17B |
|
||
| Retail | 1 | $60B |
|
||
| Technology Distribution | 1 | $58B |
|
||
| Homebuilding | 1 | $35B |
|
||
| Technology Manufacturing | 1 | $35B |
|
||
Price history
2 events — show timeline
- 2026-05-28 Pending — Stellar MLS as Distributed by MLS Grid
- 2026-05-22 Listed $189,000 Stellar MLS as Distributed by MLS Grid
Property tax history
+8.3%/yrLatest (2025): $3,459 · +7.0% YoY. Source: county tax records.
Cash-flow waterfall
monthlySold comps — $/sqft
last 12 mo · ≤1 miLoading sold comps…