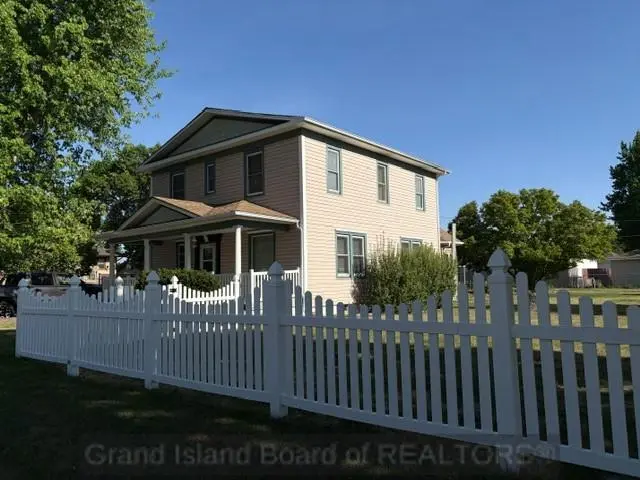
2117 W 13th St · Grand Island, NE
Flood risk 1/10 · Minimal
- FEMA flood zone
- X (unshaded)
- Chance of flooding over 30 yrs
- 0.0%
- Est. flood insurance / yr
- $473 – $860
Fire risk 1/10 · Minimal
- Est. fire insurance / yr
- $1,161 – $2,155
Heat risk 3/10 · Minor
- Hot days now (above 102°F)
- 7 days/yr
- Hot days in 30 yrs
- 16 days/yr
Wind risk 2/10 · Minimal
- Chance of severe wind over 30 yrs
- —
Air-quality risk 2/10 · Minimal
- Unhealthy air days now
- 1 days/yr
- Unhealthy air days in 30 yrs
- 1 days/yr
Risk factors via First Street. Map © Google.
Why this score? — see what drove the D grade
The composite is a weighted blend of 9 inputs, each scored 0–100. Each bar is that input's sub-score; the figure is the points it added to the 100-point composite (weight × sub-score).
- ARV discount +14.4/15.0
- Cash flow +9.9/30.0
- Livability +4.0/5.0
- Schools +3.1/10.0
- DSCR +2.8/10.0
- 1% rule +2.6/10.0
- Rent growth +2.5/5.0
- Condition / age +2.5/5.0
- Appreciation +0.0/10.0
$268,500
🖨 Deal sheet (PDF) 📄 Offer letter ✓ Due diligence
Listing remarks
This 2 story home features a basement, a detached 2 car garage and a 1 car detached garage. Entire property is fenced and full of beautiful flowers of many kinds. It sets on a corner lot. The front porch is enclosed, a great place to have plants and flowers. The main bath has been remodeled with new paint and wainscoting. The upper bathroom has been remodeled also with wainscoting and a jetted tub. French doors separate the living room and formal dining room and french doors separate the informal dining room and enclosed back porch. Also newer windows throughout the home.
Key facts
- Fenced property
- Remodeled main bath
- Jetted tub
Tags
Property features AI
Exterior
- Parking: Detached garage with garage door opener; 2 garage spaces
- Security: Smoke detectors
- Utilities: Natural gas available; Sewer connected
- Home design: Single-family residence; Residential property
- Construction: Frame construction with vinyl siding; Composition roof; Partial basement
- Exterior features: Chain-link fencing; Detached shed
Interior
- Kitchen: Electric range; Refrigerator
- Bedrooms: One main-level bedroom
- Bathrooms: One full bathroom; Two half bathrooms
- Heating & cooling: Forced-air heating; Central air conditioning
- Interior features: Window coverings; Humidifier; Gas water heater
- Laundry & utility: Laundry in the basement
Neighborhood map
What this means for you Summary
Snapshot
- This is a 6-bed/3.0-bath single-family listed at $268k.
Deal economics
- At list price, monthly cash flow is $-166 ($-2k/yr) — negative.
- To cash-flow at today's rent, offer at most $239k (10.9% below list).
- To meet the 1% rule (rent ≥ 1% of price), the offer needs to be $205k (23.6% below list).
- Recommended offer: $205k (23.6% below list) — sets the bar for 1% rule.
- Cap rate 5.6% vs local median 3.6% in Grand Island — top-decile yield for the area; either an underpriced asset or a hidden risk that comps aren't pricing in. Stress-test before assuming the spread holds.
Location & tenants
- Location reads 79/100 on livability (#43 in NE, #2,252 nationally) — a middle-class / working-renter tenant base. Strengths: cost of living A+, housing A+, health & safety A+; Watch: crime C-, commute F.
- Grand Island Public Schools (urban): math 36% / reading 36% proficiency, ranked #102 of 111 in NE (top 92%) — families likely to look elsewhere, expect single-tenant / working-renter base with shorter leases.
- Zoned schools: Jefferson Elementary School (math 22% / reading 22%, grade F, #459 of 502 statewide, top 93%, 360 students, 0% FRL); Walnut Middle School (math 30% / reading 27%, grade F, #116 of 128 statewide, top 91%, 853 students, 78% FRL); Grand Island Senior High School (math 22% / reading 20%, grade F, #249 of 261 statewide, top 95%, 2,650 students, 65% FRL).
- Zoned-school proficiency averages 24% at this address vs 36% district-wide (-12 pts) — the specific schools serving this property underperform the Grand Island Public Schools average; the district grade overstates school quality for this exact location.
- Market conditions: 212 active listings in the ZIP; 246 units permitted in Hall County in 2024 (98 in 5+ unit buildings).
- This rent runs 34% of the median local income ($73k/yr) — at the standard rent-burdened threshold; future hikes will face affordability resistance.
Forward outlook
- Local home prices are declining (-3.0%/yr); year-one equity from $2k of loan paydown is wiped out by about $8k of value loss. Plan a longer hold.
- Hall County population projected at +27% by 2050 — long-run rental-demand tailwind backs the buy-and-hold thesis.
Negotiation context
- It's been on market 23 days — a 2% lower offer ($264k) is reasonable based on typical stale-listing flexibility.
- 2 sale attempts with the ask held roughly flat each time — persistent listings suggest the price (not the market) is what's stuck; bring a comps-based counter.
Risks & watch-outs
- Watch-outs: built in 1916 — expect roof / HVAC / electrical / plumbing capex.
Questions for the listing agent
- What do current leases actually rent for vs. the listed asking? Can we see a recent rent roll and the last 12 months of T-12 income?
- Built in 1916 — when were the roof, HVAC, electrical panel, plumbing, and water heater last replaced?
- Is there a deadline driving the sale (1031 exchange, divorce, estate, relocation)? That informs how much negotiation room exists.
- Schools are D-rated, which usually means shorter tenancies and higher turnover. Who's the typical renter profile here, and what's been the actual vacancy rate?
- The area grade is low — what's the realistic commute time and amenity access for the typical tenant pool here? Any planned neighborhood developments (good or bad) we should know about?
- What's the average days-on-market for RENTAL listings here right now (not sales)? A rising rental-DOM trend means longer vacancies and softer asking-rent achievability than the comps imply.
- What's the recent tenant-quality profile in this submarket — average credit score on applications, eviction rate, late-payment / NSF rate, and stable-employment percentage? A property-management company in the area should have these aggregated.
- How much new for-sale + rental construction is in the pipeline within 1–3 miles? Heavy new supply typically softens prices + rents 12–24 months out; constrained supply supports both.
Investment metrics
- 1% rule
- 0.76% ✗
- Cap rate
- 5.55%
- Cash-on-cash
- -2.65%
- DSCR
- 0.88
- GRM
- 10.9
CMA / ARV
- ARV (median comp)
- $317,408
- List price
- $268,500
- Delta
- -68.49%
- Verdict
- UNDERPRICED
- Comps
- 7 within 1.0 mi
Projected returns pro-forma
-3.0% appreciation · 3.0% rent growth · sell at horizon
- IRR
- -20.7%
- Equity multiple
- 0.28×
- Total profit
- $-54,081
- Equity at exit
- $40,034
- IRR
- -14.0%
- Equity multiple
- 0.19×
- Total profit
- $-60,738
- Equity at exit
- $23,215
Cash invested: $75,180 (down + closing). Projections, not guarantees.
Landlord ↔ Tenant lean methodology
- Overall (STATE)
- 83 Strongly Landlord-Friendly
- State Nebraska
- 83 Strongly Landlord-Friendly · R+13
- County
- — inherits STATE
- City
- — inherits STATE
ZIP-level market 68803
- Active inventory
- 212
- Price-to-rent
- 10.9×
Monthly cashflow live
- Estimated rent
- $2,052 medium interval (Pro) →
- Mortgage (P&I)
- −$1,408
- Tax from tax record
- −$267 /mo · $3,201/yr
- Insurance
- −$112
- HOA
- −$0
- Vacancy / Maint / Mgmt
- −$431
- Net cashflow
- $-166
Break-even live
Sensitivity live
| Price | -10% $-14 | -5% $-90 | +0% $-166 | +5% $-242 | +10% $-318 |
|---|---|---|---|---|---|
| Rent | -10% $-328 | -5% $-247 | +0% $-166 | +5% $-85 | +10% $-4 |
| Rate | -1.0pp $-31 | -0.5pp $-98 | base $-166 | +0.5pp $-235 | +1.0pp $-306 |
UW: 25.0% down · 7.5% · 30yr · 1.5% tax · 5.0% vac · 8.0% maint · 8.0% mgmt
Financing live
Cash to close
- Down payment
- $67,125
- Closing costs
- $8,055
- Reserves months
- —
- Total cash needed
- —
Loan-product check · same deal, 3 products live
Conventional
25% down · 7.5% · 30yr
- Down + closing
- —
- Monthly P&I
- —
- Monthly cashflow
- —
- DSCR
- —
- Eligible?
- —
Personal DTI + credit; lowest rate.
DSCR
20% down · 8.5% · 30yr
- Down + closing
- —
- Monthly P&I
- —
- Monthly cashflow
- —
- DSCR
- —
- Eligible?
- —
No personal income docs; deal must DSCR.
Hard money
10% down · 12.0% · 12mo
- Down + closing
- —
- Monthly P&I
- —
- Monthly cashflow
- —
- DSCR
- —
- Eligible?
- —
Short-term bridge; refi at stabilization.
Listing history 16 events
-
2026-06-19days on market $268,500 Active 23 DOM
-
2026-06-18days on market $268,500 Active 22 DOM
-
2026-06-17days on market $268,500 Active 21 DOM
-
2026-06-16days on market $268,500 Active 20 DOM
-
2026-06-15days on market $268,500 Active 19 DOM
-
2026-06-14days on market $268,500 Active 17 DOM
-
2026-06-12days on market $268,500 Active 16 DOM
-
2026-06-09days on market $268,500 Active 13 DOM
-
2026-06-08days on market $268,500 Active 12 DOM
-
2026-06-07days on market $268,500 Active 11 DOM
-
2026-06-03days on market $268,500 Active 7 DOM
-
2026-06-02days on market $268,500 Active 6 DOM
-
2026-06-01days on market $268,500 Active 5 DOM
-
2026-05-31days on market $268,500 Active 4 DOM
-
2026-05-30days on market $268,500 Active 3 DOM
-
2026-02-03$100,000 Active
ⓘ Source: listings_history table (triggers on properties + properties_extension) + one-shot
backfill from property_details.listing_events for pre-trigger history.
Tax reassessment forecast NE · Resets to sale price
- Current annual tax
- $3,201 · $267/mo
- Projected year-2 tax
- $4,645 · $387/mo
- Expected delta
- +$1,444/yr (+$120/mo · 45.1%)
ⓘ Screening estimate from a state-policy table — verify with the county assessor before closing.
Climate risk First Street
- Flood 1/10 Low FEMA zone X (unshaded) · 0% chance over 30 yrs
- Wildfire 1/10 Low
- Heat 3/10 Moderate 7 d/yr ≥102°F today · 16 d/yr by 30 yrs out
- Wind 2/10 Low
- Air quality 2/10 Low 1 unhealthy d/yr today · 1 by 30 yrs out
Nearby sold comps map
Loading sold comps map…
Walkable amenities ~0.75 mi
Loading nearby amenities…
Taxation est. · year 1
- Rental income
- $24,620
- − Mortgage interest
- −$15,040
- − Property taxes
- −$3,201
- − Insurance
- −$1,342
- − Repairs & maintenance
- −$1,970
- − Management
- −$1,970
- − Depreciation
- −$7,811
- Taxable loss
- −$6,713
- Est. tax savings @ 24.0%
- +$1,611
- After-tax cash flow
- $-379/yr
For passive investors: Depreciation is non-cash, so a rental often shows a tax loss while cash-flowing — sheltering income. Rental losses are passive: they offset passive income freely, and up to $25,000/yr can offset ordinary (W-2) income if you actively participate and your MAGI is under $100k (phasing out to $0 by $150k); unused losses carry forward. On sale, claimed depreciation is recaptured at up to 25%, and gains may owe capital-gains tax (a 1031 exchange can defer both). Figures are a year-1 estimate at your 24.0% rate — not tax advice; consult a CPA.
Schools (NCES district)
- District
- Grand Island Public Schools
- NCES district ID
- 3100016
- Math proficiency
- 36% ▼ -5.00%
- Reading proficiency
- 36% ▼ -5.00%
- Median HH income
- $47,021
- Composite
- 30.9/100
- National rank
- #6117
- State rank
- #102 of 111 in NE
Livability — Grand Island
- Score
- 79/100
- State rank
- #43
- US rank
- #2252
Category grades
Schools grade is shown separately in the Schools card above.
Census & demographics
- Census place
- Grand Island, NE
- County
- Hall County · 56,358 people
- City population
- 56,358
- Metro
- Grand Island, NE
- Population (ZIP)
- 25,534
- Household income
- $73,463
- Rent vs Own
- Severe rent burden
- 638.0
Population outlook (Hall County) Hauer SSP2
- Today (2025)
- 68,137 people
- By 2030
- 71,543 · +5.0%
- By 2040
- 78,843 · +15.7%
- By 2050
- 86,765 · +27.3%
- By 2075
- 111,764 · +64.0%
- By 2100
- 137,991 · +102.5%
Race, ethnicity, and origin ACS 2023
- Neighborhood character
- Predominantly White (72%)
- Race & ethnicity
- White 72% Hispanic / Latino 23% Two or more races 6% Black 2% Asian 1%
- Hispanic origin (detail)
- Mexican 14% Cuban 2%
- Common ancestry
- Romanian 5% Lithuanian 2% Slovak 1%
- Foreign-born
- 12% · Canada, China
- Languages at home
- 80% English-only · Spanish 18% Arabic 1%
Political lean MEDSL · Hall
- 2024 margin
- Solid R (+37.8) · D 30.5% · R 68.3% · Other 1.2%
- 2008→2024 swing
- -13.7pp toward R · 2008: -24.1pp · 2024: -37.8pp
- All cycles
- 2024: R+37.8 2020: R+34.8 2016: R+37.5 2012: R+27.6 2008: R+24.1
Not yet ingested
- Civics
- —
Market trends
- HPI YoY
- ▼ -191.41%
- Current HPI
- 214.8923
- Rent YoY
- —
- Metro
- Grand Island, NE
- State GDP YoY
- ▲ 0.68%
- F500 in state
- 2
Industry mix (Fortune 500 HQ in NE)
| Industry | F500 HQs | Revenue |
|---|---|---|
| Conglomerate | 1 | $371B |
|
||
Price history
+168.5% since first listed2 events — show timeline
- 2026-05-27 Listed $268,500 GIBOR
- 2026-02-03 Listed $100,000 GMNMLS
Property tax history
+0.9%/yrLatest (2025): $3,201 · +5.6% YoY. Source: county tax records.
Cash-flow waterfall
monthlySold comps — $/sqft
last 12 mo · ≤1 miLoading sold comps…