 Multi-family
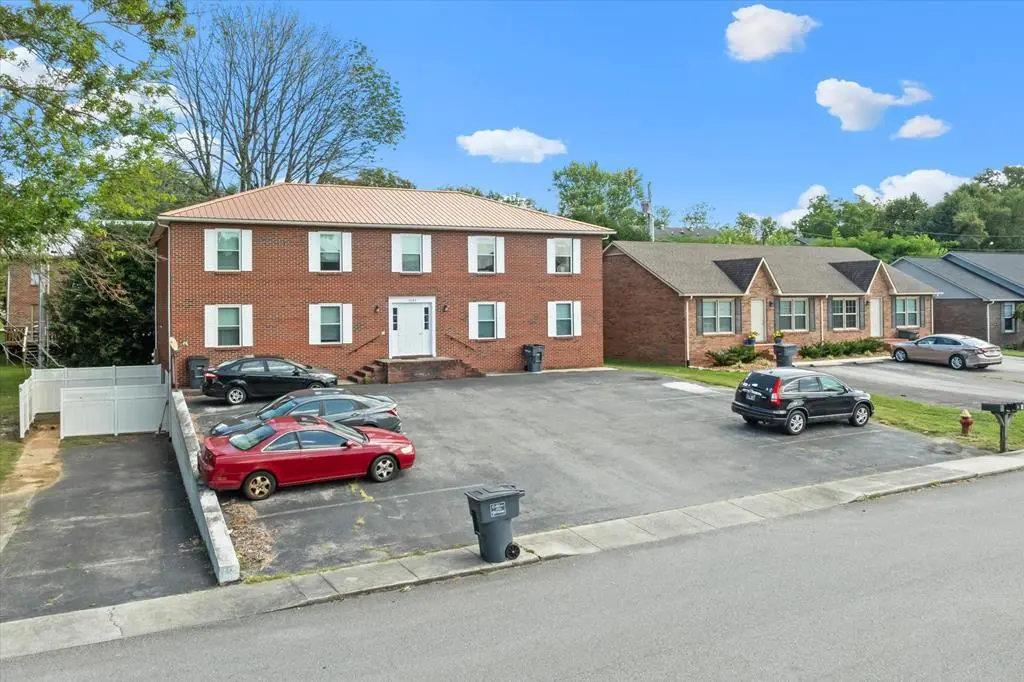
155&1849 E Jere Whitson & Summerhaven · Cookeville, TN
Flood risk 1/10 · Minimal
- FEMA flood zone
- X (unshaded)
- Chance of flooding over 30 yrs
- 0.0%
- Est. flood insurance / yr
- $507 – $1,088
Fire risk 3/10 · Minor
- Est. fire insurance / yr
- $949 – $1,763
Heat risk 5/10 · Moderate
- Hot days now (above 103°F)
- 7 days/yr
- Hot days in 30 yrs
- 20 days/yr
Wind risk 3/10 · Minor
- Chance of severe wind over 30 yrs
- 6.0%
Air-quality risk 2/10 · Minimal
- Unhealthy air days now
- 0 days/yr
- Unhealthy air days in 30 yrs
- 1 days/yr
Risk factors via First Street. Map © Google.
Why this score? — see what drove the D grade
The composite is a weighted blend of 9 inputs, each scored 0–100. Each bar is that input's sub-score; the figure is the points it added to the 100-point composite (weight × sub-score).
- Cash flow +16.5/30.0
- ARV discount +7.5/15.0
- DSCR +5.1/10.0
- Livability +3.8/5.0
- 1% rule +3.2/10.0
- Schools +2.6/10.0
- Condition / age +2.5/5.0
- Rent growth +2.1/5.0
- Appreciation +0.0/10.0
$927,999
🖨 Deal sheet (PDF) 📄 Offer letter ✓ Due diligence
Multi-family units
County records classify this as Multi-Family (2-4 Unit). Listing-text estimate: 1 unit. estimate disagrees with records
Listing remarks MLS
PERFECT INVESTMENT LOCATED IN CITY LIMITS OF COOKEVILLE! SITUATED WITHIN WALKING DISTANCE TO TENNESSEE TECH WITH EASY ACCESS TO COOKEVILLE HIGH SCHOOL, JERE WHITSON ELEMENTARY, WHILE ALSO BEING CLOSE TO SHOPPING AND RESTARUANTS. TRULY A REMARKABLE LOCATION. * PLEASE READ AGENT REMARKS *
Key facts
- Washer dryer hookups
- Storage units
- Separately metered
Tags
Property features AI
Exterior
- Parking: Paved parking
- Utilities: Public water; Public sewer; Electric with circuit breakers
- Home design: Residential income property; Multi-family; Other multi-family subtype; Zoned RM8
- Construction: Frame, brick, and vinyl siding construction; Has basement (crawl space)
- Exterior features: Front porch; Metal roof; Paved road access
Interior
- Kitchen: Electric oven; Electric range; Refrigerator; Electric water heater
- Flooring: Vinyl flooring; Tile flooring
- Heating & cooling: Electric heating; Central air conditioning
- Interior features: Double pane windows; Crawl space basement
Neighborhood map
What this means for you Summary
Snapshot
- This is a ?-bed/2.0-bath multifamily listed at $928k.
Deal economics
- At list price, monthly cash flow is $550 ($7k/yr) — positive.
- The deal already cash-flows at list — no discount required.
- To meet the 1% rule (rent ≥ 1% of price), the offer needs to be $758k (18.3% below list).
- Recommended offer: $758k (18.3% below list) — sets the bar for 1% rule.
- Cap rate 7.0% vs local median 3.1% in Cookeville — top-decile yield for the area; either an underpriced asset or a hidden risk that comps aren't pricing in. Stress-test before assuming the spread holds.
Location & tenants
- Location reads 76/100 on livability (#11 in TN, #3,551 nationally) — a middle-class / working-renter tenant base. Strengths: amenities A+, cost of living A+, health & safety A+; Watch: schools D-, commute F, employment F.
- Putnam County (town): math 32% / reading 31% proficiency, ranked #49 of 139 in TN (top 35%) — families likely to look elsewhere, expect single-tenant / working-renter base with shorter leases.
- Market conditions: Rents soft (-1.4%/yr); 285 active listings in the ZIP; 4 comparable units currently listed for rent nearby; rentals lingering (median 46d on market — plan ~5-8 weeks vacancy on turnover, expect pricing pressure); 100% of comp listings sitting > 30 days — soft ceiling on asking rent; 700 units permitted in Putnam County in 2024 (48 in 5+ unit buildings).
- At $7,584/mo this rent would consume 175% of the median local household income ($52k/yr) (locally 2410% of renters already pay >50% of income on rent) — very limited rent-growth headroom before tenants either downsize or default.
Forward outlook
- Local home prices are declining (-3.0%/yr); year-one equity from $6k of loan paydown is wiped out by about $28k of value loss. Plan a longer hold.
- Putnam County population projected at +16% by 2050 — long-run rental-demand tailwind backs the buy-and-hold thesis.
Negotiation context
- It's been on market 32 days — a 3% lower offer ($900k) is reasonable based on typical stale-listing flexibility.
- 2 sale attempts with the ask held roughly flat each time — persistent listings suggest the price (not the market) is what's stuck; bring a comps-based counter.
- Current owner paid $142k; list at $928k implies a 551% gain — meaningful room to come down on a strong offer.
Risks & watch-outs
- Climate carrying-cost: extreme-heat days projected 7→20/yr by 2055 (HVAC capex compounding) — expect insurance premiums to compound above CPI over the hold.
Questions for the listing agent
- It's been on market 32 days. Have you received any prior offers? Is the seller open to a 18% concession, seller financing, or rate buy-down credit?
- Is there a deadline driving the sale (1031 exchange, divorce, estate, relocation)? That informs how much negotiation room exists.
- Schools are D-rated, which usually means shorter tenancies and higher turnover. Who's the typical renter profile here, and what's been the actual vacancy rate?
- The area grade is low — what's the realistic commute time and amenity access for the typical tenant pool here? Any planned neighborhood developments (good or bad) we should know about?
- What's the average days-on-market for RENTAL listings here right now (not sales)? A rising rental-DOM trend means longer vacancies and softer asking-rent achievability than the comps imply.
- What's the recent tenant-quality profile in this submarket — average credit score on applications, eviction rate, late-payment / NSF rate, and stable-employment percentage? A property-management company in the area should have these aggregated.
- How much new apartment / multifamily construction is in the pipeline within 1–3 miles? Heavy new supply (>2% of stock underway) typically softens rents 12–24 months out; light construction supports rent growth.
Investment metrics
- 1% rule
- 0.82% ✗
- Cap rate
- 7.00%
- Cash-on-cash
- 2.54%
- DSCR
- 1.11
- GRM
- 10.2
CMA / ARV
- ARV (on-the-fly)
- $335,544
- Comps found
- 2
Show comp detail 2 sales within ~0.75 mi
| Address | Dist | Beds/Ba | Sqft | Sold | Price | $/sf | Match |
|---|---|---|---|---|---|---|---|
| 141 E 15th St | 0.29mi | 4/4.0 | 2,200 (+8%) | 4mo | $360,000 | $164 | 62 |
| 1347 Maddux Ave | 0.30mi | 4/4.0 | 2,320 (+13%) | 4mo | $354,000 | $153 | 52 |
Match score weights: distance 35% · size 25% · config 20% · recency 20%. Top-matched comps best support the ARV.
Projected returns pro-forma
-3.0% appreciation · 0.0% rent growth · sell at horizon
- IRR
- -15.3%
- Equity multiple
- 0.47×
- Total profit
- $-138,070
- Equity at exit
- $138,368
- IRR
- -12.0%
- Equity multiple
- 0.37×
- Total profit
- $-162,998
- Equity at exit
- $80,236
Cash invested: $259,840 (down + closing). Projections, not guarantees.
Landlord ↔ Tenant lean methodology
- Overall (STATE)
- 87 Strongly Landlord-Friendly
- State Tennessee
- 87 Strongly Landlord-Friendly · R+13
- County
- — inherits STATE
- City
- — inherits STATE
ZIP-level market 38501
- Home prices YoY
- -24.2%
- Rents YoY
- -1.4%
- Active inventory
- 285
- Price-to-rent
- 70.2×
Monthly cashflow live
- Estimated rent
- $7,584 medium interval (Pro) →
- Mortgage (P&I)
- −$4,867
- Tax from tax record
- −$188 /mo · $2,261/yr
- Insurance
- −$387
- HOA
- −$0
- Vacancy / Maint / Mgmt
- −$1,593
- Net cashflow
- $550
Break-even live
Sensitivity live
| Price | -10% $1,075 | -5% $812 | +0% $550 | +5% $287 | +10% $24 |
|---|---|---|---|---|---|
| Rent | -10% $-49 | -5% $250 | +0% $550 | +5% $849 | +10% $1,149 |
| Rate | -1.0pp $1,017 | -0.5pp $786 | base $550 | +0.5pp $309 | +1.0pp $65 |
7-unit breakdown (identical units grouped — click to expand)
| Units | Beds | Baths | Est. rent |
|---|---|---|---|
| 6× units | 2 | 1 | $6,612 |
| #1 | 2 | 1 | $1,102 |
| #2 | 2 | 1 | $1,102 |
| #3 | 2 | 1 | $1,102 |
| #4 | 2 | 1 | $1,102 |
| #5 | 2 | 1 | $1,102 |
| #6 | 2 | 1 | $1,102 |
| 1× unit | 1 | 1 | $974 |
| Total (7 units) | $7,584 | ||
UW: 25.0% down · 7.5% · 30yr · 1.5% tax · 5.0% vac · 8.0% maint · 8.0% mgmt
Financing live
Cash to close
- Down payment
- $232,000
- Closing costs
- $27,840
- Reserves months
- —
- Total cash needed
- —
Loan-product check · same deal, 3 products live
Conventional
25% down · 7.5% · 30yr
- Down + closing
- —
- Monthly P&I
- —
- Monthly cashflow
- —
- DSCR
- —
- Eligible?
- —
Personal DTI + credit; lowest rate.
DSCR
20% down · 8.5% · 30yr
- Down + closing
- —
- Monthly P&I
- —
- Monthly cashflow
- —
- DSCR
- —
- Eligible?
- —
No personal income docs; deal must DSCR.
Hard money
10% down · 12.0% · 12mo
- Down + closing
- —
- Monthly P&I
- —
- Monthly cashflow
- —
- DSCR
- —
- Eligible?
- —
Short-term bridge; refi at stabilization.
Rent comps 4 comps
| Address | Beds | Baths | Sqft | Rent | $/sqft | DOM | Units | Dist |
|---|---|---|---|---|---|---|---|---|
| 306 E 13th St Cookeville, TN | 3.0 | 2.0 | 1537 | $1,950 | $1.27 | 45d | 1 | 0.51mi |
| 431 Juniper Dr Cookeville, TN | 3.0 | 2.5 | 1424 | $1,650 | $1.16 | 45d | 1 | 0.84mi |
| 407 Juniper Dr Cookeville, TN | 3.0 | 2.0 | 1424 | $1,650 | $1.16 | 45d | 1 | 0.89mi |
| 1301 Fisk Rd Cookeville, TN | 3.0 | 2.5 | 1818 | $1,900 | $1.05 | 45d | 1 | 1.41mi |
Listing history 20 events
-
2026-06-22days on market $927,999 Active 32 DOM
-
2026-06-19days on market $927,999 Active 30 DOM
-
2026-06-18days on market $927,999 Active 29 DOM
-
2026-06-17days on market $927,999 Active 28 DOM
-
2026-06-16days on market $927,999 Active 27 DOM
-
2026-06-15days on market $927,999 Active 26 DOM
-
2026-06-14days on market $927,999 Active 24 DOM
-
2026-06-13days on market $927,999 Active 23 DOM
-
2026-06-10days on market $927,999 Active 21 DOM
-
2026-06-09days on market $927,999 Active 20 DOM
-
2026-06-08days on market $927,999 Active 19 DOM
-
2026-06-07days on market $927,999 Active 18 DOM
-
2026-06-05days on market $927,999 Active 15 DOM
-
2026-06-02days on market $927,999 Active 13 DOM
-
2026-06-01days on market $927,999 Active 12 DOM
-
2026-05-31days on market $927,999 Active 11 DOM
-
2026-05-30days on market $927,999 Active 10 DOM
-
2026-05-20$927,999 Active
-
2026-05-19$329,000 Active 287-char remark
Show marketing remark (287 chars)
PERFECT INVESTMENT LOCATED IN CITY LIMITS OF COOKEVILLE! SITUATED WITHIN WALKING DISTANCE TO TENNESSEE TECH WITH EASY ACCESS TO COOKEVILLE HIGH SCHOOL, JERE WHITSON ELEMENTARY, WHILE ALSO BEING CLOSE TO SHOPPING AND RESTARUANTS. TRULY A REMARKABLE LOCATION. * PLEASE READ AGENT REMARKS *
-
2019-02-01soldstatus $142,500
ⓘ Source: listings_history table (triggers on properties + properties_extension) + one-shot
backfill from property_details.listing_events for pre-trigger history.
Tax reassessment forecast TN · Resets to sale price
- Current annual tax
- $2,261 · $188/mo
- Projected year-2 tax
- $6,589 · $549/mo
- Expected delta
- +$4,328/yr (+$361/mo · 191.4%)
ⓘ Screening estimate from a state-policy table — verify with the county assessor before closing.
Climate risk First Street
- Flood 1/10 Low FEMA zone X (unshaded) · 0% chance over 30 yrs
- Wildfire 3/10 Moderate
- Heat 5/10 Major 7 d/yr ≥103°F today · 20 d/yr by 30 yrs out
- Wind 3/10 Moderate 6% chance of damaging wind over 30 yrs
- Air quality 2/10 Low 0 unhealthy d/yr today · 1 by 30 yrs out
Nearby sold comps map
Loading sold comps map…
Walkable amenities ~0.75 mi
Loading nearby amenities…
Taxation est. · year 1
- Rental income
- $91,008
- − Mortgage interest
- −$51,982
- − Property taxes
- −$2,261
- − Insurance
- −$4,640
- − Repairs & maintenance
- −$7,281
- − Management
- −$7,281
- − Depreciation
- −$26,996
- Taxable loss
- −$9,433
- Est. tax savings @ 24.0%
- +$2,264
- After-tax cash flow
- $8,861/yr
For passive investors: Depreciation is non-cash, so a rental often shows a tax loss while cash-flowing — sheltering income. Rental losses are passive: they offset passive income freely, and up to $25,000/yr can offset ordinary (W-2) income if you actively participate and your MAGI is under $100k (phasing out to $0 by $150k); unused losses carry forward. On sale, claimed depreciation is recaptured at up to 25%, and gains may owe capital-gains tax (a 1031 exchange can defer both). Figures are a year-1 estimate at your 24.0% rate — not tax advice; consult a CPA.
Schools (NCES district)
- District
- Putnam County
- NCES district ID
- 4703480
- Math proficiency
- 32% ▼ -6.00%
- Reading proficiency
- 31% ▼ -5.00%
- Median HH income
- $35,738
- Composite
- 26.09/100
- National rank
- #7291
- State rank
- #49 of 139 in TN
Livability — Cookeville
- Score
- 76/100
- State rank
- #11
- US rank
- #3551
Category grades
Schools grade is shown separately in the Schools card above.
Census & demographics
- Census place
- Cookeville, TN
- County
- Putnam County · 72,571 people
- City population
- 72,571
- Metro
- Cookeville, TN
- Population (ZIP)
- 42,471
- Household income
- $52,145
- Rent vs Own
- Severe rent burden
- 2410.0
Population outlook (Putnam County) Hauer SSP2
- Today (2025)
- 80,122 people
- By 2030
- 82,798 · +3.3%
- By 2040
- 87,913 · +9.7%
- By 2050
- 92,659 · +15.6%
- By 2075
- 104,965 · +31.0%
- By 2100
- 113,256 · +41.4%
Race, ethnicity, and origin ACS 2023
- Neighborhood character
- Predominantly White (82%)
- Race & ethnicity
- White 82% Hispanic / Latino 9% Two or more races 6% Black 4% Asian 1%
- Hispanic origin (detail)
- Mexican 4%
- Common ancestry
- Serbian 2% Slovak 2% Lithuanian 2%
- Foreign-born
- 6% · Canada
- Languages at home
- 92% English-only · Spanish 5% Other Indo-European 1% French/Haitian/Cajun 1%
Political lean MEDSL · Putnam
- 2024 margin
- Solid R (+47.4) · D 25.7% · R 73.1% · Other 1.1%
- 2008→2024 swing
- -20.5pp toward R · 2008: -26.9pp · 2024: -47.4pp
- All cycles
- 2024: R+47.4 2020: R+43.4 2016: R+45.0 2012: R+37.1 2008: R+26.9
Not yet ingested
- Civics
- —
Market trends
- HPI YoY
- ▼ -91.19%
- Current HPI
- 285.6959
- Rent YoY
- ▼ -1.45%
- Metro
- Cookeville, TN
- State GDP YoY
- ▲ 2.78%
- F500 in state
- 22
Industry mix (Fortune 500 HQ in TN)
| Industry | F500 HQs | Revenue |
|---|---|---|
| Healthcare | 3 | $91B |
|
||
| Retail | 3 | $72B |
|
||
| Transportation / Logistics | 1 | $88B |
|
||
| Paper / Packaging | 1 | $19B |
|
||
| Insurance | 1 | $13B |
|
||
| Energy | 1 | $12B |
|
||
Price history
+551.2% since first listed3 events — show timeline
- 2026-05-20 Listed $927,999 UCMLS
- 2026-05-19 Listed $329,000 UCMLS
- 2019-02-01 Sold (Public Records) $142,500 Public Records
Property tax history
+6.0%/yrLatest (2025): $2,261 · +1.9% YoY. Source: county tax records.
Cash-flow waterfall
monthlySold comps — $/sqft
last 12 mo · ≤1 miLoading sold comps…