754A S Roosevelt Rd Q Unit 745b S Roosevelt Rd Q · Portales, NM
Flood risk No data
- FEMA flood zone
- —
- Chance of flooding over 30 yrs
- —
- Est. flood insurance / yr
- —
Fire risk No data
- Est. fire insurance / yr
- —
Heat risk No data
- Hot days now (above threshold)
- —
- Hot days in 30 yrs
- —
Wind risk No data
- Chance of severe wind over 30 yrs
- —
Air-quality risk No data
- Unhealthy air days now
- —
- Unhealthy air days in 30 yrs
- —
Risk factors via First Street. Map © Google.
Why this score? — see what drove the F grade
The composite is a weighted blend of 9 inputs, each scored 0–100. Each bar is that input's sub-score; the figure is the points it added to the 100-point composite (weight × sub-score).
- ARV discount +7.5/15.0
- Cash flow +6.2/30.0
- Rent growth +3.8/5.0
- Livability +3.2/5.0
- Schools +3.1/10.0
- Condition / age +2.2/5.0
- 1% rule +1.4/10.0
- DSCR +0.5/10.0
- Appreciation +0.0/10.0
$141,000
🖨 Deal sheet (PDF) 📄 Offer letter ✓ Due diligence
Listing remarks MLS
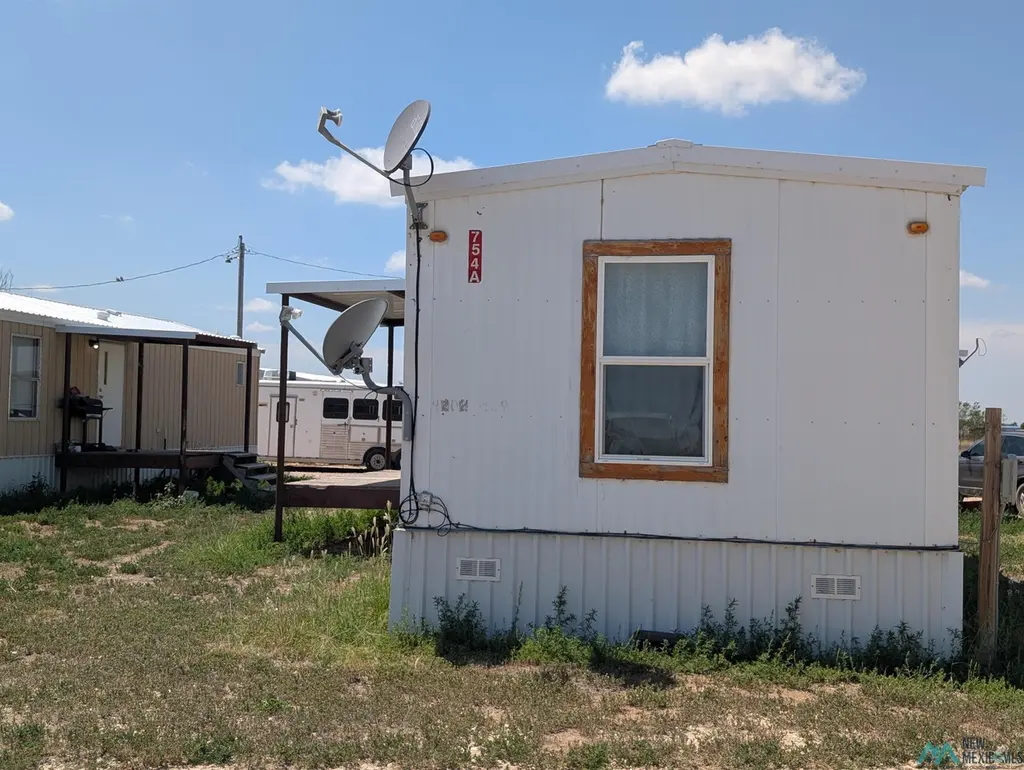
2.524± Acre Property with Two Homes, Covered Stalls & Room to Expand – Near Portales & ENMU This 2.524± acre property offers an exceptional opportunity for comfortable living, livestock care, and potential rental income—all just minutes from Portales and Eastern New Mexico University (ENMU). Two Single-Wide Mobile Homes Included: Home A: 2 Bedrooms, 2 Bathrooms Home B: 2 Bedrooms, 1 Bathroom Both homes are equipped with central air conditioning, providing year-round comfort. Equestrian/Livestock Features: Eight 45' x 15' covered stalls, ideal for horses or other livestock Ample space available to add an arena or riding area to suit your needs Additional Highlights: Convenient blacktop road access Close proximity to ENMU – excellent investment or rental potential Full RV/travel trailer hookup on-site for added versatility Whether you're an equestrian enthusiast, investor, or someone looking for a rural property with room to grow, this listing combines functionality, location, and value. Don’t miss your chance to own a multi-use property with excellent access and endless potential.
Key facts
- Covered stalls
- Room to expand
- Built 2002
Tags
Neighborhood map
What this means for you Summary
Snapshot
- This is a ?-bed/2.0-bath condo listed at $141k. Condition is rated fair.
Deal economics
- At list price, monthly cash flow is $-258 ($-3k/yr) — negative.
- To cash-flow at today's rent, offer at most $104k (26.5% below list).
- To meet the 1% rule (rent ≥ 1% of price), the offer needs to be $91k (35.7% below list).
- Recommended offer: $91k (35.7% below list) — sets the bar for 1% rule.
Location & tenants
- Location reads 64/100 on livability (#63 in NM) — a middle-class / working-renter tenant base. Strengths: cost of living A+, health & safety A+, housing A-; Watch: schools F, crime F, amenities F.
- Portales Municipal Schools (town): math 17% / reading 57% proficiency, ranked #15 of 29 in NM (top 52%) — families likely to look elsewhere, expect single-tenant / working-renter base with shorter leases; 62% free/reduced lunch — lower-income household profile, screen leases tightly.
- Market conditions: Rents rising fast (+5.4%/yr); 128 active listings in the ZIP; 31 units permitted in Roosevelt County in 2024 (0 in 5+ unit buildings).
Forward outlook
- Local home prices are declining (-3.0%/yr); year-one equity from $975 of loan paydown is wiped out by about $4k of value loss. Plan a longer hold.
- Roosevelt County population projected at -28% by 2050 — secular population decline; favor cash flow + early exit over multi-decade hold.
Negotiation context
- It's been on market 294 days — a 12% lower offer ($124k) is reasonable based on typical stale-listing flexibility.
Questions for the listing agent
- What do current leases actually rent for vs. the listed asking? Can we see a recent rent roll and the last 12 months of T-12 income?
- It's been on market 294 days. Have you received any prior offers? Is the seller open to a 36% concession, seller financing, or rate buy-down credit?
- Have any recent inspections been done? Can we get a copy of the seller's disclosures and any deferred-maintenance estimates?
- Any open or pending special assessments — roof, HVAC, plumbing, elevator, façade? What's the per-unit balance and payoff schedule, and is the seller paying it off at close or rolling it to the buyer?
- Why hasn't it sold? Are there any deal-killer items the seller is aware of (foundation, flood, title, zoning, code violations)?
- Is there a deadline driving the sale (1031 exchange, divorce, estate, relocation)? That informs how much negotiation room exists.
- Schools are F-rated, which usually means shorter tenancies and higher turnover. Who's the typical renter profile here, and what's been the actual vacancy rate?
- Crime grade is F in this area — have there been break-ins, vandalism, or insurance claims at this property in the last 3 years? What carrier currently insures it and at what premium?
- The area grade is low — what's the realistic commute time and amenity access for the typical tenant pool here? Any planned neighborhood developments (good or bad) we should know about?
- What's the average days-on-market for RENTAL listings here right now (not sales)? A rising rental-DOM trend means longer vacancies and softer asking-rent achievability than the comps imply.
- What's the recent tenant-quality profile in this submarket — average credit score on applications, eviction rate, late-payment / NSF rate, and stable-employment percentage? A property-management company in the area should have these aggregated.
- How much new apartment / multifamily construction is in the pipeline within 1–3 miles? Heavy new supply (>2% of stock underway) typically softens rents 12–24 months out; light construction supports rent growth.
Investment metrics
- 1% rule
- 0.64% ✗
- Cap rate
- 4.10%
- Cash-on-cash
- -7.84%
- DSCR
- 0.65
- GRM
- 13.0
CMA / ARV
No comps found within radius.
Projected returns pro-forma
-3.0% appreciation · 5.38% rent growth · sell at horizon
- IRR
- -27.5%
- Equity multiple
- 0.06×
- Total profit
- $-37,049
- Equity at exit
- $21,024
- IRR
- -18.8%
- Equity multiple
- -0.11×
- Total profit
- $-43,795
- Equity at exit
- $12,191
Cash invested: $39,480 (down + closing). Projections, not guarantees.
Landlord ↔ Tenant lean methodology
- Overall (STATE)
- 55 Moderately Landlord-Leaning
- State New Mexico
- 55 Moderately Landlord-Leaning · D+3
- County
- — inherits STATE
- City
- — inherits STATE
ZIP-level market 88130
- Rents YoY
- 5.4%
- Active inventory
- 128
- Price-to-rent
- 13.0×
Monthly cashflow live
- Estimated rent
- $907 medium interval (Pro) →
- Mortgage (P&I)
- −$739
- Tax est. 1.5%
- −$176 /mo · $2,115/yr
- Insurance
- −$59
- HOA
- −$0
- Vacancy / Maint / Mgmt
- −$190
- Net cashflow
- $-258
Break-even live
Sensitivity live
| Price | -10% $-161 | -5% $-209 | +0% $-258 | +5% $-307 | +10% $-356 |
|---|---|---|---|---|---|
| Rent | -10% $-330 | -5% $-294 | +0% $-258 | +5% $-222 | +10% $-186 |
| Rate | -1.0pp $-187 | -0.5pp $-222 | base $-258 | +0.5pp $-295 | +1.0pp $-332 |
UW: 25.0% down · 7.5% · 30yr · 1.5% tax · 5.0% vac · 8.0% maint · 8.0% mgmt
Financing live
Cash to close
- Down payment
- $35,250
- Closing costs
- $4,230
- Reserves months
- —
- Total cash needed
- —
Loan-product check · same deal, 3 products live
Conventional
25% down · 7.5% · 30yr
- Down + closing
- —
- Monthly P&I
- —
- Monthly cashflow
- —
- DSCR
- —
- Eligible?
- —
Personal DTI + credit; lowest rate.
DSCR
20% down · 8.5% · 30yr
- Down + closing
- —
- Monthly P&I
- —
- Monthly cashflow
- —
- DSCR
- —
- Eligible?
- —
No personal income docs; deal must DSCR.
Hard money
10% down · 12.0% · 12mo
- Down + closing
- —
- Monthly P&I
- —
- Monthly cashflow
- —
- DSCR
- —
- Eligible?
- —
Short-term bridge; refi at stabilization.
HOA detail condo
- Monthly dues
- $0 · $0/yr
- Assessments
- None detected in remarks — confirm with the listing agent.
Listing history 17 events
-
2026-06-19days on market $141,000 Active 294 DOM
-
2026-06-18days on market $141,000 Active 293 DOM
-
2026-06-17days on market $141,000 Active 292 DOM
-
2026-06-16days on market $141,000 Active 291 DOM
-
2026-06-15days on market $141,000 Active 290 DOM
-
2026-06-14days on market $141,000 Active 288 DOM
-
2026-06-12days on market $141,000 Active 287 DOM
-
2026-06-09days on market $141,000 Active 284 DOM
-
2026-06-08days on market $141,000 Active 283 DOM
-
2026-06-07days on market $141,000 Active 282 DOM
-
2026-06-05days on market $141,000 Active 279 DOM
-
2026-06-03days on market $141,000 Active 278 DOM
-
2026-06-02days on market $141,000 Active 277 DOM
-
2026-06-01days on market $141,000 Active 276 DOM
-
2026-05-31days on market $141,000 Active 275 DOM
-
2026-05-30days on market $141,000 Active 274 DOM
-
2025-08-29$141,000 Active 1156-char remark
Show marketing remark (1156 chars)
2.524± Acre Property with Two Homes, Covered Stalls & Room to Expand – Near Portales & ENMU This 2.524± acre property offers an exceptional opportunity for comfortable living, livestock care, and potential rental income—all just minutes from Portales and Eastern New Mexico University (ENMU). Two Single-Wide Mobile Homes Included: Home A: 2 Bedrooms, 2 Bathrooms Home B: 2 Bedrooms, 1 Bathroom Both homes are equipped with central air conditioning, providing year-round comfort. Equestrian/Livestock Features: Eight 45' x 15' covered stalls, ideal for horses or other livestock Ample space available to add an arena or riding area to suit your needs Additional Highlights: Convenient blacktop road access Close proximity to ENMU – excellent investment or rental potential Full RV/travel trailer hookup on-site for added versatility Whether you're an equestrian enthusiast, investor, or someone looking for a rural property with room to grow, this listing combines functionality, location, and value. Don’t miss your chance to own a multi-use property with excellent access and endless potential.
ⓘ Source: listings_history table (triggers on properties + properties_extension) + one-shot
backfill from property_details.listing_events for pre-trigger history.
Nearby sold comps map
Loading sold comps map…
Walkable amenities ~0.75 mi
Loading nearby amenities…
Taxation est. · year 1
- Rental income
- $10,881
- − Mortgage interest
- −$7,898
- − Property taxes
- −$2,115
- − Insurance
- −$705
- − Repairs & maintenance
- −$870
- − Management
- −$870
- − Depreciation
- −$4,102
- Taxable loss
- −$5,680
- Est. tax savings @ 24.0%
- +$1,363
- After-tax cash flow
- $-1,734/yr
For passive investors: Depreciation is non-cash, so a rental often shows a tax loss while cash-flowing — sheltering income. Rental losses are passive: they offset passive income freely, and up to $25,000/yr can offset ordinary (W-2) income if you actively participate and your MAGI is under $100k (phasing out to $0 by $150k); unused losses carry forward. On sale, claimed depreciation is recaptured at up to 25%, and gains may owe capital-gains tax (a 1031 exchange can defer both). Figures are a year-1 estimate at your 24.0% rate — not tax advice; consult a CPA.
Condition & rehab AI · 13 photos
The property requires significant repairs and maintenance, including roof replacement, exterior siding and fencing repair, and landscaping. These improvements would significantly increase its resale and rental value.
Repairs flagged
- Major roof — The independent satellite image shows visible wear and tear on the flat roof, indicating potential damage or need for replacement.
- Major exterior siding — The exterior siding appears weathered and in need of repainting or replacement.
- Major fencing — The fencing is in poor condition, with visible damage and missing sections.
- Major flooring — The interior flooring appears to be carpeted and in need of cleaning or replacement.
Value-add opportunities
- Resale roof replacement — A new roof would significantly improve the home's curb appeal and increase its resale value.
- Resale exterior siding and fencing repair/replacement — Repairing or replacing the exterior siding and fencing would improve the home's curb appeal and increase its resale value.
- Both landscaping — Landscaping would improve the home's curb appeal and increase both its resale and rental value.
Renovation cost estimate screening
| Repair item | Severity | Est. cost |
|---|---|---|
| roof · The independent satellite image shows visible wear and tear on the flat roof, indicating potential damage or need for replacement. | Major | $15,000–50,000 |
| exterior siding · The exterior siding appears weathered and in need of repainting or replacement. | Major | $15,000–50,000 |
| fencing · The fencing is in poor condition, with visible damage and missing sections. | Major | $15,000–50,000 |
| flooring · The interior flooring appears to be carpeted and in need of cleaning or replacement. | Major | $15,000–50,000 |
| Total estimated repair cost · 4 items | $60,000–200,000 |
Value-add ROI direction
- Resale roof replacement — A new roof would significantly improve the home's curb appeal and increase its resale value. ↑
- Resale exterior siding and fencing repair/replacement — Repairing or replacing the exterior siding and fencing would improve the home's curb appeal and increase its resale value. ↑
- Both landscaping — Landscaping would improve the home's curb appeal and increase both its resale and rental value. ↑
ⓘ Cost ranges are severity-bucket heuristics (US national rule-of-thumb). Get contractor quotes + a written scope before underwriting a rehab budget.
Schools (NCES district)
- District
- Portales Municipal Schools
- NCES district ID
- 3502100
- Math proficiency
- 17% ▼ -5.00%
- Reading proficiency
- 57% ▲ 20.00%
- Median HH income
- $36,151
- Composite
- 30.52/100
- National rank
- #6209
- State rank
- #15 of 29 in NM
Livability — Portales
- Score
- 64/100
- State rank
- #63
- US rank
- #13640
Category grades
Schools grade is shown separately in the Schools card above.
Census & demographics
- County
- Roosevelt County · 17,842 people
- City population
- 17,842
- Metro
- Portales, NM
- Population (ZIP)
- 17,842
- Household income
- $52,434
- Rent vs Own
- Severe rent burden
- 574.0
Population outlook (Roosevelt County) Hauer SSP2
- Today (2025)
- 16,821 people
- By 2030
- 15,818 · -6.0%
- By 2040
- 13,766 · -18.2%
- By 2050
- 12,152 · -27.8%
- By 2075
- 9,601 · -42.9%
- By 2100
- 8,241 · -51.0%
Race, ethnicity, and origin ACS 2023
- Neighborhood character
- Diverse neighborhood (Simpson 0.57)
- Race & ethnicity
- White 48% Hispanic / Latino 45% Two or more races 18% Native American 1%
- Hispanic origin (detail)
- Mexican 39% Puerto Rican 1%
- Common ancestry
- Italian 2% Slovak 2% Serbian 1%
- Foreign-born
- 6% · Canada
- Languages at home
- 78% English-only · Spanish 21%
Political lean MEDSL · Roosevelt
- 2024 margin
- Solid R (+43.2) · D 27.4% · R 70.6% · Other 2.0%
- 2008→2024 swing
- -13.3pp toward R · 2008: -29.9pp · 2024: -43.2pp
- All cycles
- 2024: R+43.2 2020: R+42.9 2016: R+41.3 2012: R+38.9 2008: R+29.9
Not yet ingested
- Civics
- —
Market trends
- HPI YoY
- ▼ -154.72%
- Current HPI
- 108.0555
- Rent YoY
- ▲ 5.38%
- Metro
- Portales, NM
- State GDP YoY
- —
- F500 in state
- 0
Price history
1 event — show timeline
- 2025-08-29 Listed $141,000 NMMLS
Cash-flow waterfall
monthlySold comps — $/sqft
last 12 mo · ≤1 miLoading sold comps…