269 Us Route 11 #29 · Brewerton, NY
Flood risk 1/10 · Minimal
- FEMA flood zone
- X (unshaded)
- Chance of flooding over 30 yrs
- 0.0%
- Est. flood insurance / yr
- $507 – $1,088
Fire risk 2/10 · Minimal
- Est. fire insurance / yr
- $691 – $1,283
Heat risk 2/10 · Minimal
- Hot days now (above 95°F)
- 7 days/yr
- Hot days in 30 yrs
- 16 days/yr
Wind risk 1/10 · Minimal
- Chance of severe wind over 30 yrs
- —
Air-quality risk 2/10 · Minimal
- Unhealthy air days now
- 1 days/yr
- Unhealthy air days in 30 yrs
- 1 days/yr
Risk factors via First Street. Map © Google.
Why this score? — see what drove the B+ grade
The composite is a weighted blend of 9 inputs, each scored 0–100. Each bar is that input's sub-score; the figure is the points it added to the 100-point composite (weight × sub-score).
- Cash flow +30.0/30.0
- 1% rule +10.0/10.0
- DSCR +10.0/10.0
- Appreciation +10.0/10.0
- ARV discount +7.5/15.0
- Schools +3.5/10.0
- Livability +3.3/5.0
- Rent growth +2.5/5.0
- Condition / age +2.0/5.0
$89,900
🖨 Deal sheet 📄 Offer letter ✓ Due diligence
Listing remarks MLS
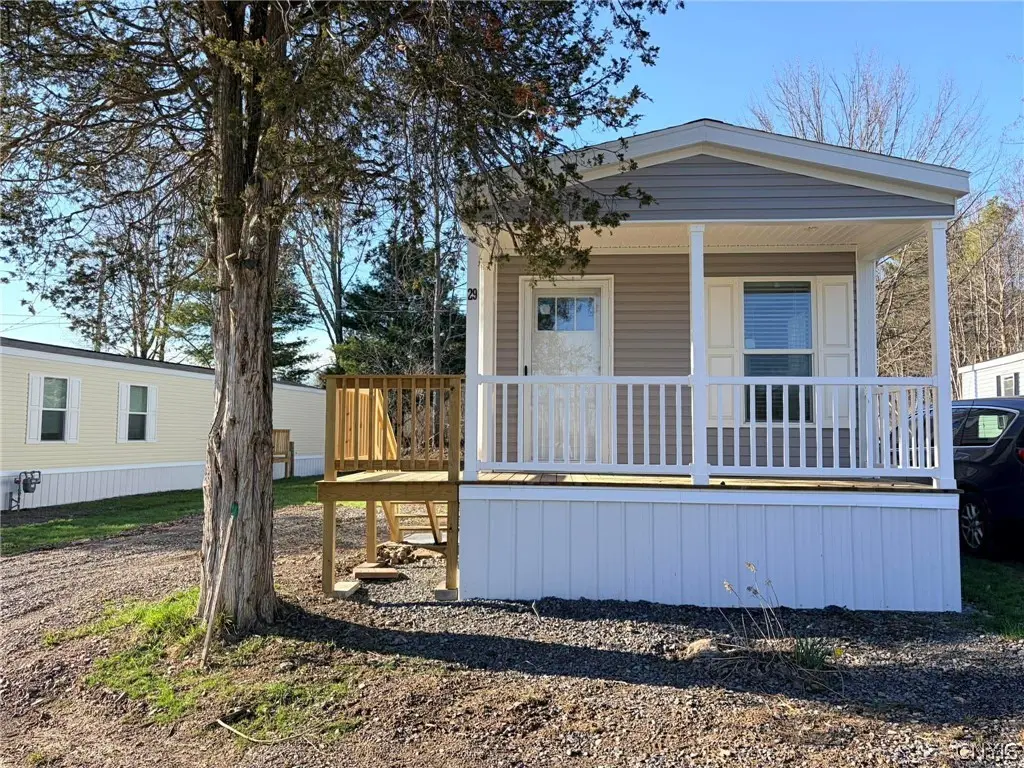
Affordable Home in 55+ Community!! This mobile home is located in a desirable 55+ community. Convenient location close to shopping, dining, and essential services. Features include, lot rent:$495/month, park approval required (650+ credit score), quiet, friendly neighborhood. Enjoy low-maintenance living in a welcoming environment.
Key facts
- Clean modern feel
- Ongoing improvements
- New homes
Tags
Property features AI
Finance
- HOA & community: Located in a senior community; Land lease required ($520)
Exterior
- Parking: No garage
- Utilities: Electricity connected; Water connected (public); Septic tank
- Home design: Double-wide mobile home; Single-story; Existing/resale condition; Located on a private road; Irregular, secluded lot
- Construction: Aluminum siding
- Exterior features: Dirt driveway; Open porch; Patio/porch
Interior
- Kitchen: Gas oven; Gas range; Refrigerator
- Bedrooms: 2 main-level bedrooms
- Flooring: Vinyl; Varied flooring
- Bathrooms: 1 full bathroom (main level)
- Heating & cooling: Gas forced-air heating; Central air conditioning
- Interior features: Eat-in kitchen; Separate/formal living room
- Laundry & utility: Washer; Dryer; Electric water heater
Neighborhood map
What this means for you Summary
Snapshot
- This is a 2-bed/1.0-bath manufactured listed at $90k. Condition is rated fair.
Deal economics
- At list price, monthly cash flow is $706 ($8k/yr) — positive.
- The deal already cash-flows at list — no discount required.
- Meets the 1% rule at list price ($2k rent vs $90k).
- Recommended offer: $85k (6.0% below list) — sets the bar for market timing.
- Cap rate 15.7% vs local median 3.6% in Brewerton — top-decile yield for the area; either an underpriced asset or a hidden risk that comps aren't pricing in. Stress-test before assuming the spread holds.
Location & tenants
- Location reads 66/100 on livability (#618 in NY) — a middle-class / working-renter tenant base. Strengths: housing A+, employment A, cost of living B+; Watch: amenities F, commute F, health & safety D-.
- Central Square Central School District (suburban): math 40% / reading 40% proficiency, ranked #507 of 590 in NY (top 86%) — families likely to look elsewhere, expect single-tenant / working-renter base with shorter leases.
- Market conditions: 35 active listings in the ZIP; 172 units permitted in Oswego County in 2024 (27 in 5+ unit buildings).
Forward outlook
- In year one you build about $10k of equity ($622 loan paydown + $9k appreciation (10.0% local appreciation)).
- Oswego County population projected at -23% by 2050 — secular population decline; favor cash flow + early exit over multi-decade hold.
- At projected returns (10.0% appreciation + 3.0% rent growth), your $25k cash investment doubles in ~2 years — after that, you're playing with house money.
- By year 4, paydown + projected appreciation supports a ~$34k cash-out refi (75% LTV) — recoverable capital for the next deal without selling this one.
Negotiation context
- It's been on market 69 days — a 6% lower offer ($85k) is reasonable based on typical stale-listing flexibility.
- 3 sale attempts with the ask held roughly flat each time — persistent listings suggest the price (not the market) is what's stuck; bring a comps-based counter.
Questions for the listing agent
- It's been on market 69 days. Have you received any prior offers? Is the seller open to a 6% concession, seller financing, or rate buy-down credit?
- Have any recent inspections been done? Can we get a copy of the seller's disclosures and any deferred-maintenance estimates?
- Why hasn't it sold? Are there any deal-killer items the seller is aware of (foundation, flood, title, zoning, code violations)?
- Is there a deadline driving the sale (1031 exchange, divorce, estate, relocation)? That informs how much negotiation room exists.
- What's the average days-on-market for RENTAL listings here right now (not sales)? A rising rental-DOM trend means longer vacancies and softer asking-rent achievability than the comps imply.
- What's the recent tenant-quality profile in this submarket — average credit score on applications, eviction rate, late-payment / NSF rate, and stable-employment percentage? A property-management company in the area should have these aggregated.
- How much new for-sale + rental construction is in the pipeline within 1–3 miles? Heavy new supply typically softens prices + rents 12–24 months out; constrained supply supports both.
Investment metrics
- 1% rule
- 1.87% ✓
- Cap rate
- 15.72%
- Cash-on-cash
- 33.68%
- DSCR
- 2.50
- GRM
- 4.5
CMA / ARV
No comps found within radius.
Projected returns pro-forma
10.0% appreciation · 3.0% rent growth · sell at horizon
- IRR
- 50.0%
- Equity multiple
- 4.73×
- Total profit
- $93,981
- Equity at exit
- $80,989
- IRR
- 43.7%
- Equity multiple
- 10.59×
- Total profit
- $241,426
- Equity at exit
- $174,656
Cash invested: $25,172 (down + closing). Projections, not guarantees.
Landlord ↔ Tenant lean methodology
- Overall (STATE)
- 15 Strongly Tenant-Friendly
- State New York
- 15 Strongly Tenant-Friendly · D+10
- County
- — inherits STATE
- City
- — inherits STATE
ZIP-level market 13036
- Home prices YoY
- 7.9%
- Active inventory
- 35
- Price-to-rent
- 4.5×
Monthly cashflow live
- Estimated rent
- $1,681 medium interval (Pro) →
- Mortgage (P&I)
- −$471
- Tax est. 1.5%
- −$112 /mo · $1,348/yr
- Insurance
- −$37
- HOA
- −$0
- Vacancy / Maint / Mgmt
- −$353
- Net cashflow
- $706
Break-even live
UW: 25.0% down · 7.5% · 30yr · 1.5% tax · 5.0% vac · 8.0% maint · 8.0% mgmt
Financing live
Cash to close
- Down payment
- $22,475
- Closing costs
- $2,697
- Reserves months
- —
- Total cash needed
- —
Loan-product check · same deal, 3 products live
Conventional
25% down · 7.5% · 30yr
- Down + closing
- —
- Monthly P&I
- —
- Monthly cashflow
- —
- DSCR
- —
- Eligible?
- —
Personal DTI + credit; lowest rate.
DSCR
20% down · 8.5% · 30yr
- Down + closing
- —
- Monthly P&I
- —
- Monthly cashflow
- —
- DSCR
- —
- Eligible?
- —
No personal income docs; deal must DSCR.
Hard money
10% down · 12.0% · 12mo
- Down + closing
- —
- Monthly P&I
- —
- Monthly cashflow
- —
- DSCR
- —
- Eligible?
- —
Short-term bridge; refi at stabilization.
Listing history 12 events
-
2026-06-18days on market $89,900 Active 69 DOM
-
2026-06-17days on market $89,900 Active 68 DOM
-
2026-06-16days on market $89,900 Active 67 DOM
-
2026-06-15days on market $89,900 Active 66 DOM
-
2026-06-13days on market $89,900 Active 64 DOM
-
2026-06-12days on market $89,900 Active 63 DOM
-
2026-06-09days on market $89,900 Active 60 DOM
-
2026-06-08days on market $89,900 Active 59 DOM
-
2026-06-07days on market $89,900 Active 58 DOM
-
2026-06-07days on market $89,900 Active 57 DOM
-
2026-06-04remarks 699-char remark
-
2026-06-04$89,900 Active 54 DOM
ⓘ Source: listings_history table (triggers on properties + properties_extension) + one-shot
backfill from property_details.listing_events for pre-trigger history.
Climate risk First Street
- Flood 1/10 Low FEMA zone X (unshaded) · 0% chance over 30 yrs
- Wildfire 2/10 Low
- Heat 2/10 Low 7 d/yr ≥95°F today · 16 d/yr by 30 yrs out
- Wind 1/10 Low
- Air quality 2/10 Low 1 unhealthy d/yr today · 1 by 30 yrs out
Nearby sold comps map
Loading sold comps map…
Walkable amenities ~0.75 mi
Loading nearby amenities…
Taxation est. · year 1
- Rental income
- $20,168
- − Mortgage interest
- −$5,036
- − Property taxes
- −$1,348
- − Insurance
- −$450
- − Repairs & maintenance
- −$1,613
- − Management
- −$1,613
- − Depreciation
- −$2,615
- Taxable income
- $7,492
- Est. tax owed @ 24.0%
- −$1,798
- After-tax cash flow
- $6,679/yr
For passive investors: Depreciation is non-cash, so a rental often shows a tax loss while cash-flowing — sheltering income. Rental losses are passive: they offset passive income freely, and up to $25,000/yr can offset ordinary (W-2) income if you actively participate and your MAGI is under $100k (phasing out to $0 by $150k); unused losses carry forward. On sale, claimed depreciation is recaptured at up to 25%, and gains may owe capital-gains tax (a 1031 exchange can defer both). Figures are a year-1 estimate at your 24.0% rate — not tax advice; consult a CPA.
Condition & rehab AI · 1 photo
This manufactured home requires moderate repairs and maintenance to improve its condition and increase its value for resale or rental.
Repairs flagged
- Major Exterior siding — Significant wear and tear
- Major Flooring — Exposed subflooring
- Major Interior walls — Peeling paint
Value-add opportunities
- Both Painting and minor repairs to exterior siding — Enhances curb appeal and interior appearance
- Both Flooring replacement — Improves living space and reduces maintenance costs
- Both Interior wall repairs and painting — Restores aesthetic appeal and reduces maintenance costs
Renovation cost estimate screening
| Repair item | Severity | Est. cost |
|---|---|---|
| Exterior siding · Significant wear and tear | Major | $15,000–50,000 |
| Flooring · Exposed subflooring | Major | $15,000–50,000 |
| Interior walls · Peeling paint | Major | $15,000–50,000 |
| Total estimated repair cost · 3 items | $45,000–150,000 |
Value-add ROI direction
- Both Painting and minor repairs to exterior siding — Enhances curb appeal and interior appearance ↑
- Both Flooring replacement — Improves living space and reduces maintenance costs ↑
- Both Interior wall repairs and painting — Restores aesthetic appeal and reduces maintenance costs ↑
ⓘ Cost ranges are severity-bucket heuristics (US national rule-of-thumb). Get contractor quotes + a written scope before underwriting a rehab budget.
Schools (NCES district)
- District
- Central Square Central School District
- NCES district ID
- 3606900
- Math proficiency
- 40% ▼ -18.00%
- Reading proficiency
- 40% ▼ -12.00%
- Median HH income
- $55,807
- Composite
- 35.05/100
- National rank
- #5035
- State rank
- #507 of 590 in NY
Livability — Brewerton
- Score
- 66/100
- State rank
- #618
- US rank
- #11214
Category grades
Schools grade is shown separately in the Schools card above.
Census & demographics
- City population
- 7,594
- Population (ZIP)
- 9,079
Population outlook (Oswego County) Hauer SSP2
- Today (2025)
- 114,465 people
- By 2030
- 109,968 · -3.9%
- By 2040
- 99,205 · -13.3%
- By 2050
- 87,979 · -23.1%
- By 2075
- 65,100 · -43.1%
- By 2100
- 47,117 · -58.8%
Race, ethnicity, and origin ACS 2023
- Neighborhood character
- Predominantly White (97%)
- Race & ethnicity
- White 97% Two or more races 3%
- Common ancestry
- Romanian 8% Lithuanian 6% Iranian 3%
- Foreign-born
- 1% · Canada
- Languages at home
- 97% English-only · Other Indo-European 2% Spanish 1%
Political lean MEDSL · Oswego
- 2024 margin
- Strong R (+24.2) · D 37.9% · R 62.1%
- 2008→2024 swing
- -26.6pp toward R · 2008: 2.5pp · 2024: -24.2pp
- All cycles
- 2024: R+24.2 2020: R+20.2 2016: R+23.2 2012: D+7.9 2008: D+2.5
Not yet ingested
- Civics
- —
Market trends
- HPI YoY
- ▲ 23.27%
- Current HPI
- 318.5068
- Rent YoY
- —
- Metro
- —
- State GDP YoY
- ▲ 2.60%
- F500 in state
- 92
Industry mix (Fortune 500 HQ in NY)
| Industry | F500 HQs | Revenue |
|---|---|---|
| Financial Services | 10 | $950B |
|
||
| Consumer Goods | 9 | $162B |
|
||
| Insurance | 4 | $225B |
|
||
| Telecommunications | 2 | $144B |
|
||
| Pharmaceuticals | 2 | $112B |
|
||
| Media / Entertainment | 2 | $69B |
|
||
Price history
-5.4% since first listed6 events — show timeline
- 2026-04-10 Listed $89,900 CNYIS
- 2026-04-02 Listing Removed — CNYIS
- 2026-02-19 Listed $87,500 CNYIS
- 2025-11-10 Sold (MLS) $85,000 CNYIS
- 2025-10-04 Price Changed $85,000 CNYIS
- 2025-09-26 Listed $95,000 CNYIS
Cash-flow waterfall
monthlySold comps — $/sqft
last 12 mo · ≤1 miLoading sold comps…