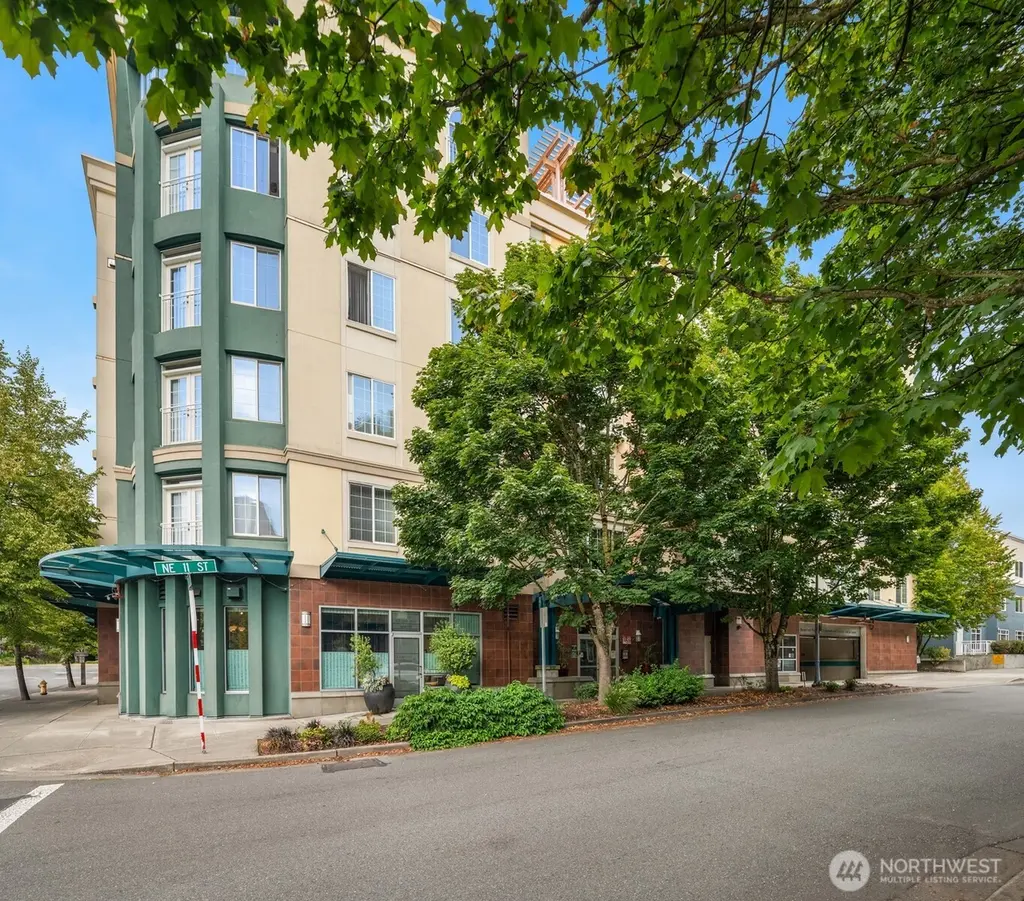
11004 NE 11th St #404 · Bellevue, WA
Flood risk 1/10 · Minimal
- FEMA flood zone
- X (unshaded)
- Chance of flooding over 30 yrs
- 0.0%
- Est. flood insurance / yr
- $507 – $1,088
Fire risk 1/10 · Minimal
- Est. fire insurance / yr
- $604 – $1,122
Heat risk 3/10 · Minor
- Hot days now (above 87°F)
- 7 days/yr
- Hot days in 30 yrs
- 15 days/yr
Wind risk 1/10 · Minimal
- Chance of severe wind over 30 yrs
- —
Air-quality risk 7/10 · Major
- Unhealthy air days now
- 10 days/yr
- Unhealthy air days in 30 yrs
- 12 days/yr
Risk factors via First Street. Map © Google.
Why this score? — see what drove the D- grade
The composite is a weighted blend of 9 inputs, each scored 0–100. Each bar is that input's sub-score; the figure is the points it added to the 100-point composite (weight × sub-score).
- ARV discount +15.0/15.0
- Schools +6.9/10.0
- Appreciation +4.8/10.0
- Livability +4.4/5.0
- Cash flow +3.1/30.0
- Condition / age +2.5/5.0
- Rent growth +2.4/5.0
- 1% rule +0.1/10.0
- DSCR +0.0/10.0
$559,000
🖨 Deal sheet 📄 Offer letter ✓ Due diligence
Listing remarks
Meet Library Square. Located in Downtown Bellevue, blocks from all that the city has to offer. Enjoy sunrises at the easterly facing balcony. Updated kitchen and bathroom meet the needs of today's most discerning homeowner. New engineered hardwood flooring at main living area. Secure, gated garage parking provides an extra layer of comfort. No rental cap affords owners with the option of a cash-producing investment property. Top rated Bellevue School District.
Key facts
- Updated kitchen
- Updated bathroom
- $520 HOA
Tags
Property features AI
Finance
- Other: Building contains 51 units; Bus line nearby
- Financial info: Listing terms: Cash or Conventional
- HOA & community: Monthly HOA fee of $520; HOA covers central hot water, common area maintenance, earthquake insurance, road maintenance and trash; Association managed by Trestle Community Management; Community amenities include elevator, lobby entrance, fire sprinklers, cable TV and high-speed internet availability; Pets allowed (cats and dogs)
Exterior
- Parking: Common garage with 1 covered space (parking space #64); Building has assigned garage parking
- Utilities: Electric and natural gas service; City of Bellevue water and sewer; PSE power; Electric water heater located in closet
- Home design: Attached condominium; One-level condo unit; Located on the 4th floor; Main entry level; Faces east; Part of a 6-story building (Library Square)
- Construction: Stucco construction; Flat roof; Built (effective) in 2001
- Exterior features: Stucco exterior; Corner lot; Curbs, paved streets and sidewalk; Unit-level view
Interior
- Kitchen: Electric cooking; Dishwasher; Garbage disposal; Refrigerator; Stove/Range
- Bedrooms: 1 bedroom (main level)
- Flooring: Ceramic tile; Engineered hardwood
- Bathrooms: 1 full bathroom with bathtub and shower
- Heating & cooling: Forced air heating; No central cooling
- Interior features: Gas fireplace; Walk-in closet(s); Water heater (electric); Insulated windows; Balcony/Deck/Patio
- Laundry & utility: Washer hookup; Dryer hookup (electric); Washer and dryer included
Neighborhood map
What this means for you Summary
Snapshot
- This is a 1-bed/1.0-bath condo listed at $559k.
Deal economics
- At list price, monthly cash flow is $-2k ($-22k/yr) — negative.
- To cash-flow at today's rent, offer at most $241k (56.9% below list).
- To meet the 1% rule (rent ≥ 1% of price), the offer needs to be $282k (49.5% below list).
- Recommended offer: $241k (56.9% below list) — sets the bar for cash-flow.
- Cap rate 2.4% vs local median 1.1% in Bellevue — top-decile yield for the area; either an underpriced asset or a hidden risk that comps aren't pricing in. Stress-test before assuming the spread holds.
Location & tenants
- Location reads 87/100 on livability (#15 in WA, #314 nationally) — a professional / high-income tenant draw. Strengths: amenities A+, commute A+, employment A+; Watch: cost of living F.
- Bellevue School District (urban): math 73% / reading 79% proficiency, ranked #7 of 291 in WA (top 2%) — strong family-tenant draw, lease renewals of 3-5y typical; only 15% free/reduced lunch — higher-income household profile.
- Zoned schools: Clyde Hill Elementary (459 students, 14% FRL); Bellevue High School (1,517 students, 15% FRL) — zoned schools at 14% FRL track the district average.
- Market conditions: Rents soft (-0.2%/yr); 350 active listings in the ZIP; 40 comparable units currently listed for rent nearby; rentals leasing fast (median 3d on market — plan ~1-2 weeks tenant-placement turnaround); high-income renter base; 10,555 units permitted in King County in 2024 (7,119 in 5+ unit buildings).
Forward outlook
- In year one you build about $2k of equity ($4k loan paydown + $-2k appreciation (-0.3% local appreciation)).
- King County population projected at +44% by 2050 — long-run rental-demand tailwind backs the buy-and-hold thesis.
- By year 9, paydown + projected appreciation supports a ~$35k cash-out refi (75% LTV) — recoverable capital for the next deal without selling this one.
Negotiation context
- It's been on market 34 days — a 3% lower offer ($542k) is reasonable based on typical stale-listing flexibility.
- 6 sale attempts since 23y ago with the ask held roughly flat each time — persistent listings suggest the price (not the market) is what's stuck; bring a comps-based counter.
Questions for the listing agent
- What do current leases actually rent for vs. the listed asking? Can we see a recent rent roll and the last 12 months of T-12 income?
- It's been on market 34 days. Have you received any prior offers? Is the seller open to a 57% concession, seller financing, or rate buy-down credit?
- What does the HOA fee cover, when was the last increase, and are there any pending special assessments or reserve-fund shortfalls?
- Any open or pending special assessments — roof, HVAC, plumbing, elevator, façade? What's the per-unit balance and payoff schedule, and is the seller paying it off at close or rolling it to the buyer?
- Is there a deadline driving the sale (1031 exchange, divorce, estate, relocation)? That informs how much negotiation room exists.
- Schools are A-rated — typically a magnet for longer-tenancy family renters. What's the average tenant stay here, and is there a school-zone premium baked into asking?
- The area grade is low — what's the realistic commute time and amenity access for the typical tenant pool here? Any planned neighborhood developments (good or bad) we should know about?
- What's the average days-on-market for RENTAL listings here right now (not sales)? A rising rental-DOM trend means longer vacancies and softer asking-rent achievability than the comps imply.
- What's the recent tenant-quality profile in this submarket — average credit score on applications, eviction rate, late-payment / NSF rate, and stable-employment percentage? A property-management company in the area should have these aggregated.
- How much new apartment / multifamily construction is in the pipeline within 1–3 miles? Heavy new supply (>2% of stock underway) typically softens rents 12–24 months out; light construction supports rent growth.
Investment metrics
- 1% rule
- 0.51% ✗
- Cap rate
- 2.43%
- Cash-on-cash
- -13.79%
- DSCR
- 0.39
- GRM
- 16.5
CMA / ARV
- ARV (median comp)
- $738,262
- List price
- $559,000
- Delta
- -24.28%
- Verdict
- UNDERPRICED
- Comps
- 20 within 1.0 mi
Projected returns pro-forma
-0.34% appreciation · 0.0% rent growth · sell at horizon
- IRR
- -21.5%
- Equity multiple
- 0.06×
- Total profit
- $-147,890
- Equity at exit
- $152,947
- IRR
- -16.7%
- Equity multiple
- -0.56×
- Total profit
- $-244,205
- Equity at exit
- $176,530
Cash invested: $156,520 (down + closing). Projections, not guarantees.
Landlord ↔ Tenant lean methodology
- Overall (STATE)
- 28 Tenant-Leaning
- State Washington
- 28 Tenant-Leaning · D+8
- County
- — inherits STATE
- City
- — inherits STATE
ZIP-level market 98004
- Home prices YoY
- -0.1%
- Rents YoY
- -0.2%
- Active inventory
- 350
- Price-to-rent
- 16.5×
Monthly cashflow live
- Estimated rent
- $2,825 high interval (Pro) →
- Mortgage (P&I)
- −$2,931
- Tax from tax record
- −$347 /mo · $4,158/yr
- Insurance
- −$233
- HOA
- −$520
- Vacancy / Maint / Mgmt
- −$593
- Net cashflow
- $-1,799
Break-even live
UW: 25.0% down · 7.5% · 30yr · 1.5% tax · 5.0% vac · 8.0% maint · 8.0% mgmt
Financing live
Cash to close
- Down payment
- $139,750
- Closing costs
- $16,770
- Reserves months
- —
- Total cash needed
- —
Loan-product check · same deal, 3 products live
Conventional
25% down · 7.5% · 30yr
- Down + closing
- —
- Monthly P&I
- —
- Monthly cashflow
- —
- DSCR
- —
- Eligible?
- —
Personal DTI + credit; lowest rate.
DSCR
20% down · 8.5% · 30yr
- Down + closing
- —
- Monthly P&I
- —
- Monthly cashflow
- —
- DSCR
- —
- Eligible?
- —
No personal income docs; deal must DSCR.
Hard money
10% down · 12.0% · 12mo
- Down + closing
- —
- Monthly P&I
- —
- Monthly cashflow
- —
- DSCR
- —
- Eligible?
- —
Short-term bridge; refi at stabilization.
Rent comps 40 comps
| Address | Beds | Baths | Sqft | Rent | $/sqft | DOM | Units | Dist |
|---|---|---|---|---|---|---|---|---|
| 11004 NE 11th St Bellevue, WA | 1.0 | 1.0 | 788 | $2,250 | $2.86 | 2d | 1 | 0.03mi |
| 11000 NE 10th St Bellevue, WA | 2.0 | 1.0–2.0 | 1036 | $3,210 | $3.10 | 2d | 1 | 0.03mi |
| 11130 NE 10th St Bellevue, WA | 1.0–2.0 | 1.0–2.0 | 856 | $2,544 | $2.97 | 2d | 11 | 0.07mi |
| 938 110th Ave NE Bellevue, WA | 1.0–2.0 | 1.0–2.0 | 835 | $2,190 | $2.62 | 1d | 6 | 0.09mi |
| 989 112th Ave NE #203 Bellevue, WA | 2.0 | 2.0 | 998 | $3,570 | $3.58 | 3d | 1 | 0.10mi |
| 925 110th Ave NE #306 Bellevue, WA | 1.0 | 1.5 | 970 | $3,000 | $3.09 | 11d | 1 | 0.10mi |
| 958 111th Ave NE Bellevue, WA | 2.0 | 1.0–2.0 | 645 | $3,037 | $4.71 | 1d | 22 | 0.11mi |
| 1100 112th Ave NE Unit 1280462P Bellevue, WA | 1.0 | 1.0 | 581 | $6,236 | $10.73 | 3d | 1 | 0.14mi |
| 11011 NE 9th St Bellevue, WA | 2.0 | 1.0–2.0 | 840 | $3,436 | $4.09 | 2d | 12 | 0.15mi |
| 10688 NE 10th St Bellevue, WA | 2.0 | 1.0–2.0 | 848 | $2,863 | $3.37 | 1d | 9 | 0.24mi |
| 1188 106th Ave NE Bellevue, WA | 2.0 | 2.0 | 1231 | $4,750 | $3.86 | 24d | 2 | 0.27mi |
| 688 110th Ave NE Bellevue, WA | 3.0 | 1.0–3.5 | 2159 | $8,980 | $4.16 | 1d | 23 | 0.30mi |
| 1354 Bellevue Way NE #4 Bellevue, WA | 1.0 | 1.0 | 810 | $2,400 | $2.96 | 18d | 1 | 0.37mi |
| 1256 Bellevue Way NE #2 Bellevue, WA | 2.0 | 2.0 | 1100 | $3,050 | $2.77 | 3d | 1 | 0.41mi |
| 10351 NE 10th St #629 Bellevue, WA | 1.0 | 1.0 | 662 | $3,520 | $5.31 | 16d | 2 | 0.44mi |
| 10351 NE 10th St #629 Bellevue, WA | 2.0 | 1.0–2.0 | 836 | $3,415 | $4.08 | 43d | 3 | 0.44mi |
| 10349 NE 10th St Bellevue, WA | 2.0 | 1.0–2.0 | 985 | $3,676 | $3.73 | 1d | 1 | 0.45mi |
| 317 112th Ave NE Bellevue, WA | 2.0 | 1.0–2.0 | 905 | $3,635 | $4.02 | 2d | 22 | 0.47mi |
| 10485 NE 6th St Bellevue, WA | 1.0–3.0 | 1.0–3.5 | 2202 | $5,555 | $2.52 | 1d | 14 | 0.48mi |
| 290 106th Pl NE Bellevue, WA | 2.0 | 1.0 | 531 | $2,090 | $3.93 | 2d | 14 | 0.50mi |
| 308 108th Ave NE Bellevue, WA | 1.0 | 1.0 | 651 | $2,539 | $3.90 | 1d | 8 | 0.51mi |
| 1515 Bellevue Way NE Bellevue, WA | 1.0–2.0 | 1.0–2.0 | 1039 | $2,795 | $2.69 | 2d | 12 | 0.52mi |
| 211 112th Ave NE Bellevue, WA | — | 1.0 | 580 | $1,500 | $2.59 | 43d | 1 | 0.53mi |
| 11115 NE 2nd St Bellevue, WA | 1.0 | 1.0 | 546 | $2,195 | $4.02 | 1d | 6 | 0.57mi |
| 10050 NE 10th St Bellevue, WA | 1.0 | 1.0 | 537 | $2,620 | $4.88 | 2d | 5 | 0.57mi |
| 10050 NE 10th St Bellevue, WA | 3.0 | 1.0–2.0 | 852 | $2,240 | $2.63 | 19d | 4 | 0.57mi |
| 10410 NE 2nd St Bellevue, WA | 3.0 | 1.0–2.0 | 1056 | $2,617 | $2.48 | 2d | 1 | 0.60mi |
| 362 Bellevue Way NE Unit 974 Bellevue, WA | 1.0 | 1.0 | 820 | $2,890 | $3.52 | 43d | 1 | 0.60mi |
| 250 Bellevue Way NE #812 Bellevue, WA | 1.0–2.0 | 1.0–2.0 | 957 | $2,890 | $3.02 | 2d | 2 | 0.63mi |
| 1000 100th Ave NE Bellevue, WA | 1.0 | 1.0 | 769 | $2,995 | $3.89 | 3d | 3 | 0.64mi |
| 970 100th Ave NE Bellevue, WA | 1.0 | 1.0 | 620 | $2,238 | $3.61 | 15d | 2 | 0.65mi |
| 970 100th Ave NE #41 Bellevue, WA | 1.0 | 1.0 | 627 | $2,500 | $3.99 | 3d | 1 | 0.65mi |
| 860 100th Ave NE Bellevue, WA | 2.0 | 1.5 | 1021 | $2,395 | $2.35 | 20d | 1 | 0.66mi |
| 111 108th Ave NE #411 Bellevue, WA | 1.0 | 1.0 | 718 | $2,200 | $3.06 | 43d | 1 | 0.67mi |
| 1375 121st Ave NE Bellevue, WA | 3.0 | 1.0–2.0 | 986 | $3,402 | $3.45 | 1d | 15 | 0.67mi |
| 35 112th Ave NE Bellevue, WA | 2.0 | 1.0–2.0 | 859 | $4,096 | $4.77 | 1d | 20 | 0.67mi |
| 118 107th Ave NE Unit B105 Bellevue, WA | 1.0 | 1.0 | 657 | $2,295 | $3.49 | 3d | 1 | 0.67mi |
| 188 Bellevue Way NE Bellevue, WA | 1.0–2.0 | 1.5–2.0 | 1189 | $4,400 | $3.70 | 43d | 2 | 0.69mi |
| 10708 Main St Bellevue, WA | 1.0 | 1.0 | 604 | $2,000 | $3.31 | 24d | 1 | 0.69mi |
| 12022 NE 8th St Bellevue, WA | 2.0 | 1.0 | 875 | $1,895 | $2.17 | 14d | 1 | 0.70mi |
HOA detail condo
- Monthly dues
- $520 · $6,240/yr
- Likely covers
- security
- Assessments
- None detected in remarks — confirm with the listing agent.
Listing history 37 events
-
2026-06-18days on market $559,000 Active 34 DOM
-
2026-06-17days on market $559,000 Active 33 DOM
-
2026-06-16days on market $559,000 Active 32 DOM
-
2026-06-15days on market $559,000 Active 31 DOM
-
2026-06-13days on market $559,000 Active 29 DOM
-
2026-06-09days on market $559,000 Active 25 DOM
-
2026-06-08days on market $559,000 Active 24 DOM
-
2026-06-07days on market $559,000 Active 23 DOM
-
2026-06-04days on market $559,000 Active 20 DOM
-
2026-06-03days on market $559,000 Active 19 DOM
-
2026-06-02days on market $559,000 Active 18 DOM
-
2026-06-01days on market $559,000 Active 17 DOM
-
2026-05-31days on market $559,000 Active 16 DOM
-
2026-05-15$559,000 Active
-
2019-07-31soldstatus $519,950 Sold
-
2019-07-31soldstatus $519,950
-
2019-06-22status Pending
-
2019-06-16$509,999 Active
-
2015-03-13historical
-
2015-03-06soldstatus $363,950 Sold
-
2015-03-06soldstatus $363,950
-
2015-02-04status Pending
-
2015-01-28$349,950 Active
-
2007-12-03soldstatus $300,000 Sold
-
2007-12-03soldstatus $300,000
-
2007-11-22historical
-
2007-11-20status
-
2007-11-18historical
-
2007-11-10price $349,880
-
2007-10-20price $374,900
-
2007-09-26price $383,950
-
2007-08-28price $379,950
-
2007-06-30price $399,950
-
2007-06-21$409,950
-
2003-09-09soldstatus $217,500
-
2003-09-09soldstatus $217,500
-
2003-06-13$217,500
ⓘ Source: listings_history table (triggers on properties + properties_extension) + one-shot
backfill from property_details.listing_events for pre-trigger history.
Tax reassessment forecast WA · Resets to sale price
- Current annual tax
- $4,158 · $347/mo
- Projected year-2 tax
- $5,478 · $457/mo
- Expected delta
- +$1,320/yr (+$110/mo · 31.7%)
ⓘ Screening estimate from a state-policy table — verify with the county assessor before closing.
Climate risk First Street
- Flood 1/10 Low FEMA zone X (unshaded) · 0% chance over 30 yrs
- Wildfire 1/10 Low
- Heat 3/10 Moderate 7 d/yr ≥87°F today · 15 d/yr by 30 yrs out
- Wind 1/10 Low
- Air quality 7/10 Severe 10 unhealthy d/yr today · 12 by 30 yrs out
Nearby sold comps map
Loading sold comps map…
Walkable amenities ~0.75 mi
Loading nearby amenities…
Taxation est. · year 1
- Rental income
- $33,898
- − Mortgage interest
- −$31,313
- − Property taxes
- −$4,158
- − Insurance
- −$2,795
- − Repairs & maintenance
- −$2,712
- − Management
- −$2,712
- − HOA
- −$6,240
- − Depreciation
- −$16,262
- Taxable loss
- −$32,293
- Est. tax savings @ 24.0%
- +$7,750
- After-tax cash flow
- $-13,841/yr
For passive investors: Depreciation is non-cash, so a rental often shows a tax loss while cash-flowing — sheltering income. Rental losses are passive: they offset passive income freely, and up to $25,000/yr can offset ordinary (W-2) income if you actively participate and your MAGI is under $100k (phasing out to $0 by $150k); unused losses carry forward. On sale, claimed depreciation is recaptured at up to 25%, and gains may owe capital-gains tax (a 1031 exchange can defer both). Figures are a year-1 estimate at your 24.0% rate — not tax advice; consult a CPA.
Schools (NCES district)
- District
- Bellevue School District
- NCES district ID
- 5300390
- Math proficiency
- 73% ▼ -2.00%
- Reading proficiency
- 79% ▬ 0.00%
- Median HH income
- $92,676
- Composite
- 69.36/100
- National rank
- #622
- State rank
- #7 of 291 in WA
Livability — Bellevue
- Score
- 87/100
- State rank
- #15
- US rank
- #314
Category grades
Schools grade is shown separately in the Schools card above.
Census & demographics
- Census place
- Bellevue, WA
- County
- King County · 2,251,916 people
- City population
- 156,686
- Metro
- Seattle-Tacoma-Bellevue, WA
- Population (ZIP)
- 39,897
- Household income
- $182,545
- Rent vs Own
- Severe rent burden
- 1961.0
Population outlook (King County) Hauer SSP2
- Today (2025)
- 2,576,485 people
- By 2030
- 2,803,316 · +8.8%
- By 2040
- 3,255,921 · +26.4%
- By 2050
- 3,706,444 · +43.9%
- By 2075
- 4,746,063 · +84.2%
- By 2100
- 5,407,730 · +109.9%
Race, ethnicity, and origin ACS 2023
- Neighborhood character
- Diverse neighborhood (Simpson 0.64)
- Race & ethnicity
- White 45% Asian 40% Two or more races 9% Hispanic / Latino 6% Black 2%
- Hispanic origin (detail)
- Mexican 3%
- Common ancestry
- Italian 3% Romanian 2% Portuguese 2%
- Foreign-born
- 42% · China, Canada, South Korea
- Languages at home
- 56% English-only · Chinese 14% Other Indo-European 9% Other Asian/Pacific 7%
Political lean MEDSL · King
- 2024 margin
- Solid D (+51.7) · D 74.2% · R 22.5% · Other 3.4%
- 2008→2024 swing
- +9.6pp toward D · 2008: 42.1pp · 2024: 51.7pp
- All cycles
- 2024: D+51.7 2020: D+52.7 2016: D+50.4 2012: D+39.9 2008: D+42.1
Not yet ingested
- Civics
- —
Market trends
- HPI YoY
- ▼ -0.34%
- Current HPI
- 405.5569
- Rent YoY
- ▼ -0.24%
- Metro
- Seattle-Tacoma-Bellevue, WA
- State GDP YoY
- ▲ 4.65%
- F500 in state
- 22
Industry mix (Fortune 500 HQ in WA)
| Industry | F500 HQs | Revenue |
|---|---|---|
| Retail | 2 | $269B |
|
||
| Technology / Retail | 1 | $638B |
|
||
| Technology | 1 | $245B |
|
||
| Telecommunications | 1 | $38B |
|
||
| Food / Beverage | 1 | $36B |
|
||
| Automotive / Trucks | 1 | $34B |
|
||
Price history
+157.0% since first listed24 events — show timeline
- 2026-05-15 Listed $559,000 NWMLS as Distributed by MLS Grid
- 2019-07-31 Sold (Public Records) $519,950 Public Records
- 2019-07-31 Sold (MLS) $519,950 NWMLS as Distributed by MLS Grid
- 2019-06-22 Pending — NWMLS as Distributed by MLS Grid
- 2019-06-16 Listed $509,999 NWMLS as Distributed by MLS Grid
- 2015-03-13 Delisted — NWMLS as Distributed by MLS Grid
- 2015-03-06 Sold (Public Records) $363,950 Public Records
- 2015-03-06 Sold (MLS) $363,950 NWMLS as Distributed by MLS Grid
- 2015-02-04 Pending — NWMLS as Distributed by MLS Grid
- 2015-01-28 Listed $349,950 NWMLS as Distributed by MLS Grid
- 2007-12-03 Sold (Public Records) $300,000 Public Records
- 2007-12-03 Sold (MLS) $300,000 NWMLS as Distributed by MLS Grid
- 2007-11-22 Delisted — NWMLS as Distributed by MLS Grid
- 2007-11-20 Relisted — NWMLS as Distributed by MLS Grid
- 2007-11-18 Contingent — NWMLS as Distributed by MLS Grid
- 2007-11-10 Price Changed $349,880 NWMLS as Distributed by MLS Grid
- 2007-10-20 Price Changed $374,900 NWMLS as Distributed by MLS Grid
- 2007-09-26 Price Changed $383,950 NWMLS as Distributed by MLS Grid
- 2007-08-28 Price Changed $379,950 NWMLS as Distributed by MLS Grid
- 2007-06-30 Price Changed $399,950 NWMLS as Distributed by MLS Grid
- 2007-06-21 Listed $409,950 NWMLS as Distributed by MLS Grid
- 2003-09-09 Sold (Public Records) $217,500 Public Records
- 2003-09-09 Sold (MLS) $217,500 NWMLS as Distributed by MLS Grid
- 2003-06-13 Listed $217,500 NWMLS as Distributed by MLS Grid
Property tax history
+4.1%/yrLatest (2025): $4,158 · -19.9% YoY. Source: county tax records.
Cash-flow waterfall
monthlySold comps — $/sqft
last 12 mo · ≤1 miLoading sold comps…