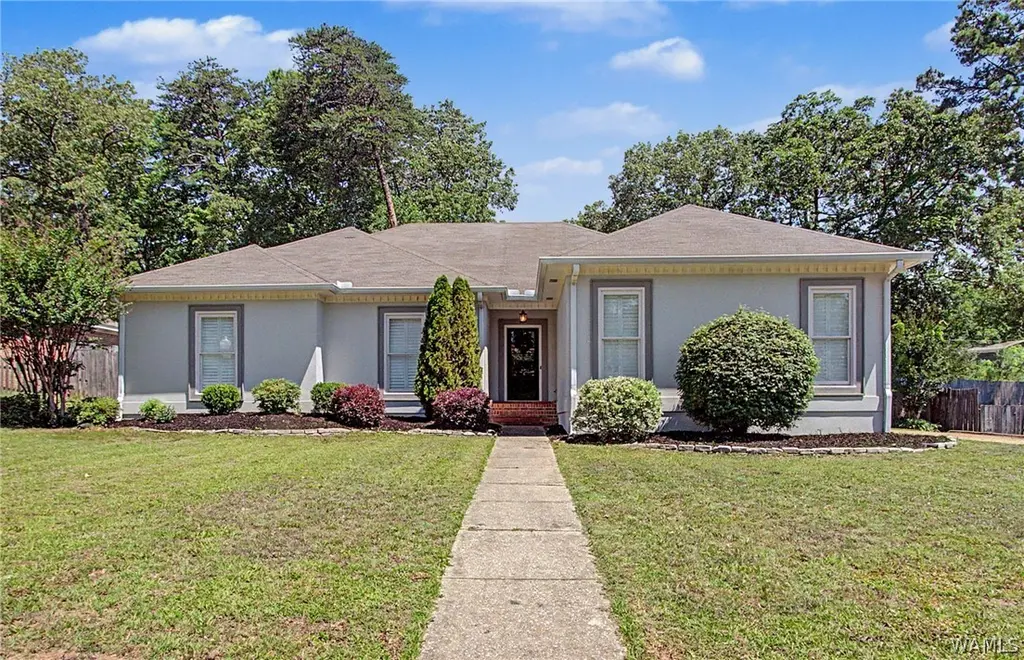
7 Oakchase · Tuscaloosa, AL
Flood risk 1/10 · Minimal
- FEMA flood zone
- X (unshaded)
- Chance of flooding over 30 yrs
- 0.0%
- Est. flood insurance / yr
- $507 – $1,088
Fire risk 4/10 · Minor
- Est. fire insurance / yr
- $916 – $1,700
Heat risk 7/10 · Major
- Hot days now (above 108°F)
- 7 days/yr
- Hot days in 30 yrs
- 20 days/yr
Wind risk 6/10 · Moderate
- Chance of severe wind over 30 yrs
- 59.0%
Air-quality risk 3/10 · Minor
- Unhealthy air days now
- 3 days/yr
- Unhealthy air days in 30 yrs
- 3 days/yr
Risk factors via First Street. Map © Google.
Why this score? — see what drove the F grade
The composite is a weighted blend of 9 inputs, each scored 0–100. Each bar is that input's sub-score; the figure is the points it added to the 100-point composite (weight × sub-score).
- Cash flow +15.4/30.0
- DSCR +4.7/10.0
- Livability +3.9/5.0
- 1% rule +3.0/10.0
- Rent growth +2.5/5.0
- Schools +2.5/10.0
- Condition / age +2.5/5.0
- ARV discount +0.0/15.0
- Appreciation +0.0/10.0
$429,900
🖨 Deal sheet (PDF) 📄 Offer letter ✓ Due diligence
Listing remarks MLS
Discover this stunning one-level 4-bedroom, 2-bathroom home located north of the river in the peaceful neighborhood of Oak Chase. The kitchen boasts new stainless steel appliances, pantry, and a breakfast nook. The living room features a double tray ceiling, built-in shelving and a cozy fireplace. The master suite features hardwood flooring, a spacious tray ceiling, a walk-in closet, a double vanity, and a relaxing whirlpool tub. In addition, this home offers the convenience of a walk-in laundry room equipped with a utility sink and a 2-car garage and has been updated with plantation shutters, a fresh exterior paint job, updated gutters and soffit, and the addition of a back deck in August 2020. Enjoy outdoor living with a covered patio and fenced backyard.
Key facts
- Double vanity
- Walk-in closet
- Gas fireplace
Tags
Property features AI
Finance
- Other: Subdivision: Oak Chase; Directions available
- HOA & community: Homeowners association with an annual fee of $225 (about $18.75/month)
Exterior
- Parking: Attached garage; 2-car garage; Concrete driveway; Garage door opener
- Utilities: Cable available; Sewer connected
- Home design: Single-family residence; One level
- Construction: Concrete and stucco exterior; Composition shingle roof
- Exterior features: Covered patio; Deck; Patio; Rain gutters; Wood fencing; Paved road access
Interior
- Kitchen: Dishwasher; Electric oven; Electric range; Microwave; Granite counters; Pantry
- Flooring: Hardwood
- Bathrooms: 2 full bathrooms
- Heating & cooling: Natural gas heating; Electric cooling; Ceiling fans
- Interior features: Ceiling fans; Granite counters; Pantry; Walk-in closets; Plantation shutters; Gas-log fireplace in the living room
- Laundry & utility: Main level laundry room; Gas water heater
Neighborhood map
What this means for you Summary
Snapshot
- This is a 4-bed/3.0-bath single-family listed at $430k.
Deal economics
- At list price, monthly cash flow is $164 ($2k/yr) — positive.
- The deal already cash-flows at list — no discount required.
- To meet the 1% rule (rent ≥ 1% of price), the offer needs to be $346k (19.6% below list).
- Recommended offer: $346k (19.6% below list) — sets the bar for 1% rule.
- Cap rate 6.8% vs local median 3.4% in Tuscaloosa — top-decile yield for the area; either an underpriced asset or a hidden risk that comps aren't pricing in. Stress-test before assuming the spread holds.
Location & tenants
- Location reads 77/100 on livability (#9 in AL, #2,909 nationally) — a middle-class / working-renter tenant base. Strengths: amenities A+, health & safety A+, cost of living A; Watch: crime F, employment D-.
- Tuscaloosa City (urban): math 19% / reading 40% proficiency, ranked #74 of 129 in AL (top 57%) — low school quality limits family demand, transient renter base, plan for 1-2y turnover.
- Zoned schools: Rock Quarry Elementary School (math 68% / reading 85%, grade A, #12 of 627 statewide, top 2%, 605 students, 13% FRL); Northridge Middle School (math 29% / reading 57%, grade D-, #48 of 257 statewide, top 19%, 740 students, 39% FRL); Northridge High School (math 40% / reading 42%, grade F, #31 of 305 statewide, top 10%, 1,145 students, 35% FRL) — zoned schools average 29% FRL vs 59% district-wide (30 pts lower); this property's tenant base skews higher-income than the district average.
- Zoned-school proficiency averages 54% at this address vs 30% district-wide (+24 pts) — the actual schools serving this property are materially stronger than the Tuscaloosa City average implies; a family-tenant draw the district grade alone would hide.
- Market conditions: 267 active listings in the ZIP; 2 comparable units currently listed for rent nearby; high-income renter base; 622 units permitted in Tuscaloosa County in 2024 (69 in 5+ unit buildings).
- This rent runs 35% of the median local income ($119k/yr) — at the standard rent-burdened threshold; future hikes will face affordability resistance.
Forward outlook
- Local home prices are declining (-3.0%/yr); year-one equity from $3k of loan paydown is wiped out by about $13k of value loss. Plan a longer hold.
- Tuscaloosa County population projected at +26% by 2050 — long-run rental-demand tailwind backs the buy-and-hold thesis.
Negotiation context
- Only 13 days on market — expect competitive offers; lowballing is unlikely to land.
- 3 sale attempts since 6y ago with the ask held roughly flat each time — persistent listings suggest the price (not the market) is what's stuck; bring a comps-based counter.
- Current owner paid $335k; 28% above their basis — modest negotiation headroom, anchor on the comps not their cost.
Risks & watch-outs
- Climate carrying-cost: major wind risk, 59% chance of damaging wind over 30y; extreme-heat days projected 7→20/yr by 2055 (HVAC capex compounding) — expect insurance premiums to compound above CPI over the hold.
Questions for the listing agent
- What does the HOA fee cover, when was the last increase, and are there any pending special assessments or reserve-fund shortfalls?
- Is there a deadline driving the sale (1031 exchange, divorce, estate, relocation)? That informs how much negotiation room exists.
- Crime grade is F in this area — have there been break-ins, vandalism, or insurance claims at this property in the last 3 years? What carrier currently insures it and at what premium?
- The area grade is low — what's the realistic commute time and amenity access for the typical tenant pool here? Any planned neighborhood developments (good or bad) we should know about?
- What's the average days-on-market for RENTAL listings here right now (not sales)? A rising rental-DOM trend means longer vacancies and softer asking-rent achievability than the comps imply.
- What's the recent tenant-quality profile in this submarket — average credit score on applications, eviction rate, late-payment / NSF rate, and stable-employment percentage? A property-management company in the area should have these aggregated.
- How much new for-sale + rental construction is in the pipeline within 1–3 miles? Heavy new supply typically softens prices + rents 12–24 months out; constrained supply supports both.
Investment metrics
- 1% rule
- 0.80% ✗
- Cap rate
- 6.75%
- Cash-on-cash
- 1.63%
- DSCR
- 1.07
- GRM
- 10.4
CMA / ARV
- ARV (on-the-fly)
- $359,484
- Comps found
- 7
Show comp detail 7 sales within ~0.75 mi
| Address | Dist | Beds/Ba | Sqft | Sold | Price | $/sf | Match |
|---|---|---|---|---|---|---|---|
| 5622 New Watermelon Road Rd | 0.08mi | 3/2.0 (-1) | 1,854 (-10%) | 4mo | $265,000 | $143 | 67 |
| 3610 Sierra Dr | 0.19mi | 3/2.0 (-1) | 1,876 (-9%) | 3mo | $359,900 | $192 | 64 |
| 6011 Lakeridge Ave | 0.25mi | 3/2.5 (-1) | 2,277 (+10%) | 16mo | $349,900 | $154 | 51 |
| 3808 64th St NE | 0.58mi | 3/2.0 (-1) | 2,185 (+6%) | 17mo | $319,250 | $146 | 40 |
| 3922 Whirlaway Dr | 0.47mi | 3/2.0 (-1) | 1,808 (-12%) | 11mo | $395,000 | $218 | 39 |
| 3616 Northridge Cir | 0.67mi | 3/2.0 (-1) | 1,953 (-6%) | 24mo | $340,000 | $174 | 31 |
| 3658 Northridge Cir | 0.66mi | 3/2.0 (-1) | 1,787 (-14%) | 18mo | $325,000 | $182 | 22 |
Match score weights: distance 35% · size 25% · config 20% · recency 20%. Top-matched comps best support the ARV.
Projected returns pro-forma
-3.0% appreciation · 3.0% rent growth · sell at horizon
- IRR
- -13.8%
- Equity multiple
- 0.51×
- Total profit
- $-59,417
- Equity at exit
- $64,099
- IRR
- -5.0%
- Equity multiple
- 0.68×
- Total profit
- $-39,091
- Equity at exit
- $37,170
Cash invested: $120,372 (down + closing). Projections, not guarantees.
Landlord ↔ Tenant lean methodology
- Overall (STATE)
- 90 Strongly Landlord-Friendly
- State Alabama
- 90 Strongly Landlord-Friendly · R+15
- County
- — inherits STATE
- City
- — inherits STATE
ZIP-level market 35406
- Home prices YoY
- -26.7%
- Active inventory
- 267
- Price-to-rent
- 10.4×
Monthly cashflow live
- Estimated rent
- $3,457 medium interval (Pro) →
- Mortgage (P&I)
- −$2,254
- Tax from tax record
- −$115 /mo · $1,377/yr
- Insurance
- −$179
- HOA
- −$19
- Vacancy / Maint / Mgmt
- −$726
- Net cashflow
- $164
Break-even live
Sensitivity live
| Price | -10% $407 | -5% $286 | +0% $164 | +5% $42 | +10% $-79 |
|---|---|---|---|---|---|
| Rent | -10% $-109 | -5% $27 | +0% $164 | +5% $300 | +10% $437 |
| Rate | -1.0pp $380 | -0.5pp $273 | base $164 | +0.5pp $53 | +1.0pp $-61 |
UW: 25.0% down · 7.5% · 30yr · 1.5% tax · 5.0% vac · 8.0% maint · 8.0% mgmt
Financing live
Cash to close
- Down payment
- $107,475
- Closing costs
- $12,897
- Reserves months
- —
- Total cash needed
- —
Loan-product check · same deal, 3 products live
Conventional
25% down · 7.5% · 30yr
- Down + closing
- —
- Monthly P&I
- —
- Monthly cashflow
- —
- DSCR
- —
- Eligible?
- —
Personal DTI + credit; lowest rate.
DSCR
20% down · 8.5% · 30yr
- Down + closing
- —
- Monthly P&I
- —
- Monthly cashflow
- —
- DSCR
- —
- Eligible?
- —
No personal income docs; deal must DSCR.
Hard money
10% down · 12.0% · 12mo
- Down + closing
- —
- Monthly P&I
- —
- Monthly cashflow
- —
- DSCR
- —
- Eligible?
- —
Short-term bridge; refi at stabilization.
Rent comps 2 comps
| Address | Beds | Baths | Sqft | Rent | $/sqft | DOM | Units | Dist |
|---|---|---|---|---|---|---|---|---|
| 1761 Commons North Loop Tuscaloosa, AL | 1.0–3.0 | 1.0–2.0 | 1154 | $4,912 | $4.25 | 15d | 13 | 1.19mi |
| 7629 River Ridge Rd NE Tuscaloosa, AL | 3.0 | 2.5 | 2435 | $3,400 | $1.40 | 15d | 1 | 1.34mi |
HOA detail
- Monthly dues
- $19 · $228/yr
- Likely covers
- pool
Listing history 10 events
-
2026-06-21days on market $429,900 Active 13 DOM
-
2026-06-18days on market $429,900 Active 10 DOM
-
2026-06-17days on market $429,900 Active 9 DOM
-
2026-06-16days on market $429,900 Active 8 DOM
-
2026-06-15days on market $429,900 Active 7 DOM
-
2026-06-14days on market $429,900 Active 5 DOM
-
2026-06-13days on market $429,900 Active 4 DOM
-
2026-06-10days on market $429,900 Active 2 DOM
-
2026-06-09remarks 699-char remark
-
2026-06-09$429,900 Active 1 DOM
ⓘ Source: listings_history table (triggers on properties + properties_extension) + one-shot
backfill from property_details.listing_events for pre-trigger history.
Tax reassessment forecast AL · Resets to sale price
- Current annual tax
- $1,377 · $115/mo
- Projected year-2 tax
- $1,763 · $147/mo
- Expected delta
- +$385/yr (+$32/mo · 28.0%)
ⓘ Screening estimate from a state-policy table — verify with the county assessor before closing.
Climate risk First Street
- Flood 1/10 Low FEMA zone X (unshaded) · 0% chance over 30 yrs
- Wildfire 4/10 Moderate
- Heat 7/10 Severe 7 d/yr ≥108°F today · 20 d/yr by 30 yrs out
- Wind 6/10 Major 59% chance of damaging wind over 30 yrs
- Air quality 3/10 Moderate 3 unhealthy d/yr today · 3 by 30 yrs out
Nearby sold comps map
Loading sold comps map…
Walkable amenities ~0.75 mi
Loading nearby amenities…
Taxation est. · year 1
- Rental income
- $41,488
- − Mortgage interest
- −$24,081
- − Property taxes
- −$1,377
- − Insurance
- −$2,150
- − Repairs & maintenance
- −$3,319
- − Management
- −$3,319
- − HOA
- −$228
- − Depreciation
- −$12,506
- Taxable loss
- −$5,492
- Est. tax savings @ 24.0%
- +$1,318
- After-tax cash flow
- $3,285/yr
For passive investors: Depreciation is non-cash, so a rental often shows a tax loss while cash-flowing — sheltering income. Rental losses are passive: they offset passive income freely, and up to $25,000/yr can offset ordinary (W-2) income if you actively participate and your MAGI is under $100k (phasing out to $0 by $150k); unused losses carry forward. On sale, claimed depreciation is recaptured at up to 25%, and gains may owe capital-gains tax (a 1031 exchange can defer both). Figures are a year-1 estimate at your 24.0% rate — not tax advice; consult a CPA.
Schools (NCES district)
- District
- Tuscaloosa City
- NCES district ID
- 0103360
- Math proficiency
- 19% ▼ -24.00%
- Reading proficiency
- 40% ▼ -1.00%
- Median HH income
- $37,474
- Composite
- 24.51/100
- National rank
- #7647
- State rank
- #74 of 129 in AL
Livability — Tuscaloosa
- Score
- 77/100
- State rank
- #9
- US rank
- #2909
Category grades
Schools grade is shown separately in the Schools card above.
Census & demographics
- Census place
- Tuscaloosa, AL
- County
- Tuscaloosa County · 206,491 people
- City population
- 134,228
- Metro
- Tuscaloosa, AL
- Population (ZIP)
- 18,904
- Household income
- $119,250
- Rent vs Own
- Severe rent burden
- 415.0
Population outlook (Tuscaloosa County) Hauer SSP2
- Today (2025)
- 228,293 people
- By 2030
- 240,551 · +5.4%
- By 2040
- 263,856 · +15.6%
- By 2050
- 286,491 · +25.5%
- By 2075
- 335,783 · +47.1%
- By 2100
- 370,520 · +62.3%
Race, ethnicity, and origin ACS 2023
- Neighborhood character
- Predominantly White (83%)
- Race & ethnicity
- White 83% Asian 6% Hispanic / Latino 6% Two or more races 5% Black 4%
- Hispanic origin (detail)
- Mexican 4%
- Common ancestry
- Italian 4% Slovak 4% Lithuanian 3%
- Foreign-born
- 10% · Canada, China
- Languages at home
- 89% English-only · Spanish 5% Chinese 3% Other Indo-European 2%
Political lean MEDSL · Tuscaloosa
- 2024 margin
- Strong R (+20.4) · D 39.4% · R 59.8%
- 2008→2024 swing
- -4.4pp toward R · 2008: -16.0pp · 2024: -20.4pp
- All cycles
- 2024: R+20.4 2020: R+14.8 2016: R+19.5 2012: R+17.4 2008: R+16.0
Not yet ingested
- Civics
- —
Market trends
- HPI YoY
- ▼ -80.51%
- Current HPI
- 221.088
- Rent YoY
- —
- Metro
- Tuscaloosa, AL
- State GDP YoY
- ▲ 2.94%
- F500 in state
- 4
Industry mix (Fortune 500 HQ in AL)
| Industry | F500 HQs | Revenue |
|---|---|---|
| Financial Services | 1 | $8B |
|
||
| Healthcare | 1 | $5B |
|
||
Price history
+75.5% since first listed13 events — show timeline
- 2026-06-08 Listed $429,900 WAMLS
- 2023-06-08 Sold (Public Records) $335,000 Public Records
- 2023-06-01 Sold (MLS) $335,000 WAMLS
- 2023-04-28 Pending — WAMLS
- 2023-04-24 Price Changed $349,900 WAMLS
- 2023-03-03 Price Changed $359,900 WAMLS
- 2023-02-19 Price Changed $369,900 WAMLS
- 2023-02-09 Price Changed $379,900 WAMLS
- 2023-02-01 Listed $389,900 WAMLS
- 2021-02-01 Sold (Public Records) $315,000 Public Records
- 2021-01-28 Sold (MLS) $315,000 WAMLS
- 2020-12-23 Listed $315,000 WAMLS
- 2007-08-31 Sold (Public Records) $245,000 Public Records
Property tax history
+3.2%/yrLatest (2025): $1,377 · +7.2% YoY. Source: county tax records.
Cash-flow waterfall
monthlySold comps — $/sqft
last 12 mo · ≤1 miLoading sold comps…