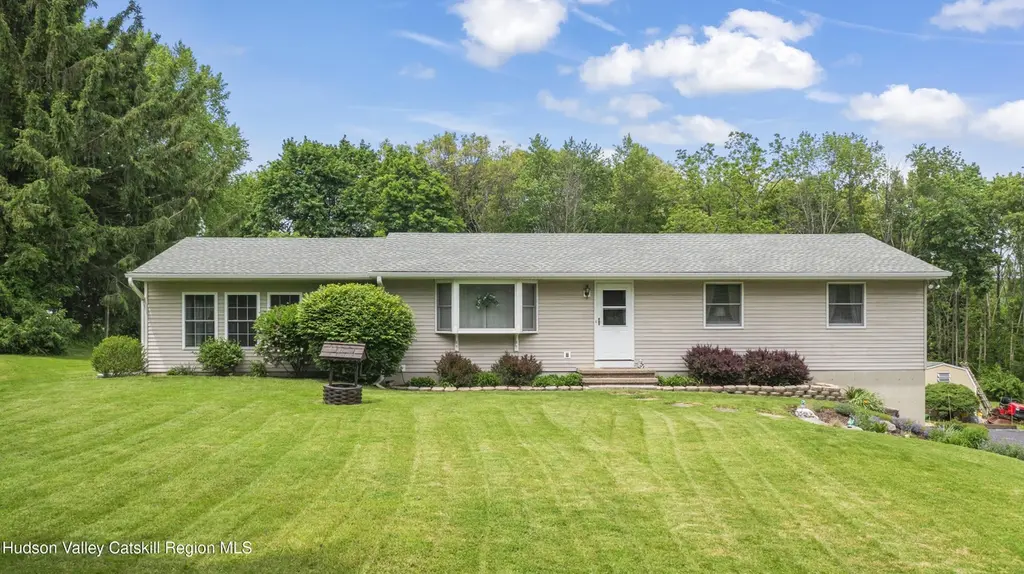
19 Viewmont Rd · Taconic Shores, NY
Flood risk 1/10 · Minimal
- FEMA flood zone
- X
- Chance of flooding over 30 yrs
- 0.0%
- Est. flood insurance / yr
- $473 – $860
Fire risk 5/10 · Moderate
- Est. fire insurance / yr
- $691 – $1,283
Heat risk 3/10 · Minor
- Hot days now (above 95°F)
- 7 days/yr
- Hot days in 30 yrs
- 17 days/yr
Wind risk 4/10 · Minor
- Chance of severe wind over 30 yrs
- 14.0%
Air-quality risk 2/10 · Minimal
- Unhealthy air days now
- 1 days/yr
- Unhealthy air days in 30 yrs
- 2 days/yr
Risk factors via First Street. Map © Google.
Why this score? — see what drove the A grade
The composite is a weighted blend of 9 inputs, each scored 0–100. Each bar is that input's sub-score; the figure is the points it added to the 100-point composite (weight × sub-score).
- Cash flow +30.0/30.0
- ARV discount +15.0/15.0
- DSCR +10.0/10.0
- Appreciation +10.0/10.0
- 1% rule +8.7/10.0
- Schools +4.5/10.0
- Condition / age +3.8/5.0
- Livability +3.5/5.0
- Rent growth +2.5/5.0
$450,000
🖨 Deal sheet 📄 Offer letter ✓ Due diligence
Listing remarks
One level living in this 1,592 sq ft home that could be offered 'turn-key'. 3 bedrooms and 1.5 bathrooms. The open kitchen, living, and dining areas create an easy flow for everyday living and entertaining. Attached is the bright and airy 440 sq ft three-season room, which offers the perfect spot to watch nesting birds and enjoy the surrounding landscape. A stone wall marks the rear of the property. Additional features include a deck, lush lawn, mature plantings, shed and a one-car garage in the basement level. Located on a cul-de-sac that is maintained by the town of Copake, the home includes Andersen double-hung and crank-out windows, a bay window, and a mix of ceramic tile, parquet, and
Key facts
- Stone wall
- Three season room
- Deck
Tags
Property features AI
Exterior
- Parking: Attached garage (heated); 1 garage space; Paved driveway, outside parking available; Basement access to parking
- Utilities: Private well water; Septic tank; 200+ amp electric service; Cable available and connected; Electricity connected; Phone connected; Water connected; Sewer connected
- Home design: Single-family house; Residential property; Has a view
- Construction: Asphalt shingle roof; Concrete perimeter foundation
- Exterior features: Private yard; Few trees in front yard; Stone fencing; Shed(s)
Interior
- Kitchen: Range; Range hood; Microwave; Refrigerator; Freezer; Dishwasher
- Bedrooms: Master bedroom on the main level
- Flooring: Carpet; Ceramic tile; Parquet
- Bathrooms: 1 full bathroom; 1 half bathroom
- Heating & cooling: Electric baseboard heating; Wall/window air conditioning units
- Interior features: Master bedroom on the main level; Bay windows
- Laundry & utility: Washer; Dryer; Laundry in basement; Full unfinished basement with storage and walk-out/walk-up access
Neighborhood map
What this means for you Summary
Snapshot
- This is a 3-bed/1.5-bath single-family listed at $450k. Condition is rated good.
Deal economics
- At list price, monthly cash flow is $2k ($21k/yr) — positive.
- The deal already cash-flows at list — no discount required.
- Meets the 1% rule at list price ($6k rent vs $450k).
- Recommended offer: $443k (1.5% below list) — sets the bar for market timing.
Location & tenants
- Location reads 69/100 on livability (#485 in NY) — a middle-class / working-renter tenant base. Strengths: employment A+, housing A, crime B; Watch: cost of living C-, schools D, amenities F.
- Taconic Hills Central School District (rural): math 53% / reading 51% proficiency, ranked #335 of 590 in NY (top 57%) — acceptable for families but not a draw, mixed tenant base, ~2y average lease.
- Market conditions: 42 active listings in the ZIP; 136 units permitted in Columbia County in 2024 (0 in 5+ unit buildings).
Forward outlook
- In year one you build about $48k of equity ($3k loan paydown + $45k appreciation (10.0% local appreciation)).
- Columbia County population projected at -22% by 2050 — secular population decline; favor cash flow + early exit over multi-decade hold.
- At projected returns (10.0% appreciation + 3.0% rent growth), your $126k cash investment doubles in ~2 years — after that, you're playing with house money.
- By year 2, paydown + projected appreciation supports a ~$77k cash-out refi (75% LTV) — recoverable capital for the next deal without selling this one.
Negotiation context
- It's been on market 21 days — a 2% lower offer ($443k) is reasonable based on typical stale-listing flexibility.
Risks & watch-outs
- Climate carrying-cost: moderate wildfire risk — expect insurance premiums to compound above CPI over the hold.
Questions for the listing agent
- Built in 1973 — when were the roof, HVAC, electrical panel, plumbing, and water heater last replaced?
- Is there a deadline driving the sale (1031 exchange, divorce, estate, relocation)? That informs how much negotiation room exists.
- Schools are D-rated, which usually means shorter tenancies and higher turnover. Who's the typical renter profile here, and what's been the actual vacancy rate?
- What's the average days-on-market for RENTAL listings here right now (not sales)? A rising rental-DOM trend means longer vacancies and softer asking-rent achievability than the comps imply.
- What's the recent tenant-quality profile in this submarket — average credit score on applications, eviction rate, late-payment / NSF rate, and stable-employment percentage? A property-management company in the area should have these aggregated.
- How much new for-sale + rental construction is in the pipeline within 1–3 miles? Heavy new supply typically softens prices + rents 12–24 months out; constrained supply supports both.
Investment metrics
- 1% rule
- 1.37% ✓
- Cap rate
- 10.95%
- Cash-on-cash
- 16.62%
- DSCR
- 1.74
- GRM
- 6.1
CMA / ARV
- ARV (on-the-fly)
- $582,672
- Comps found
- 8
Show comp detail 8 sales within ~0.75 mi
| Address | Dist | Beds/Ba | Sqft | Sold | Price | $/sf | Match |
|---|---|---|---|---|---|---|---|
| 720 Center Hill Rd | 0.05mi | 3/2.0 | 1,588 (-0%) | 23mo | $775,000 | $488 | 76 |
| 8 Fairview Dr | 0.16mi | 3/1.5 | 1,762 (+11%) | 0mo | $349,000 | $198 | 74 |
| 1250 Lake View Rd | 0.44mi | 3/2.0 | 1,584 (-0%) | 18mo | $580,000 | $366 | 62 |
| 1174 Lakeview Rd | 0.24mi | 3/2.5 | 1,766 (+11%) | 6mo | $575,000 | $326 | 62 |
| 1256 Lakeview Rd | 0.45mi | 3/2.0 | 1,468 (-8%) | 5mo | $640,000 | $436 | 59 |
| 3 Island Dr | 0.74mi | 3/1.5 | 1,559 (-2%) | 12mo | $495,000 | $318 | 51 |
| 1024 Lakeview Rd | 0.52mi | 3/3.0 | 1,704 (+7%) | 8mo | $700,000 | $411 | 51 |
| 1264 Lakeview Rd | 0.47mi | 3/— | 1,792 (+13%) | 19mo | $475,000 | $265 | 41 |
Match score weights: distance 35% · size 25% · config 20% · recency 20%. Top-matched comps best support the ARV.
Projected returns pro-forma
10.0% appreciation · 3.0% rent growth · sell at horizon
- IRR
- 36.6%
- Equity multiple
- 3.83×
- Total profit
- $356,309
- Equity at exit
- $405,396
- IRR
- 31.5%
- Equity multiple
- 8.64×
- Total profit
- $962,060
- Equity at exit
- $874,251
Cash invested: $126,000 (down + closing). Projections, not guarantees.
Landlord ↔ Tenant lean methodology
- Overall (STATE)
- 15 Strongly Tenant-Friendly
- State New York
- 15 Strongly Tenant-Friendly · D+10
- County
- — inherits STATE
- City
- — inherits STATE
ZIP-level market 12521
- Home prices YoY
- 23.4%
- Active inventory
- 42
- Price-to-rent
- 6.1×
Monthly cashflow live
- Estimated rent
- $6,145 medium interval (Pro) →
- Mortgage (P&I)
- −$2,360
- Tax est. 1.5%
- −$562 /mo · $6,750/yr
- Insurance
- −$188
- HOA
- −$0
- Vacancy / Maint / Mgmt
- −$1,291
- Net cashflow
- $1,745
Break-even live
UW: 25.0% down · 7.5% · 30yr · 1.5% tax · 5.0% vac · 8.0% maint · 8.0% mgmt
Financing live
Cash to close
- Down payment
- $112,500
- Closing costs
- $13,500
- Reserves months
- —
- Total cash needed
- —
Loan-product check · same deal, 3 products live
Conventional
25% down · 7.5% · 30yr
- Down + closing
- —
- Monthly P&I
- —
- Monthly cashflow
- —
- DSCR
- —
- Eligible?
- —
Personal DTI + credit; lowest rate.
DSCR
20% down · 8.5% · 30yr
- Down + closing
- —
- Monthly P&I
- —
- Monthly cashflow
- —
- DSCR
- —
- Eligible?
- —
No personal income docs; deal must DSCR.
Hard money
10% down · 12.0% · 12mo
- Down + closing
- —
- Monthly P&I
- —
- Monthly cashflow
- —
- DSCR
- —
- Eligible?
- —
Short-term bridge; refi at stabilization.
Listing history 16 events
-
2026-06-19days on market $450,000 Active 21 DOM
-
2026-06-18days on market $450,000 Active 20 DOM
-
2026-06-17days on market $450,000 Active 19 DOM
-
2026-06-16days on market $450,000 Active 18 DOM
-
2026-06-15days on market $450,000 Active 17 DOM
-
2026-06-14days on market $450,000 Active 15 DOM
-
2026-06-12days on market $450,000 Active 14 DOM
-
2026-06-09days on market $450,000 Active 11 DOM
-
2026-06-08days on market $450,000 Active 10 DOM
-
2026-06-07days on market $450,000 Active 9 DOM
-
2026-06-07days on market $450,000 Active 8 DOM
-
2026-06-04days on market $450,000 Active 5 DOM
-
2026-06-02days on market $450,000 Active 4 DOM
-
2026-06-01days on market $450,000 Active 3 DOM
-
2026-05-31days on market $450,000 Active 2 DOM
-
2026-05-29$450,000 Active
ⓘ Source: listings_history table (triggers on properties + properties_extension) + one-shot
backfill from property_details.listing_events for pre-trigger history.
Climate risk First Street
- Flood 1/10 Low FEMA zone X · 0% chance over 30 yrs
- Wildfire 5/10 Major
- Heat 3/10 Moderate 7 d/yr ≥95°F today · 17 d/yr by 30 yrs out
- Wind 4/10 Moderate 14% chance of damaging wind over 30 yrs
- Air quality 2/10 Low 1 unhealthy d/yr today · 2 by 30 yrs out
Nearby sold comps map
Loading sold comps map…
Walkable amenities ~0.75 mi
Loading nearby amenities…
Taxation est. · year 1
- Rental income
- $73,743
- − Mortgage interest
- −$25,207
- − Property taxes
- −$6,750
- − Insurance
- −$2,250
- − Repairs & maintenance
- −$5,899
- − Management
- −$5,899
- − Depreciation
- −$13,091
- Taxable income
- $14,646
- Est. tax owed @ 24.0%
- −$3,515
- After-tax cash flow
- $17,424/yr
For passive investors: Depreciation is non-cash, so a rental often shows a tax loss while cash-flowing — sheltering income. Rental losses are passive: they offset passive income freely, and up to $25,000/yr can offset ordinary (W-2) income if you actively participate and your MAGI is under $100k (phasing out to $0 by $150k); unused losses carry forward. On sale, claimed depreciation is recaptured at up to 25%, and gains may owe capital-gains tax (a 1031 exchange can defer both). Figures are a year-1 estimate at your 24.0% rate — not tax advice; consult a CPA.
Condition & rehab AI · 13 photos
This single-family home is in good condition with minimal repairs needed. It offers a good balance of curb appeal and interior comfort, making it a solid investment.
Value-add opportunities
- Both Paint exterior — Enhances curb appeal and value
- Both Clean carpets — Improves comfort and value
- Both Replace window treatments — Freshens look and improves energy efficiency
Renovation cost estimate screening
Value-add ROI direction
- Both Paint exterior — Enhances curb appeal and value ↑
- Both Clean carpets — Improves comfort and value ↑
- Both Replace window treatments — Freshens look and improves energy efficiency ↑
ⓘ Cost ranges are severity-bucket heuristics (US national rule-of-thumb). Get contractor quotes + a written scope before underwriting a rehab budget.
Schools (NCES district)
- District
- Taconic Hills Central School District
- NCES district ID
- 3628620
- Math proficiency
- 53% ▲ 10.00%
- Reading proficiency
- 51% ▲ 11.00%
- Median HH income
- $57,329
- Composite
- 45.16/100
- National rank
- #2676
- State rank
- #335 of 590 in NY
Livability — Taconic Shores
- Score
- 69/100
- State rank
- #485
- US rank
- #8556
Category grades
Schools grade is shown separately in the Schools card above.
Census & demographics
- Census place
- Taconic Shores, NY
- Population (ZIP)
- 1,874
Population outlook (Columbia County) Hauer SSP2
- Today (2025)
- 58,662 people
- By 2030
- 56,557 · -3.6%
- By 2040
- 51,324 · -12.5%
- By 2050
- 45,790 · -21.9%
- By 2075
- 35,232 · -39.9%
- By 2100
- 25,846 · -55.9%
Race, ethnicity, and origin ACS 2023
- Neighborhood character
- Predominantly White (81%)
- Race & ethnicity
- White 81% Two or more races 11% Hispanic / Latino 7% Black 1%
- Hispanic origin (detail)
- Mexican 1% Cuban 2%
- Common ancestry
- Romanian 3% Scotch-Irish 3% Slovak 2%
- Foreign-born
- 4% · Canada, Jamaica
- Languages at home
- 90% English-only · Spanish 8% Russian/Polish/Slavic 1% Other Indo-European 1%
Political lean MEDSL · Columbia
- 2024 margin
- D (+14.7) · D 57.4% · R 42.6%
- 2008→2024 swing
- +1.3pp toward D · 2008: 13.4pp · 2024: 14.7pp
- All cycles
- 2024: D+14.7 2020: D+16.7 2016: D+1.4 2012: D+11.7 2008: D+13.4
Not yet ingested
- Civics
- —
Market trends
- HPI YoY
- ▲ 83.58%
- Current HPI
- 441.0272
- Rent YoY
- —
- Metro
- —
- State GDP YoY
- ▲ 2.60%
- F500 in state
- 92
Industry mix (Fortune 500 HQ in NY)
| Industry | F500 HQs | Revenue |
|---|---|---|
| Financial Services | 10 | $950B |
|
||
| Consumer Goods | 9 | $162B |
|
||
| Insurance | 4 | $225B |
|
||
| Telecommunications | 2 | $144B |
|
||
| Pharmaceuticals | 2 | $112B |
|
||
| Media / Entertainment | 2 | $69B |
|
||
Price history
1 event — show timeline
- 2026-05-29 Listed $450,000 HVCRMLS
Cash-flow waterfall
monthlySold comps — $/sqft
last 12 mo · ≤1 miLoading sold comps…