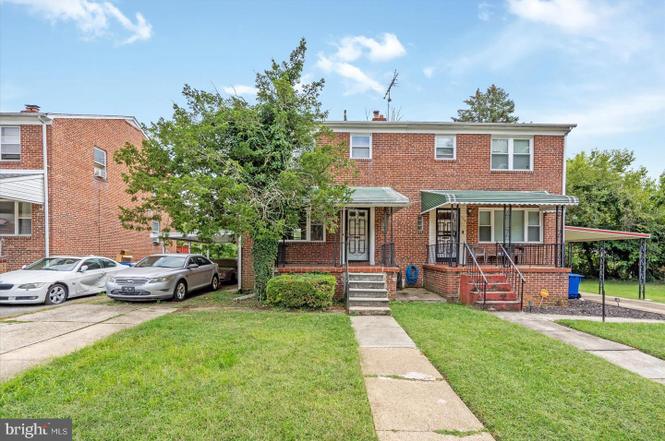
3707 Howard Park Ave · Baltimore, MD
Flood risk 1/10 · Minimal
- FEMA flood zone
- X (unshaded)
- Chance of flooding over 30 yrs
- 0.0%
- Est. flood insurance / yr
- $473 – $860
Fire risk 1/10 · Minimal
- Est. fire insurance / yr
- $755 – $1,403
Heat risk 6/10 · Moderate
- Hot days now (above 103°F)
- 7 days/yr
- Hot days in 30 yrs
- 15 days/yr
Wind risk 5/10 · Moderate
- Chance of severe wind over 30 yrs
- 23.0%
Air-quality risk 3/10 · Minor
- Unhealthy air days now
- 3 days/yr
- Unhealthy air days in 30 yrs
- 4 days/yr
Risk factors via First Street. Map © Google.
Why this score? — see what drove the C+ grade
The composite is a weighted blend of 9 inputs, each scored 0–100. Each bar is that input's sub-score; the figure is the points it added to the 100-point composite (weight × sub-score).
- Cash flow +17.6/30.0
- ARV discount +15.0/15.0
- Appreciation +9.8/10.0
- DSCR +5.5/10.0
- 1% rule +4.9/10.0
- Rent growth +3.8/5.0
- Livability +3.8/5.0
- Condition / age +2.5/5.0
- Schools +1.0/10.0
$192,000
🖨 Deal sheet 📄 Offer letter ✓ Due diligence
Listing remarks
Discover a charming investment opportunity in the heart of Gwynn Oak! This delightful 3-bedroom, 1.2-bathroom Colonial twin home, built in 1953, offers a perfect blend of classic character and modern potential. With 1,677 finished square feet, the finished basement provides ample space for additional rooms or recreational areas, enhancing rental appeal. The property features a cozy layout with a welcoming atmosphere, ideal for attracting long-term tenants. Enjoy the convenience of an attached carport and driveway parking, ensuring easy access for residents. The manageable lot size of 0.04 acres allows for low maintenance while still providing outdoor space. Investors will appreciate the pot
Key facts
- Attached carport
- Finished basement
- Manageable lot size
Tags
Property features AI
Finance
- Other: Ownership is fee simple
Exterior
- Parking: Attached carport for 2 vehicles; Driveway and off-street parking; Total of 2 garage/parking spaces
- Utilities: Public water; Public sewer; Natural gas service
- Home design: Semi-detached home; Brick construction
- Construction: Brick/Mortar foundation; Built-up roof
- Exterior features: Tidal water not present
Interior
- Bedrooms: Three bedrooms on the first upper level
- Bathrooms: Two full bathrooms (one on first upper level, one on lower level); One half bathroom on the main level
- Heating & cooling: 90% forced air heating and radiator heat; Natural gas heating and hot water; Central air conditioning (central A/C) with natural gas cooling fuel
- Interior features: Partially finished basement with outside and rear entrances; Basement has space for additional rooms and a sump pump; 6 total rooms
Neighborhood map
What this means for you Summary
Snapshot
- This is a 3-bed/1.5-bath townhouse listed at $192k.
Deal economics
- At list price, monthly cash flow is $153 ($2k/yr) — positive.
- The deal already cash-flows at list — no discount required.
- To meet the 1% rule (rent ≥ 1% of price), the offer needs to be $190k (1.2% below list).
- Recommended offer: $169k (12.0% below list) — sets the bar for market timing.
- Cap rate 7.2% vs local median 6.0% in Baltimore — meaningfully above typical; check what's discounted (condition, days-on-market, listing class) to confirm the premium yield is real.
Location & tenants
- Location reads 76/100 on livability (#90 in MD, #3,396 nationally) — a middle-class / working-renter tenant base. Strengths: amenities A+, commute A+, housing A+; Watch: schools D, crime F.
- Baltimore City Public Schools (urban): math 7% / reading 16% proficiency, ranked #24 of 24 in MD (top 100%) — low school quality limits family demand, transient renter base, plan for 1-2y turnover; 79% free/reduced lunch — lower-income household profile, screen leases tightly.
- Market conditions: Rents rising fast (+5.2%/yr); 126 active listings in the ZIP; 14 comparable units currently listed for rent nearby; rentals lingering (median 44d on market — plan ~5-8 weeks vacancy on turnover, expect pricing pressure); 50% of comp listings sitting > 30 days — soft ceiling on asking rent; 1,273 units permitted in Baltimore city in 2024 (1,104 in 5+ unit buildings).
Forward outlook
- In year one you build about $20k of equity ($1k loan paydown + $18k appreciation (9.5% local appreciation)).
- Baltimore County population projected to shrink 4% by 2050 — rents likely to lag national; underwrite the cash flow, not the appreciation.
- At projected returns (9.5% appreciation + 5.2% rent growth), your $54k cash investment doubles in ~3 years — after that, you're playing with house money.
- By year 2, paydown + projected appreciation supports a ~$31k cash-out refi (75% LTV) — recoverable capital for the next deal without selling this one.
Negotiation context
- It's been on market 157 days — a 12% lower offer ($169k) is reasonable based on typical stale-listing flexibility.
- 8 sale attempts since 26y ago with the ask held roughly flat each time — persistent listings suggest the price (not the market) is what's stuck; bring a comps-based counter.
- Current owner paid $88k; list at $192k implies a 118% gain — meaningful room to come down on a strong offer.
Risks & watch-outs
- Watch-outs: built in 1953 — expect roof / HVAC / electrical / plumbing capex.
- Climate carrying-cost: moderate wind risk, 23% chance of damaging wind over 30y; extreme-heat days projected 7→15/yr by 2055 (HVAC capex compounding) — expect insurance premiums to compound above CPI over the hold.
Questions for the listing agent
- It's been on market 157 days. Have you received any prior offers? Is the seller open to a 12% concession, seller financing, or rate buy-down credit?
- Built in 1953 — when were the roof, HVAC, electrical panel, plumbing, and water heater last replaced?
- Why hasn't it sold? Are there any deal-killer items the seller is aware of (foundation, flood, title, zoning, code violations)?
- Is there a deadline driving the sale (1031 exchange, divorce, estate, relocation)? That informs how much negotiation room exists.
- Schools are D-rated, which usually means shorter tenancies and higher turnover. Who's the typical renter profile here, and what's been the actual vacancy rate?
- Crime grade is F in this area — have there been break-ins, vandalism, or insurance claims at this property in the last 3 years? What carrier currently insures it and at what premium?
- What's the average days-on-market for RENTAL listings here right now (not sales)? A rising rental-DOM trend means longer vacancies and softer asking-rent achievability than the comps imply.
- What's the recent tenant-quality profile in this submarket — average credit score on applications, eviction rate, late-payment / NSF rate, and stable-employment percentage? A property-management company in the area should have these aggregated.
- How much new for-sale + rental construction is in the pipeline within 1–3 miles? Heavy new supply typically softens prices + rents 12–24 months out; constrained supply supports both.
Investment metrics
- 1% rule
- 0.99% ✗
- Cap rate
- 7.25%
- Cash-on-cash
- 3.40%
- DSCR
- 1.15
- GRM
- 8.4
CMA / ARV
- ARV (on-the-fly)
- $244,842
- Comps found
- 12
Show comp detail 12 sales within ~0.75 mi
| Address | Dist | Beds/Ba | Sqft | Sold | Price | $/sf | Match |
|---|---|---|---|---|---|---|---|
| 3716 Howard Park Ave | 0.04mi | 3/2.0 | 1,677 (0%) | 13mo | $205,000 | $122 | 85 |
| 4411 Belvieu Ave | 0.35mi | 4/2.0 (+1) | 1,696 (+1%) | 4mo | $190,000 | $112 | 72 |
| 4703 Post Rd | 0.35mi | 4/2.5 (+1) | 1,600 (-5%) | 9mo | $275,000 | $172 | 60 |
| 4805 Wilvan Ave | 0.18mi | 3/1.5 | 1,440 (-14%) | 14mo | $152,000 | $106 | 56 |
| 5310 Haddon Ave | 0.28mi | 4/2.0 (+1) | 1,882 (+12%) | 6mo | $275,000 | $146 | 55 |
| 4402 Haddon Ave | 0.37mi | 4/3.5 (+1) | 1,814 (+8%) | 2mo | $290,000 | $160 | 54 |
| 5528 Belle Ave | 0.39mi | 4/2.0 (+1) | 1,480 (-12%) | 2mo | $268,000 | $181 | 53 |
| 4040 W Cold Spring Ln | 0.58mi | 4/2.0 (+1) | 1,782 (+6%) | 7mo | $205,000 | $115 | 50 |
| 5527 Belle Ave | 0.39mi | 4/2.0 (+1) | 1,440 (-14%) | 6mo | $125,000 | $87 | 46 |
| 4116 1/2 Belle Ave | 0.46mi | 3/1.5 | 1,920 (+14%) | 10mo | $138,000 | $72 | 46 |
| 5554 Elderon Ave | 0.53mi | 3/2.0 | 1,489 (-11%) | 14mo | $228,500 | $153 | 43 |
| 3601 Hicks Ave | 0.58mi | 4/4.0 (+1) | 1,782 (+6%) | 12mo | $287,500 | $161 | 38 |
Match score weights: distance 35% · size 25% · config 20% · recency 20%. Top-matched comps best support the ARV.
Projected returns pro-forma
9.5% appreciation · 5.23% rent growth · sell at horizon
- IRR
- 26.6%
- Equity multiple
- 3.09×
- Total profit
- $112,128
- Equity at exit
- $166,005
- IRR
- 24.1%
- Equity multiple
- 7.15×
- Total profit
- $330,736
- Equity at exit
- $350,835
Cash invested: $53,760 (down + closing). Projections, not guarantees.
Landlord ↔ Tenant lean methodology
- Overall (CITY)
- 12 Strongly Tenant-Friendly
- State Maryland
- 27 Tenant-Leaning · D+14
- County
- — inherits STATE
- City Baltimore
- 12 Strongly Tenant-Friendly · D+58
ZIP-level market 21207
- Home prices YoY
- 1.1%
- Rents YoY
- 5.2%
- Active inventory
- 126
- Price-to-rent
- 8.4×
Monthly cashflow live
- Estimated rent
- $1,897 high interval (Pro) →
- Mortgage (P&I)
- −$1,007
- Tax from tax record
- −$259 /mo · $3,113/yr
- Insurance
- −$80
- HOA
- −$0
- Vacancy / Maint / Mgmt
- −$398
- Net cashflow
- $153
Break-even live
UW: 25.0% down · 7.5% · 30yr · 1.5% tax · 5.0% vac · 8.0% maint · 8.0% mgmt
Financing live
Cash to close
- Down payment
- $48,000
- Closing costs
- $5,760
- Reserves months
- —
- Total cash needed
- —
Loan-product check · same deal, 3 products live
Conventional
25% down · 7.5% · 30yr
- Down + closing
- —
- Monthly P&I
- —
- Monthly cashflow
- —
- DSCR
- —
- Eligible?
- —
Personal DTI + credit; lowest rate.
DSCR
20% down · 8.5% · 30yr
- Down + closing
- —
- Monthly P&I
- —
- Monthly cashflow
- —
- DSCR
- —
- Eligible?
- —
No personal income docs; deal must DSCR.
Hard money
10% down · 12.0% · 12mo
- Down + closing
- —
- Monthly P&I
- —
- Monthly cashflow
- —
- DSCR
- —
- Eligible?
- —
Short-term bridge; refi at stabilization.
Rent comps 14 comps
| Address | Beds | Baths | Sqft | Rent | $/sqft | DOM | Units | Dist |
|---|---|---|---|---|---|---|---|---|
| 3807 Bowers Ave Gwynn Oak, MD | 3.0 | 1.5 | 1152 | $2,200 | $1.91 | 43d | 1 | 0.41mi |
| 4010 Fernhill Ave Unit 2 Baltimore, MD | 2.0 | 1.0 | 1100 | $1,500 | $1.36 | 43d | 1 | 0.60mi |
| 3535 Flannery Ln Gwynn Oak, MD | 3.0 | 1.5 | 1536 | $2,000 | $1.30 | 43d | 1 | 0.80mi |
| 3914 Maine Ave Unit 3 Baltimore, MD | 2.0 | 1.0 | 2127 | $1,150 | $0.54 | 43d | 1 | 0.86mi |
| 5533 Gwynn Oak Ave Fl 1 Gwynn Oak, MD | 2.0 | 1.0 | 1080 | $1,600 | $1.48 | 43d | 1 | 0.89mi |
| 4309 Norfolk Ave Unit 1st Floor Baltimore, MD | 2.0 | 1.0 | 1470 | $1,500 | $1.02 | 11d | 1 | 0.94mi |
| 3784 Columbus Dr Baltimore, MD | 4.0 | 2.0 | 1250 | $2,200 | $1.76 | 23d | 1 | 1.06mi |
| 4998 W Forest Park Ave Baltimore, MD | 3.0 | 1.0–2.0 | 790 | $1,875 | $2.37 | 14d | 15 | 1.08mi |
| 6226 Robin Hill Rd Gwynn Oak, MD | 3.0 | 1.5 | 1140 | $2,850 | $2.50 | 16d | 1 | 1.13mi |
| 3912 Mortimer Ave Baltimore, MD | 3.0 | 2.0 | 1204 | $2,723 | $2.26 | 43d | 1 | 1.16mi |
| 5000 Litchfield Ave #1 Baltimore, MD | 2.0 | 1.0 | 1100 | $1,100 | $1.00 | 43d | 1 | 1.18mi |
| 3508 Grantley Rd Baltimore, MD | 2.0 | 1.0 | 1250 | $1,350 | $1.08 | 23d | 1 | 1.24mi |
| 5807 Gist Ave Baltimore, MD | 2.0 | 1.5 | 2100 | $1,395 | $0.66 | 23d | 1 | 1.27mi |
| 4828 Beaufort Ave Baltimore, MD | 2.0 | 2.5 | 1200 | $1,850 | $1.54 | 23d | 1 | 1.30mi |
Listing history 33 events
-
2026-06-18days on market $192,000 Active 157 DOM
-
2026-06-17days on market $192,000 Active 156 DOM
-
2026-06-16days on market $192,000 Active 155 DOM
-
2026-06-15days on market $192,000 Active 154 DOM
-
2026-06-13days on market $192,000 Active 152 DOM
-
2026-06-09days on market $192,000 Active 148 DOM
-
2026-06-08days on market $192,000 Active 147 DOM
-
2026-06-07pricestatusdays on market $192,000 Active 146 DOM
-
2026-05-01historical Active Under Contract
-
2026-04-20status Active
-
2026-03-23historical Active Under Contract
-
2026-02-24price $179,900
-
2026-02-10status Active
-
2026-01-02historical Active Under Contract
-
2025-12-18status Active
-
2025-12-01historical Active Under Contract
-
2025-11-29status Pending
-
2025-09-12$199,900 Active
-
2025-07-30price $200,000
-
2025-07-30historical
-
2025-07-23status Active
-
2025-06-24historical
-
2025-06-20price $214,900
-
2025-06-20status Active
-
2025-06-17historical
-
2025-06-15price $219,900
-
2025-06-10price $214,900
-
2025-05-31$225,000 Active
-
2001-01-09soldstatus $88,000
-
2001-01-09soldstatus $88,000
-
2000-12-15soldstatus $88,000
-
2000-11-17historical
-
2000-07-18$88,000
ⓘ Source: listings_history table (triggers on properties + properties_extension) + one-shot
backfill from property_details.listing_events for pre-trigger history.
Tax reassessment forecast MD · Partial reset (capped growth)
- Current annual tax
- $3,113 · $259/mo
- Projected year-2 tax
- $3,113 · $259/mo
- Expected delta
- $0/yr ($0/mo · -0.0%)
ⓘ Screening estimate from a state-policy table — verify with the county assessor before closing.
Climate risk First Street
- Flood 1/10 Low FEMA zone X (unshaded) · 0% chance over 30 yrs
- Wildfire 1/10 Low
- Heat 6/10 Major 7 d/yr ≥103°F today · 15 d/yr by 30 yrs out
- Wind 5/10 Major 23% chance of damaging wind over 30 yrs
- Air quality 3/10 Moderate 3 unhealthy d/yr today · 4 by 30 yrs out
Nearby sold comps map
Loading sold comps map…
Walkable amenities ~0.75 mi
Loading nearby amenities…
Taxation est. · year 1
- Rental income
- $22,766
- − Mortgage interest
- −$10,755
- − Property taxes
- −$3,113
- − Insurance
- −$960
- − Repairs & maintenance
- −$1,821
- − Management
- −$1,821
- − Depreciation
- −$5,585
- Taxable loss
- −$1,289
- Est. tax savings @ 24.0%
- +$309
- After-tax cash flow
- $2,140/yr
For passive investors: Depreciation is non-cash, so a rental often shows a tax loss while cash-flowing — sheltering income. Rental losses are passive: they offset passive income freely, and up to $25,000/yr can offset ordinary (W-2) income if you actively participate and your MAGI is under $100k (phasing out to $0 by $150k); unused losses carry forward. On sale, claimed depreciation is recaptured at up to 25%, and gains may owe capital-gains tax (a 1031 exchange can defer both). Figures are a year-1 estimate at your 24.0% rate — not tax advice; consult a CPA.
Schools (NCES district)
- District
- Baltimore City Public Schools
- NCES district ID
- 2400090
- Math proficiency
- 7% ▼ -9.00%
- Reading proficiency
- 16% ▼ -5.00%
- Median HH income
- $42,108
- Composite
- 10.08/100
- National rank
- #9805
- State rank
- #24 of 24 in MD
Livability — Baltimore
- Score
- 76/100
- State rank
- #90
- US rank
- #3396
Category grades
Schools grade is shown separately in the Schools card above.
Census & demographics
- Census place
- Baltimore, MD
- County
- Baltimore County · 769,527 people
- City population
- 588,727
- Metro
- Baltimore-Columbia-Towson, MD
- Population (ZIP)
- 47,099
- Household income
- $67,060
- Rent vs Own
- Severe rent burden
- 2139.0
Population outlook (Baltimore County) Hauer SSP2
- Today (2025)
- 624,249 people
- By 2030
- 621,541 · -0.4%
- By 2040
- 609,756 · -2.3%
- By 2050
- 597,249 · -4.3%
- By 2075
- 552,236 · -11.5%
- By 2100
- 513,934 · -17.7%
Race, ethnicity, and origin ACS 2023
- Neighborhood character
- Predominantly Black (78%)
- Race & ethnicity
- Black 78% White 8% Hispanic / Latino 7% Two or more races 5% Asian 3%
- Hispanic origin (detail)
- Puerto Rican 1%
- Common ancestry
- Swedish 1%
- Foreign-born
- 13% · Canada, Philippines, South Korea
- Languages at home
- 86% English-only · Spanish 4% French/Haitian/Cajun 1% Other Asian/Pacific 1%
Political lean MEDSL · Baltimore
- 2024 margin
- Solid D (+73.0) · D 85.2% · R 12.2% · Other 2.6%
- 2008→2024 swing
- -2.5pp toward R · 2008: 75.5pp · 2024: 73.0pp
- All cycles
- 2024: D+73.0 2020: D+76.6 2016: D+74.6 2012: D+76.4 2008: D+75.5
Not yet ingested
- Civics
- —
Market trends
- HPI YoY
- ▲ 9.50%
- Current HPI
- 843.63
- Rent YoY
- ▲ 5.23%
- Metro
- Baltimore-Columbia-Towson, MD
- State GDP YoY
- ▲ 2.97%
- F500 in state
- 12
Industry mix (Fortune 500 HQ in MD)
| Industry | F500 HQs | Revenue |
|---|---|---|
| Aerospace / Defense | 1 | $71B |
|
||
| Utilities | 1 | $25B |
|
||
| Hotels | 1 | $24B |
|
||
| Consumer Goods | 1 | $7B |
|
||
| Real Estate | 1 | $6B |
|
||
| Chemicals | 1 | $2B |
|
||
Price history
+104.4% since first listed25 events — show timeline
- 2026-05-01 Contingent — BRIGHT MLS
- 2026-04-20 Relisted — BRIGHT MLS
- 2026-03-23 Contingent — BRIGHT MLS
- 2026-02-24 Price Changed $179,900 BRIGHT MLS
- 2026-02-10 Relisted — BRIGHT MLS
- 2026-01-02 Contingent — BRIGHT MLS
- 2025-12-18 Relisted — BRIGHT MLS
- 2025-12-01 Contingent — BRIGHT MLS
- 2025-11-29 Pending — BRIGHT MLS
- 2025-09-12 Listed $199,900 BRIGHT MLS
- 2025-07-30 Price Changed $200,000 BRIGHT MLS
- 2025-07-30 Listing Removed — BRIGHT MLS
- 2025-07-23 Relisted — BRIGHT MLS
- 2025-06-24 Listing Removed — BRIGHT MLS
- 2025-06-20 Price Changed $214,900 BRIGHT MLS
- 2025-06-20 Relisted — BRIGHT MLS
- 2025-06-17 Listing Removed — BRIGHT MLS
- 2025-06-15 Price Changed $219,900 BRIGHT MLS
- 2025-06-10 Price Changed $214,900 BRIGHT MLS
- 2025-05-31 Listed $225,000 BRIGHT MLS
- 2001-01-09 Sold (Public Records) $88,000 Public Records
- 2001-01-09 Sold (Public Records) $88,000 Public Records
- 2000-12-15 Sold (MLS) $88,000 MRIS
- 2000-11-17 Delisted — MRIS
- 2000-07-18 Listed $88,000 MRIS
Property tax history
+1.4%/yrLatest (2025): $3,113 · +2.1% YoY. Source: county tax records.
Cash-flow waterfall
monthlySold comps — $/sqft
last 12 mo · ≤1 miLoading sold comps…