713 Lily Rd · Saw Creek, PA
Flood risk 1/10 · Minimal
- FEMA flood zone
- X (unshaded)
- Chance of flooding over 30 yrs
- 0.0%
- Est. flood insurance / yr
- $507 – $1,088
Fire risk 5/10 · Moderate
- Est. fire insurance / yr
- $511 – $949
Heat risk 3/10 · Minor
- Hot days now (above 93°F)
- 7 days/yr
- Hot days in 30 yrs
- 15 days/yr
Wind risk 4/10 · Minor
- Chance of severe wind over 30 yrs
- 9.0%
Air-quality risk 2/10 · Minimal
- Unhealthy air days now
- 1 days/yr
- Unhealthy air days in 30 yrs
- 2 days/yr
Risk factors via First Street. Map © Google.
Why this score? — see what drove the D+ grade
The composite is a weighted blend of 9 inputs, each scored 0–100. Each bar is that input's sub-score; the figure is the points it added to the 100-point composite (weight × sub-score).
- Cash flow +21.6/30.0
- DSCR +6.9/10.0
- 1% rule +5.8/10.0
- Schools +3.0/10.0
- Livability +3.0/5.0
- Rent growth +2.5/5.0
- Condition / age +2.5/5.0
- ARV discount +0.0/15.0
- Appreciation +0.0/10.0
$255,000
🖨 Deal sheet 📄 Offer letter ✓ Due diligence
Listing remarks MLS
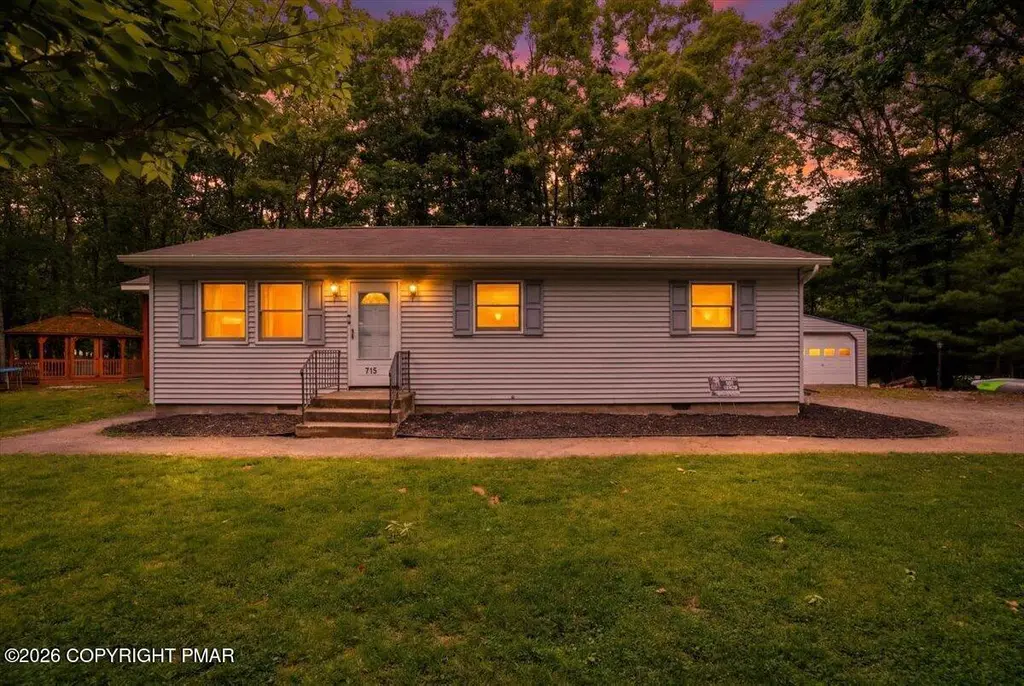
Well maintained 3 bedroom, 2 bath Ranch in Monroe Lakes Development. Deck and gazebo add extra outdoor entertaining areas. New 2 car garage and 2 car canopy.
Key facts
- 0.23 acre lot
- 2 garage spots
- Built 1992
Property features AI
Finance
- Other: Private-maintained road and private road frontage; Lot is level, cleared with few trees (0.23 acres)
- HOA & community: Part of an HOA (Monroe Lakes); HOA amenities include clubhouse, playground, basketball court, and security; HOA fee $880 annually (about $73.33/month)
Exterior
- Parking: Total 8 parking spaces; Detached 2-car garage; Detached 2-car carport; Driveway; Garage faces front; 4 open parking spaces
- Security: Community security (HOA amenity)
- Utilities: Water from a well; Septic tank sewer
- Home design: Single-family house; Residential property; Residential zoning
- Construction: Built with vinyl siding; Asphalt/fiberglass roof
- Exterior features: Private yard; Storage; Gazebo; Poultry coop; Shed(s); Covered wrap-around porch with side porch and patio
Interior
- Kitchen: Electric range; Refrigerator; Dishwasher; Water heater
- Bedrooms: Total rooms: 6
- Flooring: Laminate flooring; Vinyl flooring
- Bathrooms: 1 full bathroom; 1 half bathroom
- Heating & cooling: Baseboard heating; Electric heating; Ductless heating; Ductless cooling; Ceiling fans
- Interior features: Eat-in kitchen; Laminate counters; Walk-in closets; Ceiling fans
- Laundry & utility: Laundry on the main level; Crawl space basement
Neighborhood map
What this means for you Summary
Snapshot
- This is a 3-bed/1.0-bath single-family listed at $255k.
Deal economics
- At list price, monthly cash flow is $387 ($5k/yr) — positive.
- The deal already cash-flows at list — no discount required.
- Meets the 1% rule at list price ($3k rent vs $255k).
- Cap rate 8.1% vs local median 4.3% in Saw Creek — top-decile yield for the area; either an underpriced asset or a hidden risk that comps aren't pricing in. Stress-test before assuming the spread holds.
Location & tenants
- Location reads 59/100 on livability (#1,538 in PA) — a working-class tenant base; expect higher turnover. Strengths: crime A+, cost of living A+, housing A+; Watch: employment C-, health & safety D, schools F.
- East Stroudsburg Area SD (rural): math 25% / reading 43% proficiency, ranked #413 of 539 in PA (top 77%) — families likely to look elsewhere, expect single-tenant / working-renter base with shorter leases.
- Market conditions: 271 active listings in the ZIP; 1 comparable units currently listed for rent nearby; 278 units permitted in Monroe County in 2024 (52 in 5+ unit buildings).
Forward outlook
- Local home prices are declining (-3.0%/yr); year-one equity from $2k of loan paydown is wiped out by about $8k of value loss. Plan a longer hold.
- Monroe County population projected at -11% by 2050 — secular population decline; favor cash flow + early exit over multi-decade hold.
Negotiation context
- Only 11 days on market — expect competitive offers; lowballing is unlikely to land.
- 2 sale attempts since 6y ago with the ask held roughly flat each time — persistent listings suggest the price (not the market) is what's stuck; bring a comps-based counter.
- Current owner paid $179k; 42% above their basis — modest negotiation headroom, anchor on the comps not their cost.
Risks & watch-outs
- Climate carrying-cost: moderate wildfire risk — expect insurance premiums to compound above CPI over the hold.
Questions for the listing agent
- What does the HOA fee cover, when was the last increase, and are there any pending special assessments or reserve-fund shortfalls?
- Is there a deadline driving the sale (1031 exchange, divorce, estate, relocation)? That informs how much negotiation room exists.
- Schools are F-rated, which usually means shorter tenancies and higher turnover. Who's the typical renter profile here, and what's been the actual vacancy rate?
- The area grade is low — what's the realistic commute time and amenity access for the typical tenant pool here? Any planned neighborhood developments (good or bad) we should know about?
- What's the average days-on-market for RENTAL listings here right now (not sales)? A rising rental-DOM trend means longer vacancies and softer asking-rent achievability than the comps imply.
- What's the recent tenant-quality profile in this submarket — average credit score on applications, eviction rate, late-payment / NSF rate, and stable-employment percentage? A property-management company in the area should have these aggregated.
- How much new for-sale + rental construction is in the pipeline within 1–3 miles? Heavy new supply typically softens prices + rents 12–24 months out; constrained supply supports both.
Investment metrics
- 1% rule
- 1.08% ✓
- Cap rate
- 8.11%
- Cash-on-cash
- 6.51%
- DSCR
- 1.29
- GRM
- 7.7
CMA / ARV
- ARV (on-the-fly)
- $196,560
- Comps found
- 5
Show comp detail 5 sales within ~0.75 mi
| Address | Dist | Beds/Ba | Sqft | Sold | Price | $/sf | Match |
|---|---|---|---|---|---|---|---|
| 619 Koritia Rd | 0.05mi | 3/1.0 | 1,224 (+12%) | 12mo | $210,000 | $172 | 68 |
| 340 Carnation Rd | 0.22mi | 3/2.0 | 1,248 (+14%) | 12mo | $293,000 | $235 | 52 |
| 2542 Castor Rd | 0.55mi | 3/2.0 | 1,110 (+2%) | 21mo | $200,000 | $180 | 50 |
| 2313 Elmhurst Rd | 0.63mi | 3/1.0 | 1,181 (+8%) | 10mo | $111,000 | $94 | 48 |
| 6155 W Lakeshore Dr | 0.72mi | 3/1.0 | 1,249 (+14%) | 18mo | $275,199 | $220 | 27 |
Match score weights: distance 35% · size 25% · config 20% · recency 20%. Top-matched comps best support the ARV.
Projected returns pro-forma
-3.0% appreciation · 3.0% rent growth · sell at horizon
- IRR
- -6.3%
- Equity multiple
- 0.77×
- Total profit
- $-16,608
- Equity at exit
- $38,021
- IRR
- 3.4%
- Equity multiple
- 1.25×
- Total profit
- $17,515
- Equity at exit
- $22,048
Cash invested: $71,400 (down + closing). Projections, not guarantees.
Landlord ↔ Tenant lean methodology
- Overall (STATE)
- 62 Landlord-Friendly
- State Pennsylvania
- 62 Landlord-Friendly · EVEN
- County
- — inherits STATE
- City
- — inherits STATE
ZIP-level market 18302
- Home prices YoY
- -20.6%
- Active inventory
- 271
- Price-to-rent
- 7.7×
Monthly cashflow live
- Estimated rent
- $2,750 medium interval (Pro) →
- Mortgage (P&I)
- −$1,337
- Tax from tax record
- −$269 /mo · $3,226/yr
- Insurance
- −$106
- HOA
- −$73
- Vacancy / Maint / Mgmt
- −$578
- Net cashflow
- $387
Break-even live
UW: 25.0% down · 7.5% · 30yr · 1.5% tax · 5.0% vac · 8.0% maint · 8.0% mgmt
Financing live
Cash to close
- Down payment
- $63,750
- Closing costs
- $7,650
- Reserves months
- —
- Total cash needed
- —
Loan-product check · same deal, 3 products live
Conventional
25% down · 7.5% · 30yr
- Down + closing
- —
- Monthly P&I
- —
- Monthly cashflow
- —
- DSCR
- —
- Eligible?
- —
Personal DTI + credit; lowest rate.
DSCR
20% down · 8.5% · 30yr
- Down + closing
- —
- Monthly P&I
- —
- Monthly cashflow
- —
- DSCR
- —
- Eligible?
- —
No personal income docs; deal must DSCR.
Hard money
10% down · 12.0% · 12mo
- Down + closing
- —
- Monthly P&I
- —
- Monthly cashflow
- —
- DSCR
- —
- Eligible?
- —
Short-term bridge; refi at stabilization.
Rent comps 1 comps
| Address | Beds | Baths | Sqft | Rent | $/sqft | DOM | Units | Dist |
|---|---|---|---|---|---|---|---|---|
| 6281 Lakeshore Dr E East Stroudsburg, PA | 3.0 | 2.5 | 1450 | $2,750 | $1.90 | 43d | 1 | 0.57mi |
HOA detail
- Monthly dues
- $73 · $876/yr
Listing history 10 events
-
2026-06-15status $255,000 Pending 11 DOM
-
2026-06-15days on market $255,000 Active 11 DOM
-
2026-06-14days on market $255,000 Active 9 DOM
-
2026-06-13days on market $255,000 Active 8 DOM
-
2026-06-10days on market $255,000 Active 6 DOM
-
2026-06-09days on market $255,000 Active 5 DOM
-
2026-06-08days on market $255,000 Active 4 DOM
-
2026-06-07days on market $255,000 Active 3 DOM
-
2026-06-05remarks 699-char remark
-
2026-06-05$255,000 Active 1 DOM
ⓘ Source: listings_history table (triggers on properties + properties_extension) + one-shot
backfill from property_details.listing_events for pre-trigger history.
Tax reassessment forecast PA · Partial reset (capped growth)
- Current annual tax
- $3,226 · $269/mo
- Projected year-2 tax
- $3,628 · $302/mo
- Expected delta
- +$401/yr (+$33/mo · 12.4%)
ⓘ Screening estimate from a state-policy table — verify with the county assessor before closing.
Climate risk First Street
- Flood 1/10 Low FEMA zone X (unshaded) · 0% chance over 30 yrs
- Wildfire 5/10 Major
- Heat 3/10 Moderate 7 d/yr ≥93°F today · 15 d/yr by 30 yrs out
- Wind 4/10 Moderate 9% chance of damaging wind over 30 yrs
- Air quality 2/10 Low 1 unhealthy d/yr today · 2 by 30 yrs out
Nearby sold comps map
Loading sold comps map…
Walkable amenities ~0.75 mi
Loading nearby amenities…
Taxation est. · year 1
- Rental income
- $33,000
- − Mortgage interest
- −$14,284
- − Property taxes
- −$3,226
- − Insurance
- −$1,275
- − Repairs & maintenance
- −$2,640
- − Management
- −$2,640
- − HOA
- −$876
- − Depreciation
- −$7,418
- Taxable income
- $641
- Est. tax owed @ 24.0%
- −$154
- After-tax cash flow
- $4,492/yr
For passive investors: Depreciation is non-cash, so a rental often shows a tax loss while cash-flowing — sheltering income. Rental losses are passive: they offset passive income freely, and up to $25,000/yr can offset ordinary (W-2) income if you actively participate and your MAGI is under $100k (phasing out to $0 by $150k); unused losses carry forward. On sale, claimed depreciation is recaptured at up to 25%, and gains may owe capital-gains tax (a 1031 exchange can defer both). Figures are a year-1 estimate at your 24.0% rate — not tax advice; consult a CPA.
Schools (NCES district)
- District
- East Stroudsburg Area SD
- NCES district ID
- 4208670
- Math proficiency
- 25% ▼ -11.00%
- Reading proficiency
- 43% ▼ -18.00%
- Median HH income
- $57,142
- Composite
- 30.13/100
- National rank
- #6332
- State rank
- #413 of 539 in PA
Livability — Saw Creek
- Score
- 59/100
- State rank
- #1538
- US rank
- #20241
Category grades
Schools grade is shown separately in the Schools card above.
Census & demographics
- Population (ZIP)
- 17,593
Population outlook (Monroe County) Hauer SSP2
- Today (2025)
- 164,099 people
- By 2030
- 161,412 · -1.6%
- By 2040
- 154,616 · -5.8%
- By 2050
- 146,710 · -10.6%
- By 2075
- 140,830 · -14.2%
- By 2100
- 138,472 · -15.6%
Race, ethnicity, and origin ACS 2023
- Neighborhood character
- Diverse neighborhood (Simpson 0.63)
- Race & ethnicity
- White 53% Hispanic / Latino 24% Black 17% Two or more races 12% Asian 2%
- Hispanic origin (detail)
- Puerto Rican 8% Dominican 2%
- Common ancestry
- Romanian 4% Lithuanian 2% Slovak 2%
- Foreign-born
- 13% · Canada, Jamaica
- Languages at home
- 79% English-only · Spanish 13% Other Indo-European 2% French/Haitian/Cajun 2%
Political lean MEDSL · Monroe
- 2024 margin
- Toss-up / Even · D 49.1% · R 49.9%
- 2008→2024 swing
- -17.1pp toward R · 2008: 16.3pp · 2024: -0.8pp
- All cycles
- 2024: R+0.8 2020: D+6.4 2016: D+0.3 2012: D+14.0 2008: D+16.3
Not yet ingested
- Civics
- —
Market trends
- HPI YoY
- ▼ -41.00%
- Current HPI
- 157.9833
- Rent YoY
- —
- Metro
- —
- State GDP YoY
- ▲ 1.68%
- F500 in state
- 34
Industry mix (Fortune 500 HQ in PA)
| Industry | F500 HQs | Revenue |
|---|---|---|
| Healthcare | 2 | $309B |
|
||
| Insurance | 2 | $27B |
|
||
| Telecommunications / Media | 1 | $124B |
|
||
| Industrial Distribution | 1 | $22B |
|
||
| Financial Services | 1 | $20B |
|
||
| Chemicals / Materials | 1 | $18B |
|
||
Price history
+218.8% since first listed6 events — show timeline
- 2026-06-04 Listed $255,000 PMAR
- 2021-06-21 Sold (Public Records) $179,000 Public Records
- 2021-06-18 Sold (MLS) $179,000 LCAR
- 2020-12-14 Listed $179,000 LCAR
- 2002-06-18 Sold (Public Records) $91,000 Public Records
- 1992-02-03 Sold (Public Records) $80,000 Public Records
Property tax history
+0.6%/yrLatest (2026): $3,226 · +1.6% YoY. Source: county tax records.
Cash-flow waterfall
monthlySold comps — $/sqft
last 12 mo · ≤1 miLoading sold comps…