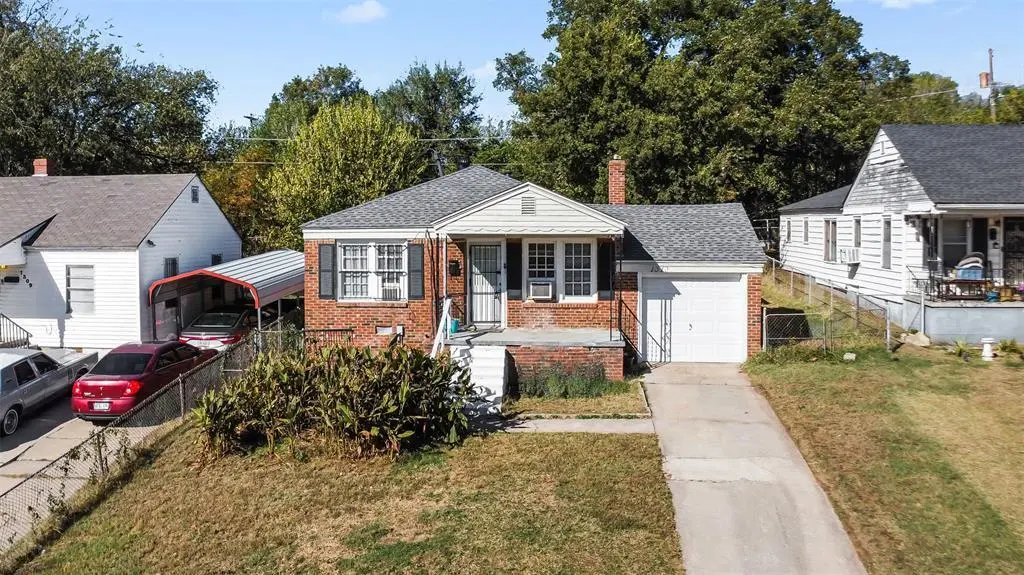
1313 Bellevidere Dr · Oklahoma City, OK
Flood risk 1/10 · Minimal
- FEMA flood zone
- X (unshaded)
- Chance of flooding over 30 yrs
- 0.0%
- Est. flood insurance / yr
- $507 – $1,088
Fire risk 1/10 · Minimal
- Est. fire insurance / yr
- $2,463 – $4,575
Heat risk 5/10 · Moderate
- Hot days now (above 107°F)
- 7 days/yr
- Hot days in 30 yrs
- 19 days/yr
Wind risk 3/10 · Minor
- Chance of severe wind over 30 yrs
- 4.0%
Air-quality risk 2/10 · Minimal
- Unhealthy air days now
- 1 days/yr
- Unhealthy air days in 30 yrs
- 2 days/yr
Risk factors via First Street. Map © Google.
Why this score? — see what drove the D grade
The composite is a weighted blend of 9 inputs, each scored 0–100. Each bar is that input's sub-score; the figure is the points it added to the 100-point composite (weight × sub-score).
- Cash flow +16.6/30.0
- Appreciation +6.2/10.0
- DSCR +5.1/10.0
- Livability +4.0/5.0
- 1% rule +3.3/10.0
- Rent growth +2.5/5.0
- Condition / age +2.5/5.0
- Schools +0.7/10.0
- ARV discount +0.0/15.0
$139,000
🖨 Deal sheet 📄 Offer letter ✓ Due diligence
Listing remarks MLS
Price Reduced on totally remodeled house! New paint inside and out, new tile, carpet, roof. All new fixtures. Courthouse shows 1025sf, does not reflect add on. Buyer to verify square footage. BONUS TO SELLING BROKER! Great drive up appeal! Owner finance an option!!!
Key facts
- Functional kitchen
- New flooring
- New water heater
Tags
Property features AI
Finance
- Other: Living area reported as 1,225 (source: plans); Located in Carverdale Sub Add; No storm shelter; Homestead not indicated
- Financial info: Loan qualification allowed; Not assumable
- HOA & community: No mandatory association dues
Exterior
- Parking: Concrete parking; 1-car garage
- Utilities: No flood insurance required
- Home design: Single-family residence; One story; Existing property
- Construction: Brick and frame construction; Composition roof; Slab foundation; Built as existing structure
- Exterior features: Front porch; Interior lot
Interior
- Bedrooms: 3 bedrooms (single level)
- Bathrooms: 1 full bathroom
- Interior features: One living area; One fireplace (other type)
Neighborhood map
What this means for you Summary
Snapshot
- This is a 2-bed/1.0-bath single-family listed at $139k.
Deal economics
- At list price, monthly cash flow is $83 ($1k/yr) — positive.
- The deal already cash-flows at list — no discount required.
- To meet the 1% rule (rent ≥ 1% of price), the offer needs to be $115k (17.1% below list).
- Recommended offer: $115k (17.1% below list) — sets the bar for 1% rule.
- Cap rate 7.0% vs local median 3.7% in Oklahoma City — top-decile yield for the area; either an underpriced asset or a hidden risk that comps aren't pricing in. Stress-test before assuming the spread holds.
Location & tenants
- Location reads 80/100 on livability (#3 in OK, #1,635 nationally) — a professional / high-income tenant draw. Strengths: amenities A+, commute A+, cost of living A+; Watch: schools F, crime F.
- Oklahoma City (urban): math 7% / reading 10% proficiency, ranked #254 of 270 in OK (top 94%) — low school quality limits family demand, transient renter base, plan for 1-2y turnover; 82% free/reduced lunch — lower-income household profile, screen leases tightly.
- Market conditions: 75 active listings in the ZIP; 40 comparable units currently listed for rent nearby; rentals at typical pace (median 24d on market — plan ~3-4 weeks tenant-placement turnaround); 42% of comp listings sitting > 30 days — soft ceiling on asking rent; lower-income renter base — watch delinquency; 5,365 units permitted in Oklahoma County in 2024 (569 in 5+ unit buildings).
Forward outlook
- In year one you build about $4k of equity ($961 loan paydown + $3k appreciation (2.4% local appreciation)).
- Oklahoma County population projected at +41% by 2050 — long-run rental-demand tailwind backs the buy-and-hold thesis.
- At projected returns (2.4% appreciation + 3.0% rent growth), your $39k cash investment doubles in ~6 years — after that, you're playing with house money.
- By year 8, paydown + projected appreciation supports a ~$32k cash-out refi (75% LTV) — recoverable capital for the next deal without selling this one.
Negotiation context
- It's been on market 31 days — a 3% lower offer ($135k) is reasonable based on typical stale-listing flexibility.
- 3 sale attempts since 23y ago with the ask held roughly flat each time — persistent listings suggest the price (not the market) is what's stuck; bring a comps-based counter.
- Current owner paid $35k; list at $139k implies a 297% gain — meaningful room to come down on a strong offer.
Risks & watch-outs
- Watch-outs: built in 1946 — expect roof / HVAC / electrical / plumbing capex.
- Climate carrying-cost: extreme-heat days projected 7→19/yr by 2055 (HVAC capex compounding) — expect insurance premiums to compound above CPI over the hold.
Questions for the listing agent
- It's been on market 31 days. Have you received any prior offers? Is the seller open to a 17% concession, seller financing, or rate buy-down credit?
- Built in 1946 — when were the roof, HVAC, electrical panel, plumbing, and water heater last replaced?
- Is there a deadline driving the sale (1031 exchange, divorce, estate, relocation)? That informs how much negotiation room exists.
- Schools are F-rated, which usually means shorter tenancies and higher turnover. Who's the typical renter profile here, and what's been the actual vacancy rate?
- Crime grade is F in this area — have there been break-ins, vandalism, or insurance claims at this property in the last 3 years? What carrier currently insures it and at what premium?
- The area grade is low — what's the realistic commute time and amenity access for the typical tenant pool here? Any planned neighborhood developments (good or bad) we should know about?
- What's the average days-on-market for RENTAL listings here right now (not sales)? A rising rental-DOM trend means longer vacancies and softer asking-rent achievability than the comps imply.
- What's the recent tenant-quality profile in this submarket — average credit score on applications, eviction rate, late-payment / NSF rate, and stable-employment percentage? A property-management company in the area should have these aggregated.
- How much new for-sale + rental construction is in the pipeline within 1–3 miles? Heavy new supply typically softens prices + rents 12–24 months out; constrained supply supports both.
Investment metrics
- 1% rule
- 0.83% ✗
- Cap rate
- 7.01%
- Cash-on-cash
- 2.57%
- DSCR
- 1.11
- GRM
- 10.1
CMA / ARV
- ARV (median comp)
- $105,355
- List price
- $139,000
- Delta
- 31.94%
- Verdict
- OVERPRICED
- Comps
- 20 within 1.0 mi
Show comp detail 12 sales within ~0.75 mi
| Address | Dist | Beds/Ba | Sqft | Sold | Price | $/sf | Match |
|---|---|---|---|---|---|---|---|
| 2509 NE 13th St | 0.14mi | 3/1.5 (+1) | 980 (-4%) | 1mo | $155,000 | $158 | 78 |
| 1157 E Bellevidere Dr | 0.20mi | 3/2.0 (+1) | 1,037 (+1%) | 7mo | $75,000 | $72 | 74 |
| 1716 N Highland Dr | 0.31mi | 3/1.0 (+1) | 1,040 (+2%) | 7mo | $145,000 | $139 | 72 |
| 2032 NE Grand Blvd | 0.54mi | 2/1.0 | 1,040 (+2%) | 2mo | $45,000 | $43 | 71 |
| 1701 N Fairmont Ave | 0.23mi | 2/1.0 | 927 (-10%) | 8mo | $73,000 | $79 | 67 |
| 2525 NE 14th St | 0.19mi | 2/1.0 | 895 (-13%) | 4mo | $60,000 | $67 | 67 |
| 1504 N Magnolia St | 0.48mi | 2/1.5 | 995 (-3%) | 5mo | $43,250 | $43 | 66 |
| 2021 N Page Ave | 0.45mi | 3/1.0 (+1) | 1,005 (-2%) | 7mo | $95,000 | $95 | 65 |
| 1908 NE Grand Blvd | 0.43mi | 3/1.0 (+1) | 998 (-3%) | 6mo | $85,000 | $85 | 65 |
| 2704 NE Success St | 0.55mi | 3/1.0 (+1) | 1,048 (+2%) | 10mo | $150,000 | $143 | 57 |
| 1720 Wickliff St | 0.67mi | 2/1.5 | 902 (-12%) | 0mo | $100,000 | $111 | 46 |
| 1620 NE 12th St | 0.74mi | 2/2.0 | 1,170 (+14%) | 2mo | $200,000 | $171 | 36 |
Match score weights: distance 35% · size 25% · config 20% · recency 20%. Top-matched comps best support the ARV.
Projected returns pro-forma
2.42% appreciation · 3.0% rent growth · sell at horizon
- IRR
- 8.2%
- Equity multiple
- 1.46×
- Total profit
- $17,751
- Equity at exit
- $57,983
- IRR
- 11.1%
- Equity multiple
- 2.57×
- Total profit
- $61,081
- Equity at exit
- $85,993
Cash invested: $38,920 (down + closing). Projections, not guarantees.
Landlord ↔ Tenant lean methodology
- Overall (STATE)
- 83 Strongly Landlord-Friendly
- State Oklahoma
- 83 Strongly Landlord-Friendly · R+20
- County
- — inherits STATE
- City
- — inherits STATE
ZIP-level market 73117
- Home prices YoY
- 1.3%
- Active inventory
- 75
- Price-to-rent
- 10.1×
Monthly cashflow live
- Estimated rent
- $1,152 high interval (Pro) →
- Mortgage (P&I)
- −$729
- Tax from tax record
- −$40 /mo · $476/yr
- Insurance
- −$58
- HOA
- −$0
- Vacancy / Maint / Mgmt
- −$242
- Net cashflow
- $83
Break-even live
UW: 25.0% down · 7.5% · 30yr · 1.5% tax · 5.0% vac · 8.0% maint · 8.0% mgmt
Financing live
Cash to close
- Down payment
- $34,750
- Closing costs
- $4,170
- Reserves months
- —
- Total cash needed
- —
Loan-product check · same deal, 3 products live
Conventional
25% down · 7.5% · 30yr
- Down + closing
- —
- Monthly P&I
- —
- Monthly cashflow
- —
- DSCR
- —
- Eligible?
- —
Personal DTI + credit; lowest rate.
DSCR
20% down · 8.5% · 30yr
- Down + closing
- —
- Monthly P&I
- —
- Monthly cashflow
- —
- DSCR
- —
- Eligible?
- —
No personal income docs; deal must DSCR.
Hard money
10% down · 12.0% · 12mo
- Down + closing
- —
- Monthly P&I
- —
- Monthly cashflow
- —
- DSCR
- —
- Eligible?
- —
Short-term bridge; refi at stabilization.
Rent comps 40 comps
| Address | Beds | Baths | Sqft | Rent | $/sqft | DOM | Units | Dist |
|---|---|---|---|---|---|---|---|---|
| 1321 Bellevidere Dr Oklahoma City, OK | 3.0 | 2.0 | 1000 | $1,200 | $1.20 | 23d | 1 | 0.03mi |
| 1217 Carverdale Dr Oklahoma City, OK | 2.0 | 2.0 | 1323 | $1,300 | $0.98 | 44d | 1 | 0.13mi |
| 2520 NE 14th St Oklahoma City, OK | 3.0 | 1.0 | 1070 | $1,099 | $1.03 | 44d | 1 | 0.16mi |
| 1501 NE Grand Blvd Oklahoma City, OK | 3.0 | 1.0 | 1204 | $1,200 | $1.00 | 4d | 1 | 0.20mi |
| 2501 NE 16th St Oklahoma City, OK | 2.0 | 1.0 | 941 | $1,100 | $1.17 | 44d | 1 | 0.24mi |
| 1709 N Page Ave Oklahoma City, OK | 2.0 | 1.0 | 967 | $895 | $0.93 | 23d | 1 | 0.24mi |
| 2105 NE 12th St Oklahoma City, OK | 3.0 | 2.0 | 1180 | $1,650 | $1.40 | 21d | 1 | 0.32mi |
| 2132 NE 19th St Oklahoma City, OK | 2.0 | 1.0 | 850 | $950 | $1.12 | 44d | 1 | 0.46mi |
| 2705 NE 18th St Oklahoma City, OK | 3.0 | 2.0 | 1399 | $1,000 | $0.71 | 21d | 1 | 0.46mi |
| 2143 NE 19th St Oklahoma City, OK | 2.0 | 1.0 | 1265 | $945 | $0.75 | 44d | 1 | 0.47mi |
| 2620 NE 19th St Oklahoma City, OK | 2.0 | 1.0 | 900 | $995 | $1.11 | 44d | 1 | 0.47mi |
| 2616 NE Success St Oklahoma City, OK | 3.0 | 2.0 | 1312 | $1,350 | $1.03 | 23d | 1 | 0.51mi |
| 2132 Miramar Blvd Oklahoma City, OK | 2.0 | 1.0 | 768 | $800 | $1.04 | 2d | 1 | 0.53mi |
| 2200 Hardin Dr Oklahoma City, OK | 3.0 | 1.0 | 1091 | $1,025 | $0.94 | 44d | 1 | 0.54mi |
| 2036 NE Grand Blvd Oklahoma City, OK | 2.0 | 1.0 | 1092 | $995 | $0.91 | 2d | 1 | 0.54mi |
| 2308 NE 21st St Oklahoma City, OK | 3.0 | 1.0 | 1400 | $1,250 | $0.89 | 2d | 1 | 0.56mi |
| 2107 Hardin Dr Oklahoma City, OK | 3.0 | 1.0 | 999 | $875 | $0.88 | 44d | 1 | 0.60mi |
| 2604 NE 21st St Oklahoma City, OK | 3.0 | 1.0 | 1260 | $995 | $0.79 | 23d | 1 | 0.61mi |
| 1801 E Park Pl Oklahoma City, OK | 2.0 | 1.0 | 734 | $695 | $0.95 | 44d | 1 | 0.62mi |
| 2300 Granada Blvd Oklahoma City, OK | 3.0 | 1.0 | 999 | $1,000 | $1.00 | 12d | 1 | 0.71mi |
| 2313 NE 23rd St Oklahoma City, OK | 3.0 | 2.5 | 1500 | $1,095 | $0.73 | 44d | 1 | 0.72mi |
| 2112 NE 23rd St Oklahoma City, OK | 3.0 | 1.0 | 1117 | $1,070 | $0.96 | 17d | 1 | 0.73mi |
| 1633 NE 11th St Oklahoma City, OK | 3.0 | 2.0 | 1284 | $1,945 | $1.51 | 1d | 1 | 0.75mi |
| 1727 NE 19th St Oklahoma City, OK | 3.0 | 1.0 | 892 | $995 | $1.12 | 44d | 1 | 0.79mi |
| 1722 NE 20th St Oklahoma City, OK | 2.0 | 1.0 | 800 | $1,070 | $1.34 | 44d | 1 | 0.82mi |
| 1706 NE 8th St Oklahoma City, OK | 3.0 | 2.0 | 1389 | $1,345 | $0.97 | 3d | 1 | 0.83mi |
| 1801 N Jordan Ave Oklahoma City, OK | 2.0 | 1.0 | 1080 | $1,000 | $0.93 | 14d | 1 | 0.84mi |
| 1609 NE 18th St Oklahoma City, OK | 2.0 | 1.0 | 899 | $900 | $1.00 | 4d | 1 | 0.85mi |
| 3212 NE 15th St Oklahoma City, OK | 3.0 | 1.0 | 825 | $965 | $1.17 | 10d | 1 | 0.88mi |
| 1444 NE 13th St Unit 1446 Oklahoma City, OK | 2.0 | 2.0 | 1167 | $1,199 | $1.03 | 17d | 1 | 0.93mi |
| 1450 NE 16th Ter Oklahoma City, OK | 3.0 | 1.0 | 1096 | $1,295 | $1.18 | 44d | 1 | 0.96mi |
| 1912 N Overbrook Dr Oklahoma City, OK | 3.0 | 1.0 | 1150 | $1,200 | $1.04 | 44d | 1 | 0.97mi |
| 3333 NE 12th St Oklahoma City, OK | 2.0 | 1.0 | 720 | $1,000 | $1.39 | 44d | 1 | 0.98mi |
| 3317 NE 15th St Oklahoma City, OK | 3.0 | 1.0 | 816 | $1,395 | $1.71 | 44d | 1 | 0.99mi |
| 1445 NE 10th St Oklahoma City, OK | 2.0 | 1.0 | 1011 | $1,195 | $1.18 | 17d | 1 | 0.99mi |
| 1931 NE 25th St Unit 10 Oklahoma City, OK | 2.0 | 1.0 | 900 | $875 | $0.97 | 23d | 1 | 1.02mi |
| 1904 NE 25th St Oklahoma City, OK | 2.0 | 1.0 | 939 | $950 | $1.01 | 4d | 1 | 1.03mi |
| 1921 NE 25th St Unit 3 Oklahoma City, OK | 2.0 | 1.0 | 900 | $875 | $0.97 | 20d | 1 | 1.03mi |
| 1812 NE 24th St Oklahoma City, OK | 3.0 | 1.0 | 1071 | $1,175 | $1.10 | 2d | 1 | 1.04mi |
| 1428 NE 10th St Oklahoma City, OK | 3.0 | 2.0 | 1487 | $1,600 | $1.08 | 44d | 1 | 1.04mi |
Listing history 19 events
-
2026-06-15days on market $139,000 Active 31 DOM
-
2026-06-13days on market $139,000 Active 29 DOM
-
2026-06-09days on market $139,000 Active 25 DOM
-
2026-06-08days on market $139,000 Active 24 DOM
-
2026-06-07days on market $139,000 Active 23 DOM
-
2026-06-05days on market $139,000 Active 20 DOM
-
2026-06-03days on market $139,000 Active 19 DOM
-
2026-06-02days on market $139,000 Active 18 DOM
-
2026-06-01days on market $139,000 Active 17 DOM
-
2026-05-31days on market $139,000 Active 16 DOM
-
2026-05-15$139,000 Active 1120-char remark
-
2026-04-07historical
-
2026-04-02price $148,000
-
2026-02-26price $152,000
-
2025-11-06$157,000 Active
-
2003-09-26soldstatus $35,000
Show marketing remark (267 chars)
Price Reduced on totally remodeled house! New paint inside and out, new tile, carpet, roof. All new fixtures. Courthouse shows 1025sf, does not reflect add on. Buyer to verify square footage. BONUS TO SELLING BROKER! Great drive up appeal! Owner finance an option!!!
-
2003-07-17$39,000
Show marketing remark (267 chars)
Price Reduced on totally remodeled house! New paint inside and out, new tile, carpet, roof. All new fixtures. Courthouse shows 1025sf, does not reflect add on. Buyer to verify square footage. BONUS TO SELLING BROKER! Great drive up appeal! Owner finance an option!!!
-
1994-11-28soldstatus $10,000
-
1994-05-10soldstatus $8,000
ⓘ Source: listings_history table (triggers on properties + properties_extension) + one-shot
backfill from property_details.listing_events for pre-trigger history.
Tax reassessment forecast OK · Resets to sale price
- Current annual tax
- $476 · $40/mo
- Projected year-2 tax
- $1,251 · $104/mo
- Expected delta
- +$776/yr (+$65/mo · 163.1%)
ⓘ Screening estimate from a state-policy table — verify with the county assessor before closing.
Climate risk First Street
- Flood 1/10 Low FEMA zone X (unshaded) · 0% chance over 30 yrs
- Wildfire 1/10 Low
- Heat 5/10 Major 7 d/yr ≥107°F today · 19 d/yr by 30 yrs out
- Wind 3/10 Moderate 4% chance of damaging wind over 30 yrs
- Air quality 2/10 Low 1 unhealthy d/yr today · 2 by 30 yrs out
Nearby sold comps map
Loading sold comps map…
Walkable amenities ~0.75 mi
Loading nearby amenities…
Taxation est. · year 1
- Rental income
- $13,822
- − Mortgage interest
- −$7,786
- − Property taxes
- −$476
- − Insurance
- −$695
- − Repairs & maintenance
- −$1,106
- − Management
- −$1,106
- − Depreciation
- −$4,044
- Taxable loss
- −$1,390
- Est. tax savings @ 24.0%
- +$333
- After-tax cash flow
- $1,335/yr
For passive investors: Depreciation is non-cash, so a rental often shows a tax loss while cash-flowing — sheltering income. Rental losses are passive: they offset passive income freely, and up to $25,000/yr can offset ordinary (W-2) income if you actively participate and your MAGI is under $100k (phasing out to $0 by $150k); unused losses carry forward. On sale, claimed depreciation is recaptured at up to 25%, and gains may owe capital-gains tax (a 1031 exchange can defer both). Figures are a year-1 estimate at your 24.0% rate — not tax advice; consult a CPA.
Schools (NCES district)
- District
- Oklahoma City
- NCES district ID
- 4022770
- Math proficiency
- 7% ▼ -5.00%
- Reading proficiency
- 10% ▼ -6.00%
- Median HH income
- $35,606
- Composite
- 7.0/100
- National rank
- #9970
- State rank
- #254 of 270 in OK
Livability — Oklahoma City
- Score
- 80/100
- State rank
- #3
- US rank
- #1635
Category grades
Schools grade is shown separately in the Schools card above.
Census & demographics
- Census place
- Oklahoma City, OK
- County
- Oklahoma County · 771,644 people
- City population
- 498,656
- Metro
- Oklahoma City, OK
- Population (ZIP)
- 6,225
- Household income
- $23,413
- Rent vs Own
- Severe rent burden
- 681.0
Population outlook (Oklahoma County) Hauer SSP2
- Today (2025)
- 911,875 people
- By 2030
- 982,413 · +7.7%
- By 2040
- 1,130,468 · +24.0%
- By 2050
- 1,288,422 · +41.3%
- By 2075
- 1,711,482 · +87.7%
- By 2100
- 2,088,448 · +129.0%
Race, ethnicity, and origin ACS 2023
- Neighborhood character
- Diverse neighborhood (Simpson 0.56)
- Race & ethnicity
- Black 63% White 16% Two or more races 13% Hispanic / Latino 12% Asian 2%
- Hispanic origin (detail)
- Mexican 10%
- Foreign-born
- 10% · Canada, Guatemala, China
- Languages at home
- 87% English-only · Spanish 8% Other Indo-European 1% Other Asian/Pacific 1%
Political lean MEDSL · Oklahoma
- 2024 margin
- Toss-up / Even · D 48.0% · R 49.7% · Other 2.3%
- 2008→2024 swing
- +15.1pp toward D · 2008: -16.8pp · 2024: -1.7pp
- All cycles
- 2024: R+1.7 2020: R+1.1 2016: R+10.5 2012: R+16.7 2008: R+16.8
Not yet ingested
- Civics
- —
Market trends
- HPI YoY
- ▲ 2.42%
- Current HPI
- 192.3185
- Rent YoY
- —
- Metro
- Oklahoma City, OK
- State GDP YoY
- ▲ 1.55%
- F500 in state
- 6
Industry mix (Fortune 500 HQ in OK)
| Industry | F500 HQs | Revenue |
|---|---|---|
| Energy | 3 | $48B |
|
||
Price history
+1637.5% since first listed10 events — show timeline
- 2026-06-16 Listing Removed — MLSOK
- 2026-05-15 Listed $139,000 MLSOK
- 2026-04-07 Listing Removed — MLSOK
- 2026-04-02 Price Changed $148,000 MLSOK
- 2026-02-26 Price Changed $152,000 MLSOK
- 2025-11-06 Listed $157,000 MLSOK
- 2003-09-26 Sold (MLS) $35,000 MLSOK
- 2003-07-17 Listed $39,000 MLSOK
- 1994-11-28 Sold (Public Records) $10,000 Public Records
- 1994-05-10 Sold (Public Records) $8,000 Public Records
Property tax history
+4.9%/yrLatest (2025): $476 · +4.2% YoY. Source: county tax records.
Cash-flow waterfall
monthlySold comps — $/sqft
last 12 mo · ≤1 miLoading sold comps…