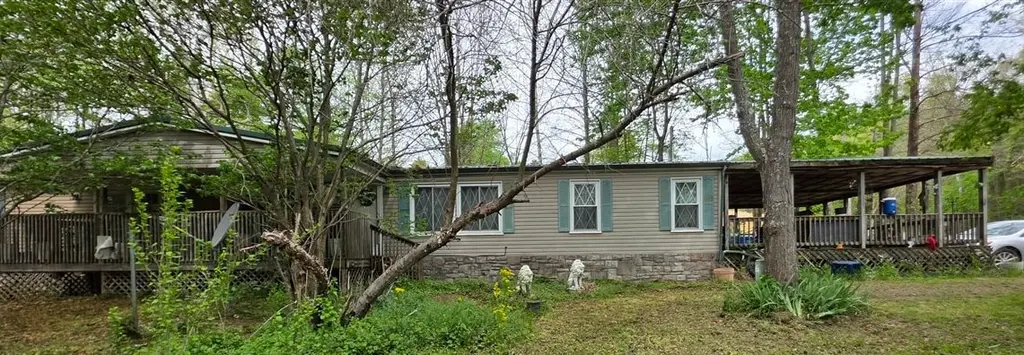
1945 Lambert Schoolhouse Rd · Hawesville, KY
Flood risk 7/10 · Major
- FEMA flood zone
- X (unshaded)
- Chance of flooding over 30 yrs
- 0.78%
- Est. flood insurance / yr
- $507 – $1,088
Fire risk 3/10 · Minor
- Est. fire insurance / yr
- $839 – $1,559
Heat risk 5/10 · Moderate
- Hot days now (above 106°F)
- 7 days/yr
- Hot days in 30 yrs
- 19 days/yr
Wind risk 2/10 · Minimal
- Chance of severe wind over 30 yrs
- 3.0%
Air-quality risk 2/10 · Minimal
- Unhealthy air days now
- 0 days/yr
- Unhealthy air days in 30 yrs
- 2 days/yr
Risk factors via First Street. Map © Google.
Why this score? — see what drove the B grade
The composite is a weighted blend of 9 inputs, each scored 0–100. Each bar is that input's sub-score; the figure is the points it added to the 100-point composite (weight × sub-score).
- Cash flow +30.0/30.0
- DSCR +10.0/10.0
- 1% rule +8.3/10.0
- ARV discount +7.5/15.0
- Appreciation +4.2/10.0
- Schools +3.3/10.0
- Livability +3.3/5.0
- Rent growth +2.5/5.0
- Condition / age +2.5/5.0
$89,000
🖨 Deal sheet 📄 Offer letter ✓ Due diligence
Listing remarks
Investor Special! This 5 bed / 3 bath manufactured home sits on a full acre in a peaceful and private country setting, and is conveniently located to both Hawesville and Tell City. The home has had additions built on adding bedrooms, a craft room, play room, sun room, and an additional bathroom. Buyer to verify total square footage. This property does need some repairs that would impact certain types of financing and is currently being sold "as-is". Call today for a tour!
Key facts
- 1 acre lot
- Built 2000
- Listed 58 days
Property features AI
Exterior
- Parking: Gravel parking
- Utilities: Septic tank
- Home design: Residential manufactured home; Single-family style; Located on a 1 acre lot
- Construction: Vinyl siding
- Exterior features: Shingle roof
Interior
- Kitchen: Electric range
- Flooring: Carpet; Laminate
- Bathrooms: 3 full bathrooms; 2 bathrooms on the main level
- Heating & cooling: Central electric heating
- Interior features: Eat-in kitchen
- Laundry & utility: Electric water heater
Neighborhood map
What this means for you Summary
Snapshot
- This is a 3-bed/2.0-bath single-family listed at $89k.
Deal economics
- At list price, monthly cash flow is $349 ($4k/yr) — positive.
- The deal already cash-flows at list — no discount required.
- Meets the 1% rule at list price ($1k rent vs $89k).
- Recommended offer: $86k (3.0% below list) — sets the bar for market timing.
Location & tenants
- Location reads 66/100 on livability (#237 in KY) — a middle-class / working-renter tenant base. Strengths: crime A+, cost of living A+, housing A+; Watch: employment D, amenities F, commute F.
- Hancock County (rural): math 31% / reading 45% proficiency, ranked #38 of 165 in KY (top 23%) — families likely to look elsewhere, expect single-tenant / working-renter base with shorter leases.
- Zoned schools: North Hancock Elementary School (math 27% / reading 39%, grade F, #338 of 676 statewide, top 50%, 472 students, 61% FRL); Hancock County Middle School (math 32% / reading 50%, grade F, #54 of 217 statewide, top 25%, 333 students, 56% FRL); Hancock County High School (math 37% / reading 42%, grade F, #40 of 254 statewide, top 19%, 483 students, 46% FRL).
- Market conditions: 25 active listings in the ZIP; 9 units permitted in Hancock County in 2024 (0 in 5+ unit buildings).
Forward outlook
- Local home prices are declining (-1.7%/yr); year-one equity from $615 of loan paydown is wiped out by about $1k of value loss. Plan a longer hold.
- Hancock County population projected to shrink 8% by 2050 — rents likely to lag national; underwrite the cash flow, not the appreciation.
- At projected returns (-1.7% appreciation + 3.0% rent growth), your $25k cash investment doubles in ~6 years — after that, you're playing with house money.
Negotiation context
- It's been on market 58 days — a 3% lower offer ($86k) is reasonable based on typical stale-listing flexibility.
- Current owner paid $16k; list at $89k implies a 439% gain — meaningful room to come down on a strong offer.
Risks & watch-outs
- Watch-outs: flood insurance adds $66/mo.
- Climate carrying-cost: major flood risk; extreme-heat days projected 7→19/yr by 2055 (HVAC capex compounding) — expect insurance premiums to compound above CPI over the hold.
Questions for the listing agent
- It's been on market 58 days. Have you received any prior offers? Is the seller open to a 3% concession, seller financing, or rate buy-down credit?
- What's the actual annual flood-insurance premium (NFIP or private), and is the property in a SFHA with mandatory coverage?
- Is there a deadline driving the sale (1031 exchange, divorce, estate, relocation)? That informs how much negotiation room exists.
- Schools are D-rated, which usually means shorter tenancies and higher turnover. Who's the typical renter profile here, and what's been the actual vacancy rate?
- What's the average days-on-market for RENTAL listings here right now (not sales)? A rising rental-DOM trend means longer vacancies and softer asking-rent achievability than the comps imply.
- What's the recent tenant-quality profile in this submarket — average credit score on applications, eviction rate, late-payment / NSF rate, and stable-employment percentage? A property-management company in the area should have these aggregated.
- How much new for-sale + rental construction is in the pipeline within 1–3 miles? Heavy new supply typically softens prices + rents 12–24 months out; constrained supply supports both.
Investment metrics
- 1% rule
- 1.33% ✓
- Cap rate
- 11.90%
- Cash-on-cash
- 20.01%
- DSCR
- 1.89
- GRM
- 6.2
CMA / ARV
No comps found within radius.
Projected returns pro-forma
-1.68% appreciation · 3.0% rent growth · sell at horizon
- IRR
- 11.9%
- Equity multiple
- 1.52×
- Total profit
- $12,847
- Equity at exit
- $18,621
- IRR
- 18.9%
- Equity multiple
- 2.78×
- Total profit
- $44,390
- Equity at exit
- $17,207
Cash invested: $24,920 (down + closing). Projections, not guarantees.
Landlord ↔ Tenant lean methodology
- Overall (STATE)
- 83 Strongly Landlord-Friendly
- State Kentucky
- 83 Strongly Landlord-Friendly · R+16
- County
- — inherits STATE
- City
- — inherits STATE
ZIP-level market 42348
- Home prices YoY
- -0.7%
- Active inventory
- 25
- Price-to-rent
- 6.2×
Monthly cashflow live
- Estimated rent
- $1,188 medium interval (Pro) →
- Mortgage (P&I)
- −$467
- Tax from tax record
- −$19 /mo · $230/yr
- Insurance
- −$37
- Flood insurance flood zone
- −$66 /mo · $798/yr
- HOA
- −$0
- Vacancy / Maint / Mgmt
- −$249
- Net cashflow
- $349
Break-even live
UW: 25.0% down · 7.5% · 30yr · 1.5% tax · 5.0% vac · 8.0% maint · 8.0% mgmt
Financing live
Cash to close
- Down payment
- $22,250
- Closing costs
- $2,670
- Reserves months
- —
- Total cash needed
- —
Loan-product check · same deal, 3 products live
Conventional
25% down · 7.5% · 30yr
- Down + closing
- —
- Monthly P&I
- —
- Monthly cashflow
- —
- DSCR
- —
- Eligible?
- —
Personal DTI + credit; lowest rate.
DSCR
20% down · 8.5% · 30yr
- Down + closing
- —
- Monthly P&I
- —
- Monthly cashflow
- —
- DSCR
- —
- Eligible?
- —
No personal income docs; deal must DSCR.
Hard money
10% down · 12.0% · 12mo
- Down + closing
- —
- Monthly P&I
- —
- Monthly cashflow
- —
- DSCR
- —
- Eligible?
- —
Short-term bridge; refi at stabilization.
Listing history 19 events
-
2026-06-18days on market $89,000 Active 58 DOM
-
2026-06-17days on market $89,000 Active 57 DOM
-
2026-06-16days on market $89,000 Active 56 DOM
-
2026-06-15days on market $89,000 Active 55 DOM
-
2026-06-13days on market $89,000 Active 53 DOM
-
2026-06-12days on market $89,000 Active 52 DOM
-
2026-06-09days on market $89,000 Active 49 DOM
-
2026-06-08days on market $89,000 Active 48 DOM
-
2026-06-07days on market $89,000 Active 47 DOM
-
2026-06-05days on market $89,000 Active 45 DOM
-
2026-06-04days on market $89,000 Active 43 DOM
-
2026-06-02days on market $89,000 Active 42 DOM
-
2026-06-01days on market $89,000 Active 41 DOM
-
2026-05-31days on market $89,000 Active 40 DOM
-
2026-05-31days on market $89,000 Active 39 DOM
-
2026-05-08price $99,000
-
2026-04-21$110,000 Active
-
1997-02-01soldstatus $16,500
-
1994-06-01soldstatus $12,500
ⓘ Source: listings_history table (triggers on properties + properties_extension) + one-shot
backfill from property_details.listing_events for pre-trigger history.
Tax reassessment forecast KY · Resets to sale price
- Current annual tax
- $230 · $19/mo
- Projected year-2 tax
- $765 · $64/mo
- Expected delta
- +$536/yr (+$45/mo · 233.1%)
ⓘ Screening estimate from a state-policy table — verify with the county assessor before closing.
Climate risk First Street
- Flood 7/10 Severe FEMA zone X (unshaded) · 78% chance over 30 yrs
- Wildfire 3/10 Moderate
- Heat 5/10 Major 7 d/yr ≥106°F today · 19 d/yr by 30 yrs out
- Wind 2/10 Low 3% chance of damaging wind over 30 yrs
- Air quality 2/10 Low 0 unhealthy d/yr today · 2 by 30 yrs out
Nearby sold comps map
Loading sold comps map…
Walkable amenities ~0.75 mi
Loading nearby amenities…
Taxation est. · year 1
- Rental income
- $14,256
- − Mortgage interest
- −$4,985
- − Property taxes
- −$230
- − Insurance
- −$1,242
- − Repairs & maintenance
- −$1,141
- − Management
- −$1,141
- − Depreciation
- −$2,589
- Taxable income
- $2,929
- Est. tax owed @ 24.0%
- −$703
- After-tax cash flow
- $3,487/yr
For passive investors: Depreciation is non-cash, so a rental often shows a tax loss while cash-flowing — sheltering income. Rental losses are passive: they offset passive income freely, and up to $25,000/yr can offset ordinary (W-2) income if you actively participate and your MAGI is under $100k (phasing out to $0 by $150k); unused losses carry forward. On sale, claimed depreciation is recaptured at up to 25%, and gains may owe capital-gains tax (a 1031 exchange can defer both). Figures are a year-1 estimate at your 24.0% rate — not tax advice; consult a CPA.
Schools (NCES district)
- District
- Hancock County
- NCES district ID
- 2102460
- Math proficiency
- 31% ▼ -13.00%
- Reading proficiency
- 45% ▼ -14.00%
- Median HH income
- $48,577
- Composite
- 32.65/100
- National rank
- #5662
- State rank
- #38 of 165 in KY
Livability — Hawesville
- Score
- 66/100
- State rank
- #237
- US rank
- #11638
Category grades
Schools grade is shown separately in the Schools card above.
Census & demographics
- Population (ZIP)
- 4,709
Population outlook (Hancock County) Hauer SSP2
- Today (2025)
- 8,804 people
- By 2030
- 8,731 · -0.8%
- By 2040
- 8,490 · -3.6%
- By 2050
- 8,097 · -8.0%
- By 2075
- 6,910 · -21.5%
- By 2100
- 5,246 · -40.4%
Race, ethnicity, and origin ACS 2023
- Neighborhood character
- Predominantly White (96%)
- Race & ethnicity
- White 96% Two or more races 2% Black 1%
- Common ancestry
- Lithuanian 3% English 2% Italian 2%
- Foreign-born
- 0%
- Languages at home
- 99% English-only · Spanish 1%
Political lean MEDSL · Hancock
- 2024 margin
- Solid R (+47.5) · D 25.3% · R 72.8% · Other 1.8%
- 2008→2024 swing
- -52.5pp toward R · 2008: 5.0pp · 2024: -47.5pp
- All cycles
- 2024: R+47.5 2020: R+39.1 2016: R+36.0 2012: R+9.2 2008: D+5.0
Not yet ingested
- Civics
- —
Market trends
- HPI YoY
- ▼ -1.68%
- Current HPI
- 240.6329
- Rent YoY
- —
- Metro
- —
- State GDP YoY
- ▲ 1.81%
- F500 in state
- 4
Industry mix (Fortune 500 HQ in KY)
| Industry | F500 HQs | Revenue |
|---|---|---|
| Healthcare | 1 | $118B |
|
||
| Food / Beverage | 1 | $7B |
|
||
Price history
+692.0% since first listed4 events — show timeline
- 2026-05-08 Price Changed $99,000 RASKMLS
- 2026-04-21 Listed $110,000 RASKMLS
- 1997-02-01 Sold (Public Records) $16,500 Public Records
- 1994-06-01 Sold (Public Records) $12,500 Public Records
Property tax history
-8.5%/yrLatest (2025): $230 · -6.3% YoY. Source: county tax records.
Cash-flow waterfall
monthlySold comps — $/sqft
last 12 mo · ≤1 miLoading sold comps…