 🏗️ New Construction
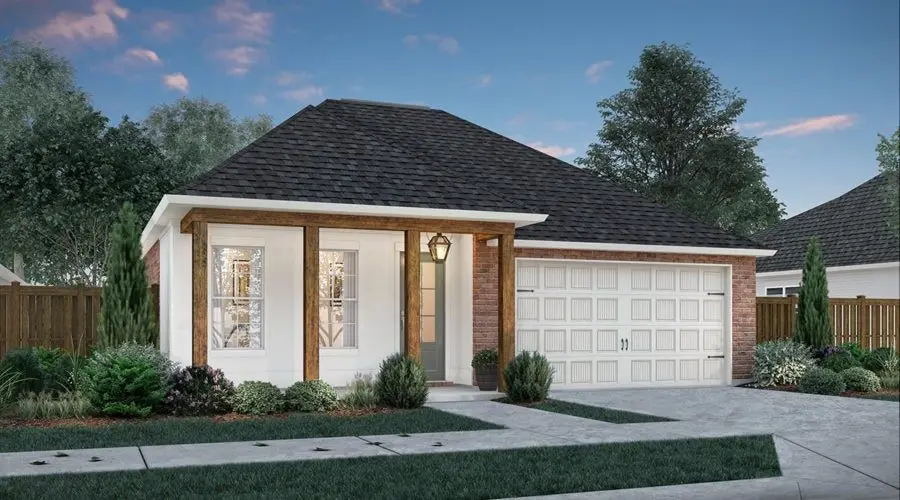
Hadley Plan · Youngsville, LA
Flood risk No data
- FEMA flood zone
- —
- Chance of flooding over 30 yrs
- —
- Est. flood insurance / yr
- —
Fire risk No data
- Est. fire insurance / yr
- —
Heat risk No data
- Hot days now (above threshold)
- —
- Hot days in 30 yrs
- —
Wind risk No data
- Chance of severe wind over 30 yrs
- —
Air-quality risk No data
- Unhealthy air days now
- —
- Unhealthy air days in 30 yrs
- —
Risk factors via First Street. Map © Google.
Why this score? — see what drove the D grade
The composite is a weighted blend of 9 inputs, each scored 0–100. Each bar is that input's sub-score; the figure is the points it added to the 100-point composite (weight × sub-score).
- Cash flow +13.1/30.0
- ARV discount +7.5/15.0
- Condition / age +4.8/5.0
- DSCR +3.9/10.0
- Livability +3.9/5.0
- 1% rule +3.7/10.0
- Schools +3.6/10.0
- Rent growth +2.9/5.0
- Appreciation +0.0/10.0
$309,000
🖨 Deal sheet 📄 Offer letter ✓ Due diligence
Listing remarks MLS
None
Key facts
- 2 garage spots
- Listed 390 days
Neighborhood map
What this means for you Summary
Snapshot
- This is a 4-bed/2.0-bath single-family listed at $309k. Condition is rated excellent.
Deal economics
- At list price, monthly cash flow is $-9 ($-106/yr) — negative.
- To cash-flow at today's rent, offer at most $307k (0.8% below list).
- To meet the 1% rule (rent ≥ 1% of price), the offer needs to be $268k (13.2% below list).
- Recommended offer: $268k (13.2% below list) — sets the bar for 1% rule.
- Cap rate 6.3% vs local median 4.8% in Youngsville — top-decile yield for the area; either an underpriced asset or a hidden risk that comps aren't pricing in. Stress-test before assuming the spread holds.
Location & tenants
- Location reads 78/100 on livability (#8 in LA, #2,614 nationally) — a middle-class / working-renter tenant base. Strengths: schools A+, employment A+, housing A+; Watch: amenities F, commute F.
- Lafayette Parish (urban): math 38% / reading 46% proficiency, ranked #19 of 98 in LA (top 19%) — families likely to look elsewhere, expect single-tenant / working-renter base with shorter leases.
- Market conditions: Rents rising (+1.6%/yr); 675 active listings in the ZIP; 7 comparable units currently listed for rent nearby; rentals lingering (median 44d on market — plan ~5-8 weeks vacancy on turnover, expect pricing pressure); 57% of comp listings sitting > 30 days — soft ceiling on asking rent; solid renter incomes; 1,585 units permitted in Lafayette Parish in 2024 (10 in 5+ unit buildings).
- This rent runs 35% of the median local income ($93k/yr) — at the standard rent-burdened threshold; future hikes will face affordability resistance.
Forward outlook
- Local home prices are declining (-3.0%/yr); year-one equity from $2k of loan paydown is wiped out by about $9k of value loss. Plan a longer hold.
- Lafayette County population projected at +34% by 2050 — long-run rental-demand tailwind backs the buy-and-hold thesis.
Negotiation context
- It's been on market 390 days — a 12% lower offer ($272k) is reasonable based on typical stale-listing flexibility.
Questions for the listing agent
- What do current leases actually rent for vs. the listed asking? Can we see a recent rent roll and the last 12 months of T-12 income?
- It's been on market 390 days. Have you received any prior offers? Is the seller open to a 13% concession, seller financing, or rate buy-down credit?
- Why hasn't it sold? Are there any deal-killer items the seller is aware of (foundation, flood, title, zoning, code violations)?
- Is there a deadline driving the sale (1031 exchange, divorce, estate, relocation)? That informs how much negotiation room exists.
- Schools are A-rated — typically a magnet for longer-tenancy family renters. What's the average tenant stay here, and is there a school-zone premium baked into asking?
- The area grade is low — what's the realistic commute time and amenity access for the typical tenant pool here? Any planned neighborhood developments (good or bad) we should know about?
- What's the average days-on-market for RENTAL listings here right now (not sales)? A rising rental-DOM trend means longer vacancies and softer asking-rent achievability than the comps imply.
- What's the recent tenant-quality profile in this submarket — average credit score on applications, eviction rate, late-payment / NSF rate, and stable-employment percentage? A property-management company in the area should have these aggregated.
- How much new for-sale + rental construction is in the pipeline within 1–3 miles? Heavy new supply typically softens prices + rents 12–24 months out; constrained supply supports both.
Investment metrics
- 1% rule
- 0.87% ✗
- Cap rate
- 6.26%
- Cash-on-cash
- -0.12%
- DSCR
- 0.99
- GRM
- 9.6
CMA / ARV
- ARV (median comp)
- $307,827
- List price
- $309,000
- Delta
- 0.38%
- Verdict
- FAIR
- Comps
- 20 within 1.0 mi
Show comp detail 12 sales within ~0.75 mi
| Address | Dist | Beds/Ba | Sqft | Sold | Price | $/sf | Match |
|---|---|---|---|---|---|---|---|
| 228 Santander Dr | 0.23mi | 3/2.0 (-1) | 2,006 (-0%) | 1mo | $349,900 | $174 | 83 |
| 204 Central Village Way | 0.20mi | 4/2.0 | 1,874 (-7%) | 0mo | $318,600 | $170 | 79 |
| 203 Central Village Way | 0.21mi | 4/2.0 | 1,873 (-7%) | 2mo | $318,500 | $170 | 77 |
| 210 Central Village Way | 0.14mi | 3/2.5 (-1) | 1,843 (-8%) | 3mo | $317,000 | $172 | 70 |
| 208 San Marcos Dr | 0.33mi | 3/2.0 (-1) | 1,953 (-3%) | 8mo | $390,000 | $200 | 68 |
| 103 Santander Dr | 0.20mi | 3/2.0 (-1) | 1,871 (-7%) | 8mo | $340,000 | $182 | 67 |
| 200 Rio Dr | 0.15mi | 3/2.0 (-1) | 1,843 (-8%) | 9mo | $323,500 | $176 | 66 |
| 100 Rio Dr | 0.27mi | 3/2.5 (-1) | 1,843 (-8%) | 1mo | $321,900 | $175 | 66 |
| 226 Central Village Way | 0.09mi | 3/2.0 (-1) | 1,767 (-12%) | 7mo | $311,500 | $176 | 65 |
| 202 Central Village Way | 0.21mi | 3/2.0 (-1) | 1,719 (-15%) | 2mo | $302,200 | $176 | 59 |
| 227 Central Village Way | 0.14mi | 3/2.0 (-1) | 1,719 (-15%) | 10mo | $302,200 | $176 | 56 |
| 116 Border Ct | 0.70mi | 4/2.0 | 1,899 (-6%) | 8mo | $227,000 | $120 | 51 |
Match score weights: distance 35% · size 25% · config 20% · recency 20%. Top-matched comps best support the ARV.
Projected returns pro-forma
-3.0% appreciation · 1.65% rent growth · sell at horizon
- IRR
- -18.0%
- Equity multiple
- 0.37×
- Total profit
- $-53,998
- Equity at exit
- $45,898
- IRR
- -13.0%
- Equity multiple
- 0.28×
- Total profit
- $-61,936
- Equity at exit
- $26,615
Cash invested: $86,192 (down + closing). Projections, not guarantees.
Landlord ↔ Tenant lean methodology
- Overall (STATE)
- 90 Strongly Landlord-Friendly
- State Louisiana
- 90 Strongly Landlord-Friendly · R+12
- County
- — inherits STATE
- City
- — inherits STATE
ZIP-level market 70592
- Home prices YoY
- -23.4%
- Rents YoY
- 1.6%
- Active inventory
- 675
- Price-to-rent
- 9.6×
Monthly cashflow live
- Estimated rent
- $2,682 high interval (Pro) →
- Mortgage (P&I)
- −$1,614
- Tax est. 1.5%
- −$385 /mo · $4,617/yr
- Insurance
- −$128
- HOA
- −$0
- Vacancy / Maint / Mgmt
- −$563
- Net cashflow
- $-9
Break-even live
UW: 25.0% down · 7.5% · 30yr · 1.5% tax · 5.0% vac · 8.0% maint · 8.0% mgmt
Financing live
Cash to close
- Down payment
- $76,957
- Closing costs
- $9,235
- Reserves months
- —
- Total cash needed
- —
Loan-product check · same deal, 3 products live
Conventional
25% down · 7.5% · 30yr
- Down + closing
- —
- Monthly P&I
- —
- Monthly cashflow
- —
- DSCR
- —
- Eligible?
- —
Personal DTI + credit; lowest rate.
DSCR
20% down · 8.5% · 30yr
- Down + closing
- —
- Monthly P&I
- —
- Monthly cashflow
- —
- DSCR
- —
- Eligible?
- —
No personal income docs; deal must DSCR.
Hard money
10% down · 12.0% · 12mo
- Down + closing
- —
- Monthly P&I
- —
- Monthly cashflow
- —
- DSCR
- —
- Eligible?
- —
Short-term bridge; refi at stabilization.
Rent comps 7 comps
| Address | Beds | Baths | Sqft | Rent | $/sqft | DOM | Units | Dist |
|---|---|---|---|---|---|---|---|---|
| 305 San Sebastian Dr Youngsville, LA | 4.0 | 3.0 | 2128 | $2,800 | $1.32 | 43d | 1 | 0.30mi |
| 117 San Sebastian Dr Youngsville, LA | 4.0 | 3.0 | 2239 | $3,500 | $1.56 | 13d | 1 | 0.33mi |
| 213 Garden Oaks Ave Youngsville, LA | 4.0 | 3.0 | 2334 | $2,600 | $1.11 | 43d | 1 | 0.64mi |
| 106 Royal Oak St Youngsville, LA | 3.0 | 2.0 | 1616 | $1,895 | $1.17 | 43d | 1 | 0.65mi |
| 102 Border Ct Youngsville, LA | 4.0 | 2.0 | 1786 | $2,100 | $1.18 | 13d | 1 | 0.75mi |
| 111 Abbeywood Ct Youngsville, LA | 3.0 | 2.0 | 1616 | $1,800 | $1.11 | 21d | 1 | 0.78mi |
| 110 Canton Ct Youngsville, LA | 3.0 | 2.0 | 1423 | $1,995 | $1.40 | 43d | 1 | 1.40mi |
Listing history 17 events
-
2026-06-18days on market $309,000 Active 390 DOM
-
2026-06-17days on market $309,000 Active 389 DOM
-
2026-06-16days on market $309,000 Active 388 DOM
-
2026-06-15days on market $309,000 Active 387 DOM
-
2026-06-14days on market $309,000 Active 385 DOM
-
2026-06-13days on market $309,000 Active 384 DOM
-
2026-06-10days on market $309,000 Active 382 DOM
-
2026-06-09days on market $309,000 Active 381 DOM
-
2026-06-08days on market $309,000 Active 380 DOM
-
2026-06-07days on market $309,000 Active 379 DOM
-
2026-06-05days on market $309,000 Active 376 DOM
-
2026-06-03days on market $309,000 Active 375 DOM
-
2026-06-02days on market $309,000 Active 374 DOM
-
2026-06-01days on market $309,000 Active 373 DOM
-
2026-05-31days on market $309,000 Active 372 DOM
-
2026-05-30days on market $309,000 Active 371 DOM
-
2025-05-24$309,000 Active 4-char remark
Show marketing remark (4 chars)
None
ⓘ Source: listings_history table (triggers on properties + properties_extension) + one-shot
backfill from property_details.listing_events for pre-trigger history.
Nearby sold comps map
Loading sold comps map…
Walkable amenities ~0.75 mi
Loading nearby amenities…
Taxation est. · year 1
- Rental income
- $32,179
- − Mortgage interest
- −$17,243
- − Property taxes
- −$4,617
- − Insurance
- −$1,539
- − Repairs & maintenance
- −$2,574
- − Management
- −$2,574
- − Depreciation
- −$8,955
- Taxable loss
- −$5,324
- Est. tax savings @ 24.0%
- +$1,278
- After-tax cash flow
- $1,172/yr
For passive investors: Depreciation is non-cash, so a rental often shows a tax loss while cash-flowing — sheltering income. Rental losses are passive: they offset passive income freely, and up to $25,000/yr can offset ordinary (W-2) income if you actively participate and your MAGI is under $100k (phasing out to $0 by $150k); unused losses carry forward. On sale, claimed depreciation is recaptured at up to 25%, and gains may owe capital-gains tax (a 1031 exchange can defer both). Figures are a year-1 estimate at your 24.0% rate — not tax advice; consult a CPA.
Condition & rehab AI · 2 photos
This home is in excellent condition with no visible repairs or maintenance needed. It is move-in ready and would benefit from minor aesthetic updates to further enhance its value.
Value-add opportunities
- Both Painting exterior and interior — Enhances curb appeal and interior aesthetics
- Both Landscaping improvements — Enhances curb appeal and adds value
- Both New flooring in bathrooms and kitchen — Improves functionality and aesthetics
Renovation cost estimate screening
Value-add ROI direction
- Both Painting exterior and interior — Enhances curb appeal and interior aesthetics ↑
- Both Landscaping improvements — Enhances curb appeal and adds value ↑
- Both New flooring in bathrooms and kitchen — Improves functionality and aesthetics ↑
ⓘ Cost ranges are severity-bucket heuristics (US national rule-of-thumb). Get contractor quotes + a written scope before underwriting a rehab budget.
Schools (NCES district)
- District
- Lafayette Parish
- NCES district ID
- 2200870
- Math proficiency
- 38% ▼ -32.00%
- Reading proficiency
- 46% ▼ -24.00%
- Median HH income
- $50,238
- Composite
- 36.15/100
- National rank
- #4741
- State rank
- #19 of 98 in LA
Livability — Youngsville
- Score
- 78/100
- State rank
- #8
- US rank
- #2614
Category grades
Schools grade is shown separately in the Schools card above.
Census & demographics
- Census place
- Youngsville, LA
- County
- Lafayette Parish · 207,544 people
- City population
- 32,167
- Metro
- Lafayette, LA
- Population (ZIP)
- 32,167
- Household income
- $93,204
- Rent vs Own
- Severe rent burden
- 424.0
Population outlook (Lafayette County) Hauer SSP2
- Today (2025)
- 280,930 people
- By 2030
- 301,092 · +7.2%
- By 2040
- 339,456 · +20.8%
- By 2050
- 375,156 · +33.5%
- By 2075
- 451,672 · +60.8%
- By 2100
- 497,203 · +77.0%
Race, ethnicity, and origin ACS 2023
- Neighborhood character
- Predominantly White (82%)
- Race & ethnicity
- White 82% Black 10% Two or more races 5% Hispanic / Latino 4% Asian 1%
- Common ancestry
- Lithuanian 24% Romanian 3% Italian 1%
- Foreign-born
- 3% · Canada
- Languages at home
- 94% English-only · French/Haitian/Cajun 3% Spanish 2%
Political lean MEDSL · Lafayette
- 2024 margin
- Solid R (+31.4) · D 33.5% · R 64.8% · Other 1.7%
- 2008→2024 swing
- -0.1pp no change · 2008: -31.3pp · 2024: -31.4pp
- All cycles
- 2024: R+31.4 2020: R+28.7 2016: R+33.6 2012: R+33.7 2008: R+31.3
Not yet ingested
- Civics
- —
Market trends
- HPI YoY
- ▼ -41.24%
- Current HPI
- 135.2825
- Rent YoY
- ▲ 1.65%
- Metro
- Lafayette, LA
- State GDP YoY
- ▲ 3.29%
- F500 in state
- 10
Industry mix (Fortune 500 HQ in LA)
| Industry | F500 HQs | Revenue |
|---|---|---|
| Telecommunications | 2 | $23B |
|
||
| Utilities | 1 | $12B |
|
||
| Wholesale / Distribution | 1 | $5B |
|
||
| Advertising | 1 | $2B |
|
||
Price history
1 event — show timeline
- 2025-05-24 Listed $309,000 Zillow
Cash-flow waterfall
monthlySold comps — $/sqft
last 12 mo · ≤1 miLoading sold comps…