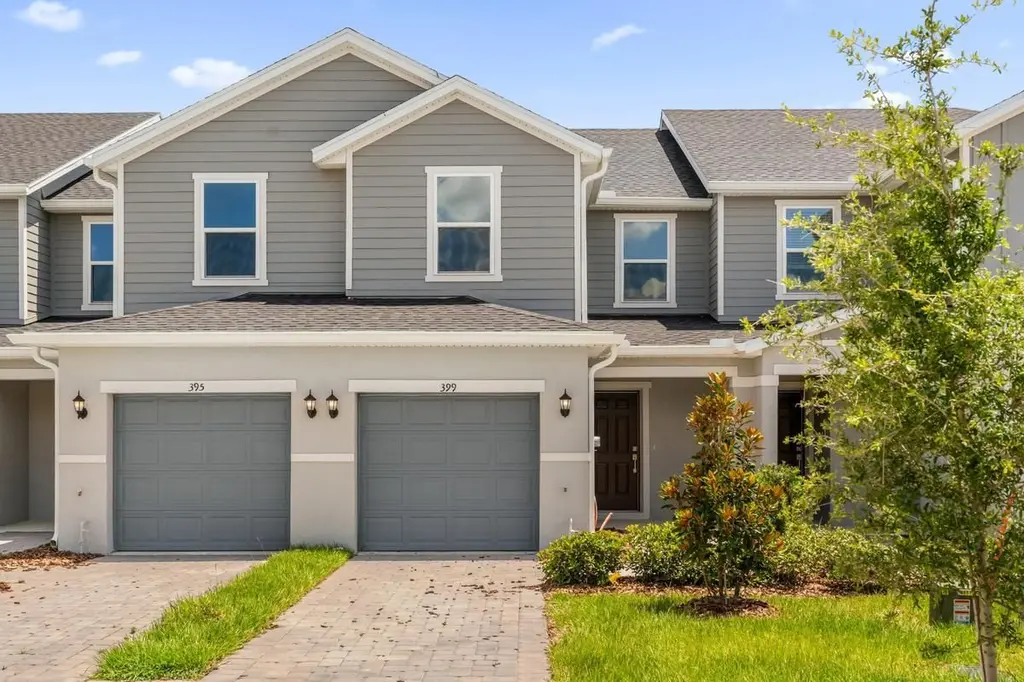
399 Sequoia Dr · Lake Wales, FL
Flood risk No data
- FEMA flood zone
- —
- Chance of flooding over 30 yrs
- —
- Est. flood insurance / yr
- —
Fire risk No data
- Est. fire insurance / yr
- —
Heat risk No data
- Hot days now (above threshold)
- —
- Hot days in 30 yrs
- —
Wind risk No data
- Chance of severe wind over 30 yrs
- —
Air-quality risk No data
- Unhealthy air days now
- —
- Unhealthy air days in 30 yrs
- —
Risk factors via First Street. Map © Google.
Why this score? — see what drove the D- grade
The composite is a weighted blend of 9 inputs, each scored 0–100. Each bar is that input's sub-score; the figure is the points it added to the 100-point composite (weight × sub-score).
- Cash flow +11.6/30.0
- ARV discount +7.5/15.0
- Condition / age +4.0/5.0
- Schools +3.5/10.0
- 1% rule +3.4/10.0
- DSCR +3.4/10.0
- Livability +3.4/5.0
- Rent growth +2.5/5.0
- Appreciation +0.0/10.0
$237,896
🖨 Deal sheet 📄 Offer letter ✓ Due diligence
Listing remarks
This lovely, two-story home showcases an open floor plan with stylish tile flooring and a spacious great room. The kitchen is equipped with 36-in. upper cabinets, granite countertops, a breakfast bar, pantry, a sleek Moen® faucet and Whirlpool® stainless steel appliances. Upstairs, enjoy the convenience of a dedicated laundry room. The primary suite features a walk-in closet and connecting bath that offers a dual-sink vanity and walk-in shower with tile surround.
Key facts
- Open floor plan
- Tile flooring
- Great room
Tags
Property features AI
Finance
- Other: Address: 399 Sequoia Dr, Lake Wales FL 33859; Last updated: 2026-05-21
- Financial info: Listing status: Active; List price: 237896
Exterior
- Parking: 1 covered garage space (1 total parking space)
- Home design: Single-family townhome style (new construction)
- Exterior features: Living area approximately 1463
Interior
- Bedrooms: 3 bedrooms
- Bathrooms: 2 full bathrooms and 1 half bathroom (2.5 total)
- Interior features: Spec new-construction home (Plan 1463 Modeled)
Neighborhood map
What this means for you Summary
Snapshot
- This is a 3-bed/2.5-bath townhouse listed at $238k. Condition is rated good.
Deal economics
- At list price, monthly cash flow is $-74 ($-885/yr) — negative.
- To cash-flow at today's rent, offer at most $227k (4.5% below list).
- To meet the 1% rule (rent ≥ 1% of price), the offer needs to be $199k (16.4% below list).
- Recommended offer: $199k (16.4% below list) — sets the bar for 1% rule.
Location & tenants
- Location reads 68/100 on livability (#535 in FL) — a middle-class / working-renter tenant base. Strengths: cost of living A+, housing A+; Watch: employment D+, schools D, amenities F.
- Polk (suburban): math 39% / reading 43% proficiency, ranked #62 of 73 in FL (top 85%) — families likely to look elsewhere, expect single-tenant / working-renter base with shorter leases.
- Market conditions: 261 active listings in the ZIP; 12 comparable units currently listed for rent nearby; rentals at typical pace (median 14d on market — plan ~3-4 weeks tenant-placement turnaround); 10,384 units permitted in Polk County in 2024 (1,716 in 5+ unit buildings).
- This rent runs 41% of the median local income ($58k/yr) — at the standard rent-burdened threshold; future hikes will face affordability resistance.
Forward outlook
- Local home prices are declining (-3.0%/yr); year-one equity from $2k of loan paydown is wiped out by about $7k of value loss. Plan a longer hold.
- Polk County population projected at +33% by 2050 — long-run rental-demand tailwind backs the buy-and-hold thesis.
Negotiation context
- It's been on market 77 days — a 6% lower offer ($224k) is reasonable based on typical stale-listing flexibility.
Questions for the listing agent
- What do current leases actually rent for vs. the listed asking? Can we see a recent rent roll and the last 12 months of T-12 income?
- It's been on market 77 days. Have you received any prior offers? Is the seller open to a 16% concession, seller financing, or rate buy-down credit?
- Why hasn't it sold? Are there any deal-killer items the seller is aware of (foundation, flood, title, zoning, code violations)?
- Is there a deadline driving the sale (1031 exchange, divorce, estate, relocation)? That informs how much negotiation room exists.
- Schools are D-rated, which usually means shorter tenancies and higher turnover. Who's the typical renter profile here, and what's been the actual vacancy rate?
- The area grade is low — what's the realistic commute time and amenity access for the typical tenant pool here? Any planned neighborhood developments (good or bad) we should know about?
- What's the average days-on-market for RENTAL listings here right now (not sales)? A rising rental-DOM trend means longer vacancies and softer asking-rent achievability than the comps imply.
- What's the recent tenant-quality profile in this submarket — average credit score on applications, eviction rate, late-payment / NSF rate, and stable-employment percentage? A property-management company in the area should have these aggregated.
- How much new for-sale + rental construction is in the pipeline within 1–3 miles? Heavy new supply typically softens prices + rents 12–24 months out; constrained supply supports both.
Investment metrics
- 1% rule
- 0.84% ✗
- Cap rate
- 5.92%
- Cash-on-cash
- -1.33%
- DSCR
- 0.94
- GRM
- 10.0
CMA / ARV
No comps found within radius.
Projected returns pro-forma
-3.0% appreciation · 3.0% rent growth · sell at horizon
- IRR
- -18.5%
- Equity multiple
- 0.35×
- Total profit
- $-43,216
- Equity at exit
- $35,471
- IRR
- -10.8%
- Equity multiple
- 0.35×
- Total profit
- $-43,558
- Equity at exit
- $20,569
Cash invested: $66,611 (down + closing). Projections, not guarantees.
Landlord ↔ Tenant lean methodology
- Overall (STATE)
- 87 Strongly Landlord-Friendly
- State Florida
- 87 Strongly Landlord-Friendly · R+3
- County
- — inherits STATE
- City
- — inherits STATE
ZIP-level market 33859
- Home prices YoY
- -16.6%
- Active inventory
- 261
- Price-to-rent
- 10.0×
Monthly cashflow live
- Estimated rent
- $1,988 high interval (Pro) →
- Mortgage (P&I)
- −$1,248
- Tax est. 1.5%
- −$297 /mo · $3,568/yr
- Insurance
- −$99
- HOA
- −$0
- Vacancy / Maint / Mgmt
- −$417
- Net cashflow
- $-74
Break-even live
UW: 25.0% down · 7.5% · 30yr · 1.5% tax · 5.0% vac · 8.0% maint · 8.0% mgmt
Financing live
Cash to close
- Down payment
- $59,474
- Closing costs
- $7,137
- Reserves months
- —
- Total cash needed
- —
Loan-product check · same deal, 3 products live
Conventional
25% down · 7.5% · 30yr
- Down + closing
- —
- Monthly P&I
- —
- Monthly cashflow
- —
- DSCR
- —
- Eligible?
- —
Personal DTI + credit; lowest rate.
DSCR
20% down · 8.5% · 30yr
- Down + closing
- —
- Monthly P&I
- —
- Monthly cashflow
- —
- DSCR
- —
- Eligible?
- —
No personal income docs; deal must DSCR.
Hard money
10% down · 12.0% · 12mo
- Down + closing
- —
- Monthly P&I
- —
- Monthly cashflow
- —
- DSCR
- —
- Eligible?
- —
Short-term bridge; refi at stabilization.
Rent comps 12 comps
| Address | Beds | Baths | Sqft | Rent | $/sqft | DOM | Units | Dist |
|---|---|---|---|---|---|---|---|---|
| 260 Lake Suzanne Dr Lake Wales, FL | 2.0 | 2.0 | 1321 | $1,650 | $1.25 | 23d | 1 | 0.28mi |
| 437 Singing Sands Cir Lake Wales, FL | 3.0 | 2.0 | 1555 | $1,950 | $1.25 | 14d | 1 | 0.40mi |
| 413 Singing Sands Cir Lake Wales, FL | 4.0 | 2.0 | 1817 | $1,950 | $1.07 | 3d | 1 | 0.42mi |
| 338 Rustic Rail Dr Lake Wales, FL | 4.0 | 2.0 | 1841 | $2,150 | $1.17 | 14d | 1 | 0.44mi |
| 346 Rustic Rail Dr Lake Wales, FL | 4.0 | 2.0 | 1844 | $2,150 | $1.17 | 14d | 1 | 0.46mi |
| 199 Dinner Lake Loop Lake Wales, FL | 3.0 | 2.0 | 1599 | $1,800 | $1.13 | 14d | 1 | 0.47mi |
| 105 Serenity Loop Unit 5-302 Lake Wales, FL | 2.0 | 2.0 | 1095 | $2,305 | $2.11 | 23d | 1 | 0.68mi |
| 105 Serenity Lp Lake Wales, FL | 1.0–3.0 | 1.0–2.0 | 1007 | $2,245 | $2.23 | 3d | 100 | 0.68mi |
| 243 C F Kinney Rd Lake Wales, FL | 3.0 | 2.0 | 1600 | $2,600 | $1.62 | 21d | 1 | 0.69mi |
| 343 Dinner Lake Ct Lake Wales, FL | 4.0 | 2.0 | 1801 | $2,400 | $1.33 | 14d | 1 | 0.73mi |
| 315 Dinner Lake Ct Lake Wales, FL | 3.0 | 2.0 | 1405 | $2,000 | $1.42 | 23d | 1 | 0.83mi |
| 474 Hennepin Loop Lake Wales, FL | 3.0 | 2.0 | 1589 | $1,850 | $1.16 | 23d | 1 | 1.13mi |
Listing history 13 events
-
2026-06-18days on market $237,896 Active 77 DOM
-
2026-06-17days on market $237,896 Active 76 DOM
-
2026-06-16days on market $237,896 Active 75 DOM
-
2026-06-15days on market $237,896 Active 74 DOM
-
2026-06-13days on market $237,896 Active 72 DOM
-
2026-06-10days on market $237,896 Active 69 DOM
-
2026-06-09days on market $237,896 Active 68 DOM
-
2026-06-08days on market $237,896 Active 67 DOM
-
2026-06-07days on market $237,896 Active 66 DOM
-
2026-06-05days on market $237,896 Active 63 DOM
-
2026-06-03days on market $237,896 Active 61 DOM
-
2026-06-01days on market $237,896 Active 60 DOM
-
2026-05-31days on market $237,896 Active 59 DOM
ⓘ Source: listings_history table (triggers on properties + properties_extension) + one-shot
backfill from property_details.listing_events for pre-trigger history.
Nearby sold comps map
Loading sold comps map…
Walkable amenities ~0.75 mi
Loading nearby amenities…
Taxation est. · year 1
- Rental income
- $23,853
- − Mortgage interest
- −$13,326
- − Property taxes
- −$3,568
- − Insurance
- −$1,189
- − Repairs & maintenance
- −$1,908
- − Management
- −$1,908
- − Depreciation
- −$6,921
- Taxable loss
- −$4,968
- Est. tax savings @ 24.0%
- +$1,192
- After-tax cash flow
- $307/yr
For passive investors: Depreciation is non-cash, so a rental often shows a tax loss while cash-flowing — sheltering income. Rental losses are passive: they offset passive income freely, and up to $25,000/yr can offset ordinary (W-2) income if you actively participate and your MAGI is under $100k (phasing out to $0 by $150k); unused losses carry forward. On sale, claimed depreciation is recaptured at up to 25%, and gains may owe capital-gains tax (a 1031 exchange can defer both). Figures are a year-1 estimate at your 24.0% rate — not tax advice; consult a CPA.
Condition & rehab AI · 1 photo
This two-story townhouse is in good condition with a good condition score of 80. It is move-in ready with a cosmetic rehab level, requiring minor maintenance such as painting exterior trim and possibly replacing landscaping to further enhance its value.
Value-add opportunities
- Resale Paint exterior trim — Fresh paint can enhance curb appeal and home value
- Rental Replace landscaping — Well-maintained landscaping can attract tenants and increase rental value
Renovation cost estimate screening
Value-add ROI direction
- Resale Paint exterior trim — Fresh paint can enhance curb appeal and home value ↑
- Rental Replace landscaping — Well-maintained landscaping can attract tenants and increase rental value ↑
ⓘ Cost ranges are severity-bucket heuristics (US national rule-of-thumb). Get contractor quotes + a written scope before underwriting a rehab budget.
Schools (NCES district)
- District
- Polk
- NCES district ID
- 1201590
- Math proficiency
- 39% ▼ -11.00%
- Reading proficiency
- 43% ▼ -4.00%
- Median HH income
- $43,979
- Composite
- 34.74/100
- National rank
- #5132
- State rank
- #62 of 73 in FL
Livability — Lake Wales
- Score
- 68/100
- State rank
- #535
- US rank
- #10036
Category grades
Schools grade is shown separately in the Schools card above.
Census & demographics
- Census place
- Lake Wales, FL
- County
- Polk County · 740,051 people
- City population
- 30,351
- Metro
- Lakeland-Winter Haven, FL
- Population (ZIP)
- 11,824
- Household income
- $57,760
- Rent vs Own
- Severe rent burden
- 408.0
Population outlook (Polk County) Hauer SSP2
- Today (2025)
- 752,975 people
- By 2030
- 804,621 · +6.9%
- By 2040
- 906,117 · +20.3%
- By 2050
- 1,000,476 · +32.9%
- By 2075
- 1,197,520 · +59.0%
- By 2100
- 1,271,518 · +68.9%
Race, ethnicity, and origin ACS 2023
- Neighborhood character
- Majority White (61%)
- Race & ethnicity
- White 61% Hispanic / Latino 25% Two or more races 13% Black 11%
- Hispanic origin (detail)
- Mexican 11% Puerto Rican 6% Cuban 1% Dominican 4%
- Common ancestry
- Lithuanian 2% Romanian 1% Serbian 1%
- Foreign-born
- 10% · Canada
- Languages at home
- 79% English-only · Spanish 19% French/Haitian/Cajun 1%
Political lean MEDSL · Polk
- 2024 margin
- Strong R (+20.7) · D 39.2% · R 59.9%
- 2008→2024 swing
- -14.6pp toward R · 2008: -6.1pp · 2024: -20.7pp
- All cycles
- 2024: R+20.7 2020: R+14.4 2016: R+14.1 2012: R+6.8 2008: R+6.1
Not yet ingested
- Civics
- —
Market trends
- HPI YoY
- ▼ -53.19%
- Current HPI
- 267.4537
- Rent YoY
- —
- Metro
- Lakeland-Winter Haven, FL
- State GDP YoY
- ▲ 3.28%
- F500 in state
- 36
Industry mix (Fortune 500 HQ in FL)
| Industry | F500 HQs | Revenue |
|---|---|---|
| Industrial Technology | 2 | $29B |
|
||
| Insurance | 2 | $17B |
|
||
| Retail | 1 | $60B |
|
||
| Technology Distribution | 1 | $58B |
|
||
| Homebuilding | 1 | $35B |
|
||
| Technology Manufacturing | 1 | $35B |
|
||
Cash-flow waterfall
monthlySold comps — $/sqft
last 12 mo · ≤1 miLoading sold comps…