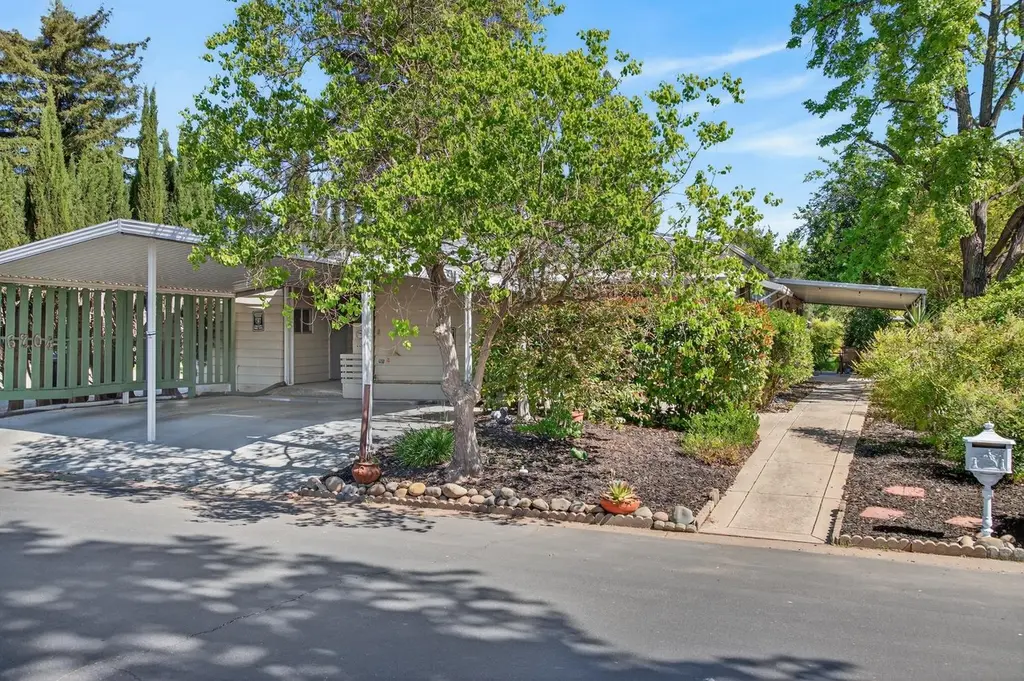
6704 Alden Ln · Citrus Heights, CA
Flood risk 1/10 · Minimal
- FEMA flood zone
- X (unshaded)
- Chance of flooding over 30 yrs
- 0.0%
- Est. flood insurance / yr
- $507 – $1,088
Fire risk 1/10 · Minimal
- Est. fire insurance / yr
- $659 – $1,223
Heat risk 7/10 · Major
- Hot days now (above 102°F)
- 7 days/yr
- Hot days in 30 yrs
- 16 days/yr
Wind risk 1/10 · Minimal
- Chance of severe wind over 30 yrs
- —
Air-quality risk 10/10 · Severe
- Unhealthy air days now
- 34 days/yr
- Unhealthy air days in 30 yrs
- 36 days/yr
Risk factors via First Street. Map © Google.
Why this score? — see what drove the B grade
The composite is a weighted blend of 9 inputs, each scored 0–100. Each bar is that input's sub-score; the figure is the points it added to the 100-point composite (weight × sub-score).
- Cash flow +30.0/30.0
- DSCR +10.0/10.0
- ARV discount +9.4/15.0
- 1% rule +8.6/10.0
- Schools +4.4/10.0
- Rent growth +3.5/5.0
- Livability +3.0/5.0
- Condition / age +2.5/5.0
- Appreciation +0.0/10.0
$169,900
🖨 Deal sheet 📄 Offer letter ✓ Due diligence
Listing remarks
Welcome to Lakeview Village, a highly sought after 55+ community with tons of amenities in a parklike setting, in the heart of Citrus Heights. This home features an atypical floor plan with spacious living room and formal dining area accented by a built-in granite buffet/hutch, a separate family room with slider to outdoor area. Kitchen updates with granite counters, double oven, and lots of storage. 2 large bedrooms and updated primary bath with sunken tub and dual sinks complement the spacious home. The ground-level outdoor space is perfect for entertaining, gardening, and workshopping (2 sheds, and storage), and is also accommodating for small pets with approval. Welcome to Lakeview!
Key facts
- 2 parking spots
- Built 1975
- Listed 84 days
Neighborhood map
What this means for you Summary
Snapshot
- This is a 2-bed/2.0-bath manufactured listed at $170k.
Deal economics
- At list price, monthly cash flow is $653 ($8k/yr) — positive.
- The deal already cash-flows at list — no discount required.
- Meets the 1% rule at list price ($2k rent vs $170k).
- Recommended offer: $160k (6.0% below list) — sets the bar for market timing.
- Cap rate 10.9% vs local median 3.4% in Citrus Heights — top-decile yield for the area; either an underpriced asset or a hidden risk that comps aren't pricing in. Stress-test before assuming the spread holds.
Location & tenants
- Location reads 60/100 on livability (#614 in CA) — a middle-class / working-renter tenant base. Strengths: housing A+; Watch: schools D, crime D-, amenities F.
- San Juan Unified (suburban): math 40% / reading 62% proficiency, ranked #138 of 517 in CA (top 27%) — acceptable for families but not a draw, mixed tenant base, ~2y average lease.
- Market conditions: Rents rising fast (+4.1%/yr); 159 active listings in the ZIP; 15 comparable units currently listed for rent nearby; rentals at typical pace (median 22d on market — plan ~3-4 weeks tenant-placement turnaround); solid renter incomes; 6,825 units permitted in Sacramento County in 2024 (1,752 in 5+ unit buildings).
- This rent runs 33% of the median local income ($83k/yr) — at the standard rent-burdened threshold; future hikes will face affordability resistance.
Forward outlook
- Local home prices are declining (-3.0%/yr); year-one equity from $1k of loan paydown is wiped out by about $5k of value loss. Plan a longer hold.
- Sacramento County population projected at +17% by 2050 — long-run rental-demand tailwind backs the buy-and-hold thesis.
- At projected returns (-3.0% appreciation + 4.1% rent growth), your $48k cash investment doubles in ~7 years — after that, you're playing with house money.
Negotiation context
- It's been on market 84 days — a 6% lower offer ($160k) is reasonable based on typical stale-listing flexibility.
Risks & watch-outs
- Climate carrying-cost: extreme-heat days projected 7→16/yr by 2055 (HVAC capex compounding) — expect insurance premiums to compound above CPI over the hold.
Questions for the listing agent
- It's been on market 84 days. Have you received any prior offers? Is the seller open to a 6% concession, seller financing, or rate buy-down credit?
- Built in 1975 — when were the roof, HVAC, electrical panel, plumbing, and water heater last replaced?
- Why hasn't it sold? Are there any deal-killer items the seller is aware of (foundation, flood, title, zoning, code violations)?
- Is there a deadline driving the sale (1031 exchange, divorce, estate, relocation)? That informs how much negotiation room exists.
- Schools are D-rated, which usually means shorter tenancies and higher turnover. Who's the typical renter profile here, and what's been the actual vacancy rate?
- Crime grade is D in this area — have there been break-ins, vandalism, or insurance claims at this property in the last 3 years? What carrier currently insures it and at what premium?
- What's the average days-on-market for RENTAL listings here right now (not sales)? A rising rental-DOM trend means longer vacancies and softer asking-rent achievability than the comps imply.
- What's the recent tenant-quality profile in this submarket — average credit score on applications, eviction rate, late-payment / NSF rate, and stable-employment percentage? A property-management company in the area should have these aggregated.
- How much new for-sale + rental construction is in the pipeline within 1–3 miles? Heavy new supply typically softens prices + rents 12–24 months out; constrained supply supports both.
Investment metrics
- 1% rule
- 1.36% ✓
- Cap rate
- 10.91%
- Cash-on-cash
- 16.48%
- DSCR
- 1.73
- GRM
- 6.1
CMA / ARV
- ARV (median comp)
- $177,489
- List price
- $169,900
- Delta
- 1.36%
- Verdict
- FAIR
- Comps
- 20 within 1.0 mi
Show comp detail 12 sales within ~0.75 mi
| Address | Dist | Beds/Ba | Sqft | Sold | Price | $/sf | Match |
|---|---|---|---|---|---|---|---|
| 6105 Meiggs Ct #1015 | 0.18mi | 2/2.0 | 1,645 (+3%) | 4mo | $160,000 | $97 | 83 |
| 6637 Grosse Point Ct | 0.16mi | 3/2.0 (+1) | 1,536 (-4%) | 1mo | $95,000 | $62 | 81 |
| 6845 Caywood Ct | 0.32mi | 2/2.0 | 1,536 (-4%) | 2mo | $150,000 | $98 | 77 |
| 6641 Grosse Point Ct | 0.16mi | 2/2.0 | 1,464 (-8%) | 3mo | $175,000 | $120 | 77 |
| 6912 Daisy Ln | 0.27mi | 2/2.0 | 1,707 (+7%) | 3mo | $239,500 | $140 | 74 |
| 6116 Mame Ct | 0.21mi | 2/2.0 | 1,440 (-10%) | 3mo | $179,000 | $124 | 72 |
| 6937 Grand Tree Ln | 0.32mi | 2/2.0 | 1,495 (-6%) | 6mo | $169,500 | $113 | 69 |
| 6923 Daisy Ln | 0.31mi | 2/2.0 | 1,488 (-7%) | 7mo | $155,000 | $104 | 68 |
| 6116 Mame Ct #905 | 0.21mi | 2/2.0 | 1,440 (-10%) | 8mo | $100,000 | $69 | 68 |
| 6946 Wake Forest Ln #2012 | 0.28mi | 3/2.0 (+1) | 1,792 (+12%) | 2mo | $250,000 | $140 | 60 |
| 6941 Radiance Cir | 0.34mi | 3/2.0 (+1) | 1,753 (+10%) | 7mo | $167,000 | $95 | 57 |
| 6206 Plymouth Rock Ln #110 | 0.73mi | 3/2.0 (+1) | 1,536 (-4%) | 1mo | $159,000 | $104 | 53 |
Match score weights: distance 35% · size 25% · config 20% · recency 20%. Top-matched comps best support the ARV.
Projected returns pro-forma
-3.0% appreciation · 4.09% rent growth · sell at horizon
- IRR
- 8.8%
- Equity multiple
- 1.35×
- Total profit
- $16,685
- Equity at exit
- $25,333
- IRR
- 18.9%
- Equity multiple
- 2.66×
- Total profit
- $79,019
- Equity at exit
- $14,690
Cash invested: $47,572 (down + closing). Projections, not guarantees.
Landlord ↔ Tenant lean methodology
- Overall (STATE)
- 18 Strongly Tenant-Friendly
- State California
- 18 Strongly Tenant-Friendly · D+13
- County
- — inherits STATE
- City
- — inherits STATE
ZIP-level market 95610
- Rents YoY
- 4.1%
- Active inventory
- 159
- Price-to-rent
- 6.1×
Monthly cashflow live
- Estimated rent
- $2,313 high interval (Pro) →
- Mortgage (P&I)
- −$891
- Tax est. 1.5%
- −$212 /mo · $2,548/yr
- Insurance
- −$71
- HOA
- −$0
- Vacancy / Maint / Mgmt
- −$486
- Net cashflow
- $653
Break-even live
UW: 25.0% down · 7.5% · 30yr · 1.5% tax · 5.0% vac · 8.0% maint · 8.0% mgmt
Financing live
Cash to close
- Down payment
- $42,475
- Closing costs
- $5,097
- Reserves months
- —
- Total cash needed
- —
Loan-product check · same deal, 3 products live
Conventional
25% down · 7.5% · 30yr
- Down + closing
- —
- Monthly P&I
- —
- Monthly cashflow
- —
- DSCR
- —
- Eligible?
- —
Personal DTI + credit; lowest rate.
DSCR
20% down · 8.5% · 30yr
- Down + closing
- —
- Monthly P&I
- —
- Monthly cashflow
- —
- DSCR
- —
- Eligible?
- —
No personal income docs; deal must DSCR.
Hard money
10% down · 12.0% · 12mo
- Down + closing
- —
- Monthly P&I
- —
- Monthly cashflow
- —
- DSCR
- —
- Eligible?
- —
Short-term bridge; refi at stabilization.
Rent comps 15 comps
| Address | Beds | Baths | Sqft | Rent | $/sqft | DOM | Units | Dist |
|---|---|---|---|---|---|---|---|---|
| 6319 Misty Wood Way Citrus Heights, CA | 3.0 | 2.0 | 1454 | $2,500 | $1.72 | 43d | 1 | 0.37mi |
| 6219 Oak Valley Ln Citrus Heights, CA | 3.0 | 3.0 | 1304 | $2,295 | $1.76 | 17d | 1 | 0.46mi |
| 6219 Oak Valley Ln Citrus Heights, CA | 3.0 | 2.5 | 1304 | $2,295 | $1.76 | 43d | 1 | 0.46mi |
| 6940 Trailride Way Citrus Heights, CA | 3.0 | 2.0 | 1527 | $2,695 | $1.76 | 43d | 1 | 0.54mi |
| 6203 Ackland Ct Citrus Heights, CA | 3.0 | 1.5 | 1322 | $2,500 | $1.89 | 23d | 1 | 0.65mi |
| 7120 Van Maren Ln Citrus Heights, CA | 3.0 | 2.0 | 1292 | $2,495 | $1.93 | 17d | 1 | 0.73mi |
| 6687 Greenback Ln Citrus Heights, CA | 3.0 | 2.0 | 1323 | $2,495 | $1.89 | 17d | 1 | 0.81mi |
| 7135 Cobalt Way Citrus Heights, CA | 3.0 | 1.0 | 1200 | $1,995 | $1.66 | 3d | 1 | 0.84mi |
| 6025 Dewey Dr Citrus Heights, CA | 3.0 | 2.0 | 1847 | $2,500 | $1.35 | 23d | 1 | 0.90mi |
| 6104 Rockport Ln Citrus Heights, CA | 3.0 | 2.5 | 1150 | $2,295 | $2.00 | 21d | 1 | 0.99mi |
| 6558 Meadowcreek Way Citrus Heights, CA | 3.0 | 2.0 | 1304 | $2,500 | $1.92 | 43d | 1 | 1.00mi |
| 7139 Baranga Dr Citrus Heights, CA | 3.0 | 1.5 | 1162 | $2,500 | $2.15 | 1d | 1 | 1.00mi |
| 7024 San Altos Cir Citrus Heights, CA | 2.0 | 2.0 | 1120 | $2,800 | $2.50 | 43d | 1 | 1.04mi |
| 7323 Chivalry Way Citrus Heights, CA | 2.0 | 2.0 | 1121 | $2,095 | $1.87 | 10d | 1 | 1.29mi |
| 6635 Sylvan Rd Citrus Heights, CA | 1.0–2.0 | 1.0–2.0 | 865 | $2,120 | $2.45 | 7d | 8 | 1.44mi |
Listing history 15 events
-
2026-06-18days on market $169,900 Active 84 DOM
-
2026-06-17price $169,900 Active 83 DOM
-
2026-06-17days on market $179,900 Active 83 DOM
-
2026-06-16days on market $179,900 Active 82 DOM
-
2026-06-15days on market $179,900 Active 81 DOM
-
2026-06-13days on market $179,900 Active 79 DOM
-
2026-06-13days on market $179,900 Active 78 DOM
-
2026-06-09days on market $179,900 Active 75 DOM
-
2026-06-08days on market $179,900 Active 74 DOM
-
2026-06-07days on market $179,900 Active 73 DOM
-
2026-06-05days on market $179,900 Active 70 DOM
-
2026-06-03days on market $179,900 Active 69 DOM
-
2026-06-02days on market $179,900 Active 68 DOM
-
2026-06-01days on market $179,900 Active 67 DOM
-
2026-05-31days on market $179,900 Active 66 DOM
ⓘ Source: listings_history table (triggers on properties + properties_extension) + one-shot
backfill from property_details.listing_events for pre-trigger history.
Climate risk First Street
- Flood 1/10 Low FEMA zone X (unshaded) · 0% chance over 30 yrs
- Wildfire 1/10 Low
- Heat 7/10 Severe 7 d/yr ≥102°F today · 16 d/yr by 30 yrs out
- Wind 1/10 Low
- Air quality 10/10 Extreme 34 unhealthy d/yr today · 36 by 30 yrs out
Nearby sold comps map
Loading sold comps map…
Walkable amenities ~0.75 mi
Loading nearby amenities…
Taxation est. · year 1
- Rental income
- $27,760
- − Mortgage interest
- −$9,517
- − Property taxes
- −$2,548
- − Insurance
- −$850
- − Repairs & maintenance
- −$2,221
- − Management
- −$2,221
- − Depreciation
- −$4,943
- Taxable income
- $5,461
- Est. tax owed @ 24.0%
- −$1,311
- After-tax cash flow
- $6,530/yr
For passive investors: Depreciation is non-cash, so a rental often shows a tax loss while cash-flowing — sheltering income. Rental losses are passive: they offset passive income freely, and up to $25,000/yr can offset ordinary (W-2) income if you actively participate and your MAGI is under $100k (phasing out to $0 by $150k); unused losses carry forward. On sale, claimed depreciation is recaptured at up to 25%, and gains may owe capital-gains tax (a 1031 exchange can defer both). Figures are a year-1 estimate at your 24.0% rate — not tax advice; consult a CPA.
Schools (NCES district)
- District
- San Juan Unified
- NCES district ID
- 0634620
- Math proficiency
- 40% ▲ 3.00%
- Reading proficiency
- 62% ▲ 16.00%
- Median HH income
- $55,655
- Composite
- 44.07/100
- National rank
- #2878
- State rank
- #138 of 517 in CA
Livability — Citrus Heights
- Score
- 60/100
- State rank
- #614
- US rank
- #19580
Category grades
Schools grade is shown separately in the Schools card above.
Census & demographics
- Census place
- Citrus Heights, CA
- County
- Sacramento County · 1,539,646 people
- City population
- 89,370
- Metro
- Sacramento-Roseville-Folsom, CA
- Population (ZIP)
- 46,928
- Household income
- $83,327
- Rent vs Own
- Severe rent burden
- 1772.0
Population outlook (Sacramento County) Hauer SSP2
- Today (2025)
- 1,660,763 people
- By 2030
- 1,732,990 · +4.3%
- By 2040
- 1,855,755 · +11.7%
- By 2050
- 1,941,335 · +16.9%
- By 2075
- 2,046,162 · +23.2%
- By 2100
- 1,961,444 · +18.1%
Race, ethnicity, and origin ACS 2023
- Neighborhood character
- Predominantly White (68%)
- Race & ethnicity
- White 68% Hispanic / Latino 19% Two or more races 11% Black 3% Asian 3% Native American 1%
- Hispanic origin (detail)
- Mexican 15%
- Common ancestry
- Slovak 3% Subsaharan African 2% Lithuanian 2%
- Foreign-born
- 14% · Canada, China, Vietnam
- Languages at home
- 80% English-only · Spanish 9% Russian/Polish/Slavic 5% Other Indo-European 3%
Political lean MEDSL · Sacramento
- 2024 margin
- D (+19.7) · D 58.1% · R 38.4% · Other 3.5%
- 2008→2024 swing
- +0.7pp no change · 2008: 19.0pp · 2024: 19.7pp
- All cycles
- 2024: D+19.7 2020: D+25.3 2016: D+23.7 2012: D+16.3 2008: D+19.0
Not yet ingested
- Civics
- —
Market trends
- HPI YoY
- ▼ -367.16%
- Current HPI
- 325.0105
- Rent YoY
- ▲ 4.09%
- Metro
- Sacramento-Roseville-Folsom, CA
- State GDP YoY
- ▲ 3.21%
- F500 in state
- 116
Industry mix (Fortune 500 HQ in CA)
| Industry | F500 HQs | Revenue |
|---|---|---|
| Technology | 27 | $1,492B |
|
||
| Financial Services | 3 | $174B |
|
||
| Retail | 3 | $44B |
|
||
| Insurance | 3 | $26B |
|
||
| Media / Entertainment | 2 | $115B |
|
||
| Pharmaceuticals / Biotech | 2 | $62B |
|
||
Cash-flow waterfall
monthlySold comps — $/sqft
last 12 mo · ≤1 miLoading sold comps…