 Duplex
🌊 Lakefront
Duplex
🌊 Lakefront
920 Worcester Rd · Barre, MA
Flood risk 9/10 · Severe
- FEMA flood zone
- —
- Chance of flooding over 30 yrs
- 0.99%
- Est. flood insurance / yr
- —
Fire risk 2/10 · Minimal
- Est. fire insurance / yr
- $915 – $1,699
Heat risk 3/10 · Minor
- Hot days now (above 91°F)
- 7 days/yr
- Hot days in 30 yrs
- 17 days/yr
Wind risk 6/10 · Moderate
- Chance of severe wind over 30 yrs
- 27.0%
Air-quality risk 2/10 · Minimal
- Unhealthy air days now
- 1 days/yr
- Unhealthy air days in 30 yrs
- 2 days/yr
Risk factors via First Street. Map © Google.
Why this score? — see what drove the C+ grade
The composite is a weighted blend of 9 inputs, each scored 0–100. Each bar is that input's sub-score; the figure is the points it added to the 100-point composite (weight × sub-score).
- Cash flow +20.2/30.0
- ARV discount +15.0/15.0
- DSCR +6.4/10.0
- 1% rule +5.1/10.0
- Schools +3.9/10.0
- Livability +3.3/5.0
- Appreciation +3.1/10.0
- Rent growth +2.5/5.0
- Condition / age +2.5/5.0
$400,000
🖨 Deal sheet (PDF) 📄 Offer letter ✓ Due diligence
Multi-family units
County records classify this as Multi-Family (2-4 Unit). Listing-text estimate: 2 units. confirmed
Listing remarks
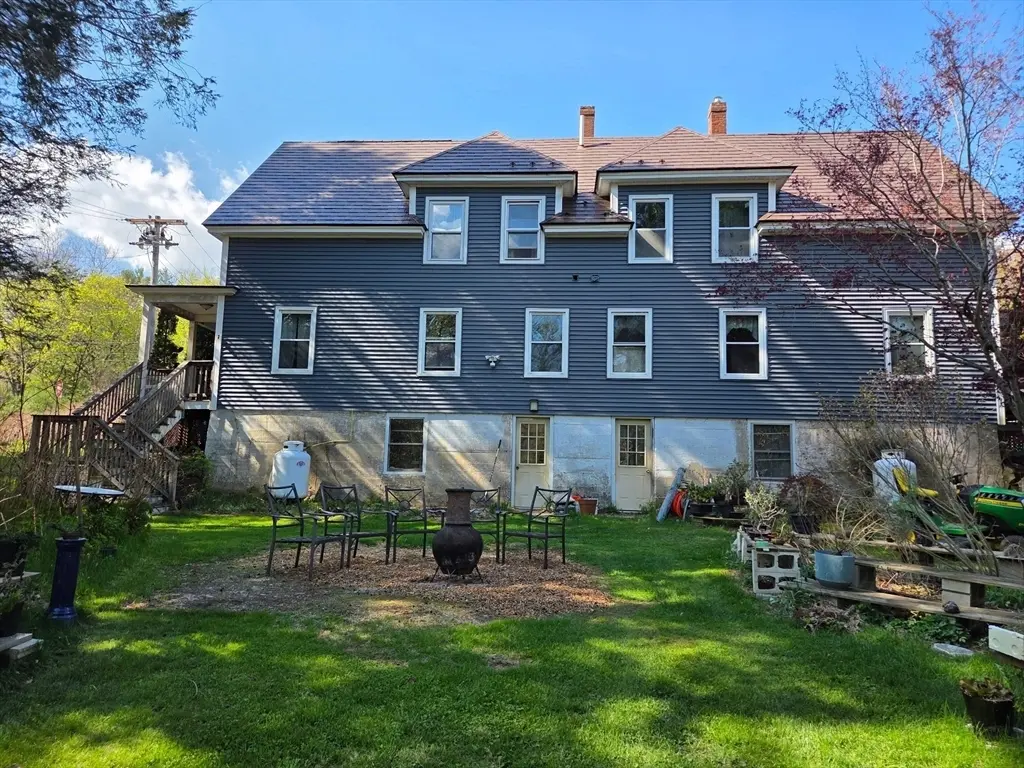
Once in a lifetime opportunity to live on the Ware River! Walk out your back door to your private back yard on 1.42 acres of land! Enjoy fishing, kayaking, paddle boarding or just relax to the sights and sounds of nature. Miles and miles of hiking trails with 1 mile of property including MA Mid-State Trail. Owners have been proud to call this property home for over 35 years! Property is a side by side 2 family. Owners side features 5 rooms with 2 bedrooms. First floor kitchen, combination living room/dining room. Second floor has 2 bedrooms and full bath with laundry. Unit B features first floor bedroom, combo liv room/ dining room and kitchen. 2 bedrooms on second floor with full bath and
Key facts
- Vinyl sided
- Metal roof
- Private back yard
Tags
Property features AI
Finance
- Other: Building area approximately 2,343 total square feet; Lot size approximately 1.42 acres
- HOA & community: Community offers shopping, walk/jog trails, stables, golf, medical facility, bike path, conservation area, house of worship, and public schools; Not a senior community
Exterior
- Parking: 2-car garage; 2 covered spaces; 6 open parking spaces; Total of 8 parking spaces; Off-street parking; Common parking area with stone/gravel and unpaved surfaces
- Utilities: Public water; Public sewer; Electric service with circuit breakers
- Home design: 2-family side-by-side property; 4 stories; Has waterview (river)
- Construction: Frame construction; Shingle and metal roof; Concrete perimeter foundation; Built (year from public records, actual/approximate)
- Exterior features: Deck (wood); Balcony/deck; Garden; Shed(s); Scenic river views; Waterfront with private river frontage and direct access; Property provides beach access within 0–1/10 mile; Lot is cleared and level; Located in a flood plain and has easements; Paved public road frontage on a publicly maintained road
Interior
- Kitchen: Range; Microwave; Refrigerator
- Bedrooms: Two units (Unit 1 and Unit 2) each span multiple levels
- Flooring: Wood and hardwood floors
- Bathrooms: 2 full bathrooms
- Heating & cooling: Has heating; Electric and natural gas heating; Unit-controlled heating; Propane available
- Interior features: Ceiling fans; High-speed internet; Living room; Dining room; Living room / dining room combo; Bathroom with tub and shower; Insulated doors; Insulated windows with screens; Total of 10 rooms
- Laundry & utility: Washer hookup; Electric dryer hookup; Washer and dryer included
Neighborhood map
What this means for you Summary
Snapshot
- This is a 2 × 2-bed/1.0-bath units multifamily listed at $400k.
Deal economics
- At list price, monthly cash flow is $503 ($6k/yr) — positive. Per door: $251/mo.
- The deal already cash-flows at list — no discount required.
- Meets the 1% rule at list price ($4k rent vs $400k).
- Recommended offer: $394k (1.5% below list) — sets the bar for market timing.
- Cap rate 7.8% vs local median 3.9% in Barre — top-decile yield for the area; either an underpriced asset or a hidden risk that comps aren't pricing in. Stress-test before assuming the spread holds.
Location & tenants
- Location reads 66/100 on livability (#177 in MA) — a middle-class / working-renter tenant base. Strengths: housing A+, health & safety A+, crime B; Watch: amenities F, commute F.
- Quabbin (rural): math 40% / reading 46% proficiency, ranked #169 of 302 in MA (top 56%) — families likely to look elsewhere, expect single-tenant / working-renter base with shorter leases.
- Zoned schools: Quabbin Regional Middle School (math 36% / reading 39%, grade F, #158 of 305 statewide, top 53%, 517 students, 0% FRL); Quabbin Regional High School (math 67% / reading 77%, grade B+, #70 of 343 statewide, top 22%, 566 students, 0% FRL) — zoned schools average 0% FRL vs 22% district-wide (22 pts lower); this property's tenant base skews higher-income than the district average.
- Market conditions: 14 active listings in the ZIP; 2,293 units permitted in Worcester County in 2024 (1,205 in 5+ unit buildings).
Forward outlook
- Local home prices are declining (-3.0%/yr); year-one equity from $3k of loan paydown is wiped out by about $12k of value loss. Plan a longer hold.
Negotiation context
- It's been on market 27 days — a 2% lower offer ($394k) is reasonable based on typical stale-listing flexibility.
Risks & watch-outs
- Watch-outs: built in 1925 — expect roof / HVAC / electrical / plumbing capex.
- Climate carrying-cost: severe flood risk; major wind risk, 27% chance of damaging wind over 30y — expect insurance premiums to compound above CPI over the hold.
Questions for the listing agent
- Can we see the unit-by-unit rent roll, current vacancy, and any below-market leases? What's the average tenancy length?
- What capital expenditures (roof, boiler, parking lot, exteriors) have been made in the last 5 years, and what's planned in the next 2?
- Built in 1925 — when were the roof, HVAC, electrical panel, plumbing, and water heater last replaced?
- Is there a deadline driving the sale (1031 exchange, divorce, estate, relocation)? That informs how much negotiation room exists.
- Schools are B-rated — typically a magnet for longer-tenancy family renters. What's the average tenant stay here, and is there a school-zone premium baked into asking?
- This sits on a lake — are riparian / water-frontage rights deeded with the parcel? Any dock permits, shoreline easements, or HOA water-use restrictions?
- What's the documented flood / surge / shoreline-erosion history here (FEMA AND non-FEMA — e.g., storm surge, creek backup, septic-field saturation)?
- Any water-quality or seasonal algae-bloom issues that affect tenant satisfaction or short-term-rental demand?
- What's the average days-on-market for RENTAL listings here right now (not sales)? A rising rental-DOM trend means longer vacancies and softer asking-rent achievability than the comps imply.
- What's the recent tenant-quality profile in this submarket — average credit score on applications, eviction rate, late-payment / NSF rate, and stable-employment percentage? A property-management company in the area should have these aggregated.
- How much new apartment / multifamily construction is in the pipeline within 1–3 miles? Heavy new supply (>2% of stock underway) typically softens rents 12–24 months out; light construction supports rent growth.
Investment metrics
- 1% rule
- 1.01% ✓
- Cap rate
- 7.80%
- Cash-on-cash
- 5.39%
- DSCR
- 1.24
- GRM
- 8.3
CMA / ARV
- ARV (on-the-fly)
- $483,947
- Comps found
- 3
Show comp detail 3 sales within ~0.75 mi
| Address | Dist | Beds/Ba | Sqft | Sold | Price | $/sf | Match |
|---|---|---|---|---|---|---|---|
| 130-132 School St | 1.27mi | 6/2.0 (+1) | 2,328 (-1%) | 3mo | $235,000 | $101 | 57 |
| 52-54 High St S | 1.18mi | 5/2.0 | 2,508 (+7%) | 9mo | $405,000 | $161 | 46 |
| 20-24 Church St | 0.88mi | 6/2.0 (+1) | 2,688 (+15%) | 11mo | $410,000 | $153 | 26 |
Match score weights: distance 35% · size 25% · config 20% · recency 20%. Top-matched comps best support the ARV.
Projected returns pro-forma
-3.0% appreciation · 3.0% rent growth · sell at horizon
- IRR
- -7.9%
- Equity multiple
- 0.71×
- Total profit
- $-32,775
- Equity at exit
- $59,641
- IRR
- 1.6%
- Equity multiple
- 1.11×
- Total profit
- $12,746
- Equity at exit
- $34,585
Cash invested: $112,000 (down + closing). Projections, not guarantees.
Landlord ↔ Tenant lean methodology
- Overall (STATE)
- 20 Strongly Tenant-Friendly
- State Massachusetts
- 20 Strongly Tenant-Friendly · D+15
- County
- — inherits STATE
- City
- — inherits STATE
ZIP-level market 01005
- Home prices YoY
- -1.2%
- Active inventory
- 14
- Price-to-rent
- 16.5×
Monthly cashflow live
- Estimated rent
- $4,031 medium interval (Pro) →
- Mortgage (P&I)
- −$2,098
- Tax from tax record
- −$417 /mo · $5,007/yr
- Insurance
- −$167
- HOA
- −$0
- Lot rent
- −$0
- Vacancy / Maint / Mgmt
- −$847
- Net cashflow
- $503
Break-even live
Sensitivity live
| Price | -10% $729 | -5% $616 | +0% $503 | +5% $390 | +10% $276 |
|---|---|---|---|---|---|
| Rent | -10% $184 | -5% $344 | +0% $503 | +5% $662 | +10% $821 |
| Rate | -1.0pp $704 | -0.5pp $605 | base $503 | +0.5pp $399 | +1.0pp $294 |
2-unit breakdown (identical units grouped — click to expand)
| Units | Beds | Baths | Est. rent |
|---|---|---|---|
| 2× units | 2 | 1 | $4,032 |
| #1 | 2 | 1 | $2,016 |
| #2 | 2 | 1 | $2,016 |
| Total (2 units) | $4,031 | ||
UW: 25.0% down · 7.5% · 30yr · 1.5% tax · 5.0% vac · 8.0% maint · 8.0% mgmt
Financing live
Cash to close
- Down payment
- $100,000
- Closing costs
- $12,000
- Reserves months
- —
- Total cash needed
- —
Loan-product check · same deal, 3 products live
Conventional
25% down · 7.5% · 30yr
- Down + closing
- —
- Monthly P&I
- —
- Monthly cashflow
- —
- DSCR
- —
- Eligible?
- —
Personal DTI + credit; lowest rate.
DSCR
20% down · 8.5% · 30yr
- Down + closing
- —
- Monthly P&I
- —
- Monthly cashflow
- —
- DSCR
- —
- Eligible?
- —
No personal income docs; deal must DSCR.
Hard money
10% down · 12.0% · 12mo
- Down + closing
- —
- Monthly P&I
- —
- Monthly cashflow
- —
- DSCR
- —
- Eligible?
- —
Short-term bridge; refi at stabilization.
Listing history 17 events
-
2026-06-22days on market $400,000 Active 27 DOM
-
2026-06-18days on market $400,000 Active 24 DOM
-
2026-06-17days on market $400,000 Active 23 DOM
-
2026-06-16days on market $400,000 Active 22 DOM
-
2026-06-15days on market $400,000 Active 21 DOM
-
2026-06-14days on market $400,000 Active 19 DOM
-
2026-06-10days on market $400,000 Active 16 DOM
-
2026-06-09days on market $400,000 Active 15 DOM
-
2026-06-08days on market $400,000 Active 14 DOM
-
2026-06-07days on market $400,000 Active 13 DOM
-
2026-06-05days on market $400,000 Active 10 DOM
-
2026-06-03days on market $400,000 Active 9 DOM
-
2026-06-02days on market $400,000 Active 8 DOM
-
2026-06-01days on market $400,000 Active 7 DOM
-
2026-05-31days on market $400,000 Active 6 DOM
-
2026-05-31days on market $400,000 Active 5 DOM
-
2026-05-25$400,000 New
ⓘ Source: listings_history table (triggers on properties + properties_extension) + one-shot
backfill from property_details.listing_events for pre-trigger history.
Tax reassessment forecast MA · Partial reset (capped growth)
- Current annual tax
- $5,007 · $417/mo
- Projected year-2 tax
- $5,007 · $417/mo
- Expected delta
- $0/yr ($0/mo · 0.0%)
ⓘ Screening estimate from a state-policy table — verify with the county assessor before closing.
Climate risk First Street
- Flood 9/10 Extreme 99% chance over 30 yrs
- Wildfire 2/10 Low
- Heat 3/10 Moderate 7 d/yr ≥91°F today · 17 d/yr by 30 yrs out
- Wind 6/10 Major 27% chance of damaging wind over 30 yrs
- Air quality 2/10 Low 1 unhealthy d/yr today · 2 by 30 yrs out
Nearby sold comps map
Loading sold comps map…
Walkable amenities ~0.75 mi
Loading nearby amenities…
Taxation est. · year 1
- Rental income
- $48,372
- − Mortgage interest
- −$22,406
- − Property taxes
- −$5,007
- − Insurance
- −$2,000
- − Repairs & maintenance
- −$3,870
- − Management
- −$3,870
- − Depreciation
- −$11,636
- Taxable loss
- −$417
- Est. tax savings @ 24.0%
- +$100
- After-tax cash flow
- $6,135/yr
For passive investors: Depreciation is non-cash, so a rental often shows a tax loss while cash-flowing — sheltering income. Rental losses are passive: they offset passive income freely, and up to $25,000/yr can offset ordinary (W-2) income if you actively participate and your MAGI is under $100k (phasing out to $0 by $150k); unused losses carry forward. On sale, claimed depreciation is recaptured at up to 25%, and gains may owe capital-gains tax (a 1031 exchange can defer both). Figures are a year-1 estimate at your 24.0% rate — not tax advice; consult a CPA.
Schools (NCES district)
- District
- Quabbin
- NCES district ID
- 2500001
- Math proficiency
- 40% ▼ -8.00%
- Reading proficiency
- 46% ▼ -4.00%
- Median HH income
- $71,895
- Composite
- 39.06/100
- National rank
- #4057
- State rank
- #169 of 302 in MA
Livability — Barre
- Score
- 66/100
- State rank
- #177
- US rank
- #12231
Category grades
Schools grade is shown separately in the Schools card above.
Census & demographics
- City population
- 4,786
- Population (ZIP)
- 4,786
Population outlook (Worcester County) Hauer SSP2
- Today (2025)
- 850,858 people
- By 2030
- 860,403 · +1.1%
- By 2040
- 869,902 · +2.2%
- By 2050
- 869,110 · +2.1%
- By 2075
- 870,120 · +2.3%
- By 2100
- 829,703 · -2.5%
Race, ethnicity, and origin ACS 2023
- Neighborhood character
- Predominantly White (91%)
- Race & ethnicity
- White 91% Hispanic / Latino 6% Two or more races 6% Black 2%
- Hispanic origin (detail)
- Puerto Rican 6%
- Common ancestry
- Lithuanian 7% Romanian 4% Slovak 4%
- Foreign-born
- 3% · Canada
- Languages at home
- 98% English-only · Other Indo-European 2%
Political lean MEDSL · Worcester
- 2024 margin
- D (+10.0) · D 53.9% · R 43.9% · Other 2.2%
- 2008→2024 swing
- -3.8pp toward R · 2008: 13.8pp · 2024: 10.0pp
- All cycles
- 2024: D+10.0 2020: D+17.8 2016: D+10.5 2012: D+9.2 2008: D+13.8
Not yet ingested
- Civics
- —
Market trends
- HPI YoY
- ▼ -3.71%
- Current HPI
- 299.3007
- Rent YoY
- —
- Metro
- —
- State GDP YoY
- ▲ 2.28%
- F500 in state
- 38
Industry mix (Fortune 500 HQ in MA)
| Industry | F500 HQs | Revenue |
|---|---|---|
| Technology | 3 | $17B |
|
||
| Insurance | 2 | $84B |
|
||
| Retail | 2 | $76B |
|
||
| Life Sciences | 1 | $43B |
|
||
| Energy Technology | 1 | $31B |
|
||
| Aerospace / Defense | 1 | $18B |
|
||
Price history
1 event — show timeline
- 2026-05-25 Listed $400,000 MLS PIN
Property tax history
+5.7%/yrLatest (2023): $5,007 · -4.9% YoY. Source: county tax records.
Cash-flow waterfall
monthlySold comps — $/sqft
last 12 mo · ≤1 miLoading sold comps…