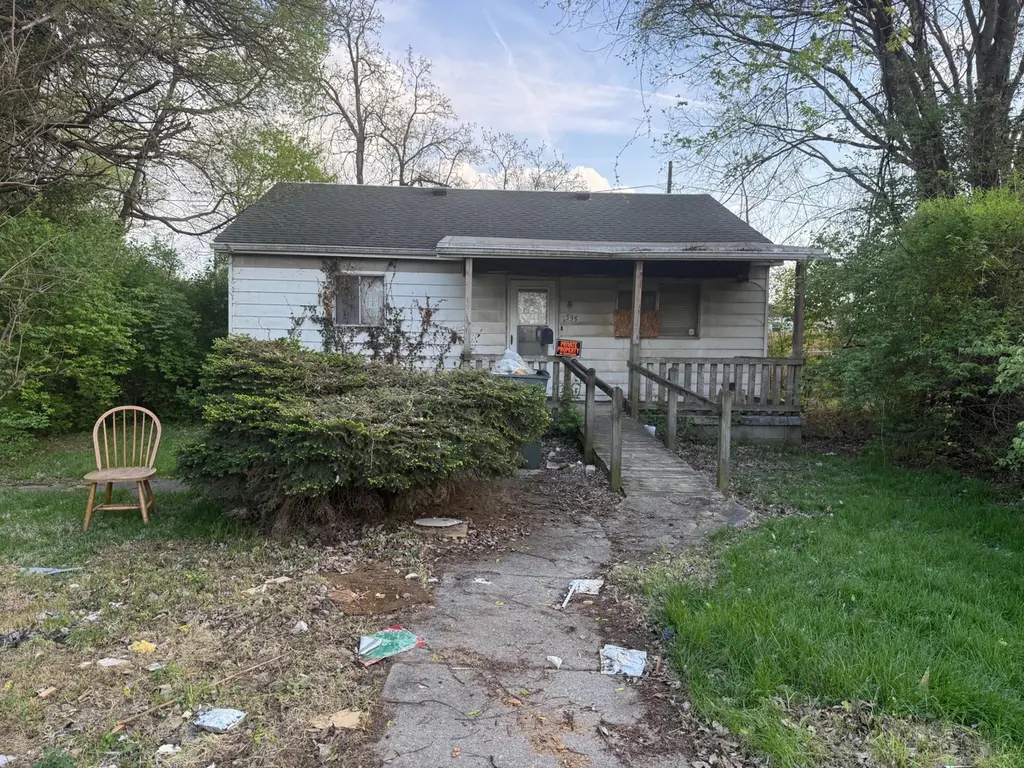
535 Stambaugh Ave · Columbus, OH
Flood risk 1/10 · Minimal
- FEMA flood zone
- X (unshaded)
- Chance of flooding over 30 yrs
- 0.0%
- Est. flood insurance / yr
- $507 – $1,088
Fire risk 1/10 · Minimal
- Est. fire insurance / yr
- $713 – $1,323
Heat risk 3/10 · Minor
- Hot days now (above 100°F)
- 7 days/yr
- Hot days in 30 yrs
- 17 days/yr
Wind risk 2/10 · Minimal
- Chance of severe wind over 30 yrs
- 1.0%
Air-quality risk 3/10 · Minor
- Unhealthy air days now
- 2 days/yr
- Unhealthy air days in 30 yrs
- 3 days/yr
Risk factors via First Street. Map © Google.
Why this score? — see what drove the B- grade
The composite is a weighted blend of 9 inputs, each scored 0–100. Each bar is that input's sub-score; the figure is the points it added to the 100-point composite (weight × sub-score).
- Cash flow +30.0/30.0
- 1% rule +10.0/10.0
- DSCR +10.0/10.0
- ARV discount +7.5/15.0
- Livability +4.0/5.0
- Rent growth +3.1/5.0
- Condition / age +2.5/5.0
- Schools +1.7/10.0
- Appreciation +0.0/10.0
$49,900
🖨 Deal sheet (PDF) 📄 Offer letter ✓ Due diligence
Listing remarks
Investor special! Full rehab needed on this one-story property that is perfect for a fix-and-flip, or rental. Strong upside with the right vision. Sold as-is. Cash or rehab financing preferred. Don't miss this value-add opportunity! The lot to the left of the house with the shed on it is NOT a part of the property.
Key facts
- Large lot
- 6,098 sq ft lot
- Built 1900
Tags
Neighborhood map
What this means for you Summary
Snapshot
- This is a 2-bed/1.0-bath single-family listed at $50k.
Deal economics
- At list price, monthly cash flow is $729 ($9k/yr) — positive.
- The deal already cash-flows at list — no discount required.
- Meets the 1% rule at list price ($1k rent vs $50k).
- Cap rate 23.8% vs local median 3.8% in Columbus — top-decile yield for the area; either an underpriced asset or a hidden risk that comps aren't pricing in. Stress-test before assuming the spread holds.
Location & tenants
- Location reads 81/100 on livability (#97 in OH, #1,491 nationally) — a professional / high-income tenant draw. Strengths: commute A+, cost of living A+, housing A+; Watch: employment C-, crime F.
- Columbus City School District (urban): math 15% / reading 26% proficiency, ranked #626 of 656 in OH (top 95%) — low school quality limits family demand, transient renter base, plan for 1-2y turnover; 72% free/reduced lunch — lower-income household profile, screen leases tightly.
- Market conditions: Rents rising (+2.3%/yr); 197 active listings in the ZIP; 40 comparable units currently listed for rent nearby; rentals at typical pace (median 25d on market — plan ~3-4 weeks tenant-placement turnaround); 8,139 units permitted in Franklin County in 2024 (5,940 in 5+ unit buildings).
Forward outlook
- Local home prices are declining (-3.0%/yr); year-one equity from $345 of loan paydown is wiped out by about $1k of value loss. Plan a longer hold.
- Franklin County population projected at +34% by 2050 — long-run rental-demand tailwind backs the buy-and-hold thesis.
- At projected returns (-3.0% appreciation + 2.3% rent growth), your $14k cash investment doubles in ~2 years — after that, you're playing with house money.
Negotiation context
- Only 3 days on market — expect competitive offers; lowballing is unlikely to land.
- Current owner paid $7k; list at $50k implies a 613% gain — meaningful room to come down on a strong offer.
Risks & watch-outs
- Watch-outs: built in 1900 — expect roof / HVAC / electrical / plumbing capex.
Questions for the listing agent
- Built in 1900 — when were the roof, HVAC, electrical panel, plumbing, and water heater last replaced?
- Is there a deadline driving the sale (1031 exchange, divorce, estate, relocation)? That informs how much negotiation room exists.
- Crime grade is F in this area — have there been break-ins, vandalism, or insurance claims at this property in the last 3 years? What carrier currently insures it and at what premium?
- What's the average days-on-market for RENTAL listings here right now (not sales)? A rising rental-DOM trend means longer vacancies and softer asking-rent achievability than the comps imply.
- What's the recent tenant-quality profile in this submarket — average credit score on applications, eviction rate, late-payment / NSF rate, and stable-employment percentage? A property-management company in the area should have these aggregated.
- How much new for-sale + rental construction is in the pipeline within 1–3 miles? Heavy new supply typically softens prices + rents 12–24 months out; constrained supply supports both.
Investment metrics
- 1% rule
- 2.80% ✓
- Cap rate
- 23.82%
- Cash-on-cash
- 62.60%
- DSCR
- 3.79
- GRM
- 3.0
CMA / ARV
- ARV (on-the-fly)
- $144,000
- Comps found
- 12
Show comp detail 12 sales within ~0.75 mi
| Address | Dist | Beds/Ba | Sqft | Sold | Price | $/sf | Match |
|---|---|---|---|---|---|---|---|
| 535 Stambaugh Ave | 0.00mi | 2/1.0 | 1,200 (0%) | 0mo | $57,000 | $48 | 100 |
| 528 Stambaugh Ave | 0.04mi | 3/2.0 (+1) | 1,344 (+12%) | 9mo | $199,000 | $148 | 62 |
| 837 Koebel Ave | 0.52mi | 3/1.5 (+1) | 1,251 (+4%) | 2mo | $160,000 | $128 | 60 |
| 1943 S 9th St | 0.49mi | 2/— | 1,285 (+7%) | 9mo | $40,000 | $31 | 58 |
| 868 Koebel Ave | 0.55mi | 2/1.0 | 1,101 (-8%) | 4mo | $181,500 | $165 | 57 |
| 782 Stambaugh Ave | 0.38mi | 3/1.0 (+1) | 1,352 (+13%) | 1mo | $157,500 | $116 | 56 |
| 1789 Goethe St | 0.63mi | 3/1.0 (+1) | 1,088 (-9%) | 0mo | $84,000 | $77 | 50 |
| 238 Delray Rd | 0.66mi | 3/1.0 (+1) | 1,112 (-7%) | 4mo | $133,500 | $120 | 49 |
| 306 E Woodrow Ave | 0.74mi | 3/1.5 (+1) | 1,152 (-4%) | 8mo | $271,000 | $235 | 46 |
| 300 Loxley Dr | 0.74mi | 3/2.0 (+1) | 1,280 (+7%) | 5mo | $149,000 | $116 | 41 |
| 120 Hosack St | 0.68mi | 3/1.0 (+1) | 1,360 (+13%) | 0mo | $52,500 | $39 | 41 |
| 524 E Hinman Ave | 0.73mi | 2/1.5 | 1,040 (-13%) | 6mo | $175,000 | $168 | 37 |
Match score weights: distance 35% · size 25% · config 20% · recency 20%. Top-matched comps best support the ARV.
Projected returns pro-forma
-3.0% appreciation · 2.32% rent growth · sell at horizon
- IRR
- 60.8%
- Equity multiple
- 3.68×
- Total profit
- $37,427
- Equity at exit
- $7,440
- IRR
- 65.2%
- Equity multiple
- 7.35×
- Total profit
- $88,686
- Equity at exit
- $4,314
Cash invested: $13,972 (down + closing). Projections, not guarantees.
Landlord ↔ Tenant lean methodology
- Overall (STATE)
- 73 Landlord-Friendly
- State Ohio
- 73 Landlord-Friendly · R+6
- County
- — inherits STATE
- City
- — inherits STATE
ZIP-level market 43207
- Rents YoY
- 2.3%
- Active inventory
- 197
- Price-to-rent
- 3.0×
Monthly cashflow live
- Estimated rent
- $1,397 high interval (Pro) →
- Mortgage (P&I)
- −$262
- Tax from tax record
- −$92 /mo · $1,104/yr
- Insurance
- −$21
- HOA
- −$0
- Vacancy / Maint / Mgmt
- −$293
- Net cashflow
- $729
Break-even live
Sensitivity live
| Price | -10% $757 | -5% $743 | +0% $729 | +5% $715 | +10% $701 |
|---|---|---|---|---|---|
| Rent | -10% $619 | -5% $674 | +0% $729 | +5% $784 | +10% $839 |
| Rate | -1.0pp $754 | -0.5pp $742 | base $729 | +0.5pp $716 | +1.0pp $703 |
UW: 25.0% down · 7.5% · 30yr · 1.5% tax · 5.0% vac · 8.0% maint · 8.0% mgmt
Financing live
Cash to close
- Down payment
- $12,475
- Closing costs
- $1,497
- Reserves months
- —
- Total cash needed
- —
Loan-product check · same deal, 3 products live
Conventional
25% down · 7.5% · 30yr
- Down + closing
- —
- Monthly P&I
- —
- Monthly cashflow
- —
- DSCR
- —
- Eligible?
- —
Personal DTI + credit; lowest rate.
DSCR
20% down · 8.5% · 30yr
- Down + closing
- —
- Monthly P&I
- —
- Monthly cashflow
- —
- DSCR
- —
- Eligible?
- —
No personal income docs; deal must DSCR.
Hard money
10% down · 12.0% · 12mo
- Down + closing
- —
- Monthly P&I
- —
- Monthly cashflow
- —
- DSCR
- —
- Eligible?
- —
Short-term bridge; refi at stabilization.
Rent comps 40 comps
| Address | Beds | Baths | Sqft | Rent | $/sqft | DOM | Units | Dist |
|---|---|---|---|---|---|---|---|---|
| 838 Lock Ave Columbus, OH | 3.0 | 1.0 | 988 | $1,578 | $1.60 | 3d | 1 | 0.48mi |
| 1843 Parsons Ave Columbus, OH | 2.0 | 1.0 | 899 | $1,331 | $1.48 | 25d | 1 | 0.55mi |
| 274 E Barthman Ave Columbus, OH | 2.0 | 1.0 | 960 | $1,500 | $1.56 | 18d | 1 | 0.57mi |
| 257 Benfield Ave Unit NA Columbus, OH | 3.0 | 1.0 | 1094 | $1,400 | $1.28 | 8d | 1 | 0.59mi |
| 2491 Wilson Ave Columbus, OH | 3.0 | 1.0 | 1200 | $1,649 | $1.37 | 45d | 1 | 0.66mi |
| 1808 S 6th St Unit 1808 Columbus, OH | 2.0 | 1.0 | 975 | $1,050 | $1.08 | 45d | 1 | 0.73mi |
| 55 Fornof Rd Columbus, OH | 1.0–4.0 | 1.0–2.0 | 924 | $1,620 | $1.75 | 3d | 1 | 0.73mi |
| 362 E Hinman Ave Columbus, OH | 2.0 | 1.0 | 879 | $1,149 | $1.31 | 45d | 1 | 0.76mi |
| 529 E Morrill Ave Columbus, OH | 3.0 | 1.0 | 1318 | $1,600 | $1.21 | 4d | 1 | 0.77mi |
| 76-78 E Barthman Ave Columbus, OH | 3.0 | 1.0 | 1206 | $1,500 | $1.24 | 25d | 1 | 0.79mi |
| 54-56 Benfield Ave Unit 56 Columbus, OH | 2.0 | 1.0 | 800 | $925 | $1.16 | 25d | 1 | 0.79mi |
| 367 E Morrill Ave Columbus, OH | 2.0 | 1.0 | 977 | $1,450 | $1.48 | 45d | 1 | 0.79mi |
| 206 E Woodrow Ave Columbus, OH | 2.0 | 1.0 | 999 | $1,295 | $1.30 | 45d | 1 | 0.82mi |
| 122 E Woodrow Ave Columbus, OH | 2.0 | 1.0 | 1200 | $1,450 | $1.21 | 16d | 1 | 0.90mi |
| 476 Southwood Ave Columbus, OH | 2.0 | 1.0 | 1219 | $1,400 | $1.15 | 45d | 1 | 0.99mi |
| 662 Southwood Ave Columbus, OH | 3.0 | 2.0 | 1183 | $1,950 | $1.65 | 21d | 1 | 0.99mi |
| 1598-1600 S 4th St Columbus, OH | 2.0 | 1.0 | 855 | $1,250 | $1.46 | 45d | 1 | 1.01mi |
| 2866 Hillgate Rd Columbus, OH | 3.0 | 1.0 | 1040 | $1,693 | $1.63 | 25d | 1 | 1.02mi |
| 546 E Jenkins Ave Unit 1 Columbus, OH | 2.0 | 1.0 | 975 | $1,295 | $1.33 | 25d | 1 | 1.03mi |
| 490-492 E Jenkins Ave Unit 490 Columbus, OH | 3.0 | 1.0 | 1050 | $1,325 | $1.26 | 45d | 1 | 1.05mi |
| 1836 Lockbourne Rd Columbus, OH | 2.0–3.0 | 1.0–1.5 | 997 | $1,025 | $1.03 | 4d | 4 | 1.14mi |
| 33 W Morrill Ave Columbus, OH | 1.0–3.0 | 1.0–2.0 | 935 | $1,134 | $1.21 | 8d | 4 | 1.17mi |
| 726 Frebis Ave Columbus, OH | 2.0 | 1.0 | 850 | $1,175 | $1.38 | 4d | 1 | 1.22mi |
| 205 E Moler St Unit B Columbus, OH | 2.0 | 1.0 | 891 | $995 | $1.12 | 8d | 1 | 1.26mi |
| 1285 Evergreen Rd Columbus, OH | 3.0 | 2.0 | 888 | $1,750 | $1.97 | 21d | 1 | 1.30mi |
| 3011 Markham Rd Unit 3011A Columbus, OH | 2.0 | 1.0 | 750 | $899 | $1.20 | 25d | 1 | 1.31mi |
| 1416 S Ohio Ave Columbus, OH | 3.0 | 1.5 | 1056 | $1,595 | $1.51 | 22d | 1 | 1.31mi |
| 554 E Gates St Columbus, OH | 2.0 | 1.0 | 902 | $1,295 | $1.44 | 11d | 1 | 1.33mi |
| 1460 Oakwood Ave Columbus, OH | 2.0 | 1.0 | 901 | $900 | $1.00 | 16d | 1 | 1.34mi |
| 1460 Oakwood Ave Columbus, OH | 2.0 | 1.0 | 901 | $900 | $1.00 | 45d | 1 | 1.34mi |
| 1386 Faber Ave Columbus, OH | 3.0 | 1.0 | 1250 | $1,649 | $1.32 | 8d | 1 | 1.36mi |
| 27 W Jenkins Ave Columbus, OH | 2.0–3.0 | 1.0–1.5 | 1013 | $1,137 | $1.12 | 8d | 4 | 1.36mi |
| 61 E Moler St #63 Columbus, OH | 2.0 | 1.0 | 1050 | $1,950 | $1.86 | 16d | 1 | 1.37mi |
| 1833 Berkeley Rd Columbus, OH | 3.0 | 1.5 | 1092 | $1,800 | $1.65 | 45d | 1 | 1.37mi |
| 573 E Mithoff St Columbus, OH | 3.0 | 1.5 | 1300 | $2,100 | $1.62 | 45d | 1 | 1.38mi |
| 735-737 E Mithoff St Columbus, OH | 2.0 | 1.0 | 800 | $1,395 | $1.74 | 25d | 1 | 1.39mi |
| 672 E Mithoff St Columbus, OH | 2.0 | 1.0 | 768 | $1,200 | $1.56 | 22d | 1 | 1.41mi |
| 3047 Baker Hill Rd Columbus, OH | 3.0 | 1.0 | 896 | $1,300 | $1.45 | 45d | 1 | 1.41mi |
| 426 E Mithoff St Columbus, OH | 1.0 | 1.0 | 991 | $1,625 | $1.64 | 45d | 1 | 1.41mi |
| 3204 T Ave Columbus, OH | 2.0 | 1.0 | 1168 | $1,325 | $1.13 | 25d | 1 | 1.42mi |
Listing history 3 events
-
2026-04-21status Pending
-
2026-04-18$49,900 Active
-
2016-01-11soldstatus $7,000
ⓘ Source: listings_history table (triggers on properties + properties_extension) + one-shot
backfill from property_details.listing_events for pre-trigger history.
Tax reassessment forecast OH · Partial reset (capped growth)
- Current annual tax
- $1,104 · $92/mo
- Projected year-2 tax
- $1,104 · $92/mo
- Expected delta
- $0/yr ($0/mo · 0.0%)
ⓘ Screening estimate from a state-policy table — verify with the county assessor before closing.
Climate risk First Street
- Flood 1/10 Low FEMA zone X (unshaded) · 0% chance over 30 yrs
- Wildfire 1/10 Low
- Heat 3/10 Moderate 7 d/yr ≥100°F today · 17 d/yr by 30 yrs out
- Wind 2/10 Low 100% chance of damaging wind over 30 yrs
- Air quality 3/10 Moderate 2 unhealthy d/yr today · 3 by 30 yrs out
Nearby sold comps map
Loading sold comps map…
Walkable amenities ~0.75 mi
Loading nearby amenities…
Taxation est. · year 1
- Rental income
- $16,760
- − Mortgage interest
- −$2,795
- − Property taxes
- −$1,104
- − Insurance
- −$250
- − Repairs & maintenance
- −$1,341
- − Management
- −$1,341
- − Depreciation
- −$1,452
- Taxable income
- $8,478
- Est. tax owed @ 24.0%
- −$2,035
- After-tax cash flow
- $6,712/yr
For passive investors: Depreciation is non-cash, so a rental often shows a tax loss while cash-flowing — sheltering income. Rental losses are passive: they offset passive income freely, and up to $25,000/yr can offset ordinary (W-2) income if you actively participate and your MAGI is under $100k (phasing out to $0 by $150k); unused losses carry forward. On sale, claimed depreciation is recaptured at up to 25%, and gains may owe capital-gains tax (a 1031 exchange can defer both). Figures are a year-1 estimate at your 24.0% rate — not tax advice; consult a CPA.
Schools (NCES district)
- District
- Columbus City School District
- NCES district ID
- 3904380
- Math proficiency
- 15% ▼ -17.00%
- Reading proficiency
- 26% ▼ -12.00%
- Median HH income
- $38,483
- Composite
- 17.19/100
- National rank
- #9105
- State rank
- #626 of 656 in OH
Livability — Columbus
- Score
- 81/100
- State rank
- #97
- US rank
- #1491
Category grades
Schools grade is shown separately in the Schools card above.
Census & demographics
- Census place
- Columbus, OH
- County
- Franklin County · 1,351,780 people
- City population
- 612,189
- Metro
- Columbus, OH
- Population (ZIP)
- 47,272
- Household income
- $63,310
- Rent vs Own
- Severe rent burden
- 1679.0
Population outlook (Franklin County) Hauer SSP2
- Today (2025)
- 1,456,139 people
- By 2030
- 1,556,890 · +6.9%
- By 2040
- 1,757,349 · +20.7%
- By 2050
- 1,950,539 · +34.0%
- By 2075
- 2,376,171 · +63.2%
- By 2100
- 2,636,796 · +81.1%
Race, ethnicity, and origin ACS 2023
- Neighborhood character
- Diverse neighborhood (Simpson 0.57)
- Race & ethnicity
- White 59% Black 28% Two or more races 7% Hispanic / Latino 5% Asian 1%
- Hispanic origin (detail)
- Mexican 3%
- Common ancestry
- Italian 2% Romanian 2% Slovak 1%
- Foreign-born
- 4% · Canada
- Languages at home
- 95% English-only · Spanish 3% Other Indo-European 1%
Political lean MEDSL · Franklin
- 2024 margin
- Strong D (+28.4) · D 63.7% · R 35.3% · Other 1.0%
- 2008→2024 swing
- +7.7pp toward D · 2008: 20.7pp · 2024: 28.4pp
- All cycles
- 2024: D+28.4 2020: D+31.4 2016: D+25.9 2012: D+21.7 2008: D+20.7
Not yet ingested
- Civics
- —
Market trends
- HPI YoY
- ▼ -244.33%
- Current HPI
- 268.3028
- Rent YoY
- ▲ 2.32%
- Metro
- Columbus, OH
- State GDP YoY
- ▲ 1.98%
- F500 in state
- 48
Industry mix (Fortune 500 HQ in OH)
| Industry | F500 HQs | Revenue |
|---|---|---|
| Insurance | 3 | $145B |
|
||
| Industrial Machinery | 3 | $49B |
|
||
| Financial Services | 3 | $24B |
|
||
| Consumer Goods | 2 | $93B |
|
||
| Aerospace / Defense | 2 | $47B |
|
||
| Utilities | 2 | $33B |
|
||
Price history
+612.9% since first listed3 events — show timeline
- 2026-04-21 Pending — CBRMLS
- 2026-04-18 Listed $49,900 CBRMLS
- 2016-01-11 Sold (Public Records) $7,000 Public Records
Property tax history
-3.1%/yrLatest (2024): $1,104 · +67.0% YoY. Source: county tax records.
Cash-flow waterfall
monthlySold comps — $/sqft
last 12 mo · ≤1 miLoading sold comps…