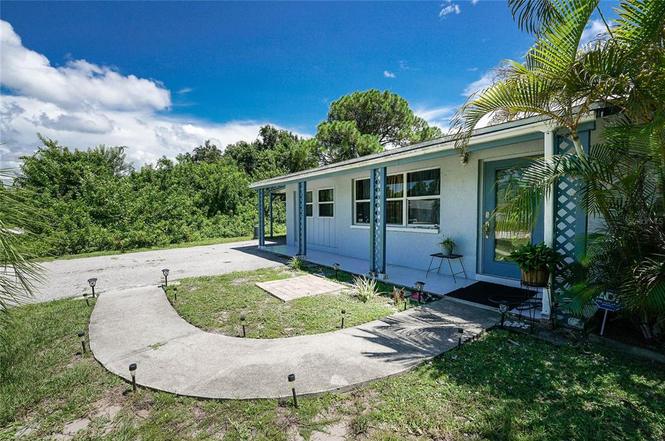
8301 Pelican Rd · Grove City, FL
Flood risk 7/10 · Major
- FEMA flood zone
- X (shaded)
- Chance of flooding over 30 yrs
- 0.72%
- Est. flood insurance / yr
- $507 – $1,088
Fire risk 3/10 · Minor
- Est. fire insurance / yr
- $947 – $1,759
Heat risk 10/10 · Severe
- Hot days now (above 107°F)
- 7 days/yr
- Hot days in 30 yrs
- 28 days/yr
Wind risk 10/10 · Severe
- Chance of severe wind over 30 yrs
- 99.0%
Air-quality risk 2/10 · Minimal
- Unhealthy air days now
- 1 days/yr
- Unhealthy air days in 30 yrs
- 1 days/yr
Risk factors via First Street. Map © Google.
Why this score? — see what drove the D+ grade
The composite is a weighted blend of 9 inputs, each scored 0–100. Each bar is that input's sub-score; the figure is the points it added to the 100-point composite (weight × sub-score).
- Cash flow +13.9/30.0
- ARV discount +13.0/15.0
- Schools +4.6/10.0
- 1% rule +4.3/10.0
- DSCR +4.2/10.0
- Livability +3.2/5.0
- Rent growth +2.5/5.0
- Condition / age +2.5/5.0
- Appreciation +0.0/10.0
$229,000
🖨 Deal sheet (PDF) 📄 Offer letter ✓ Due diligence
Listing remarks MLS
Come see this desirable 3 bedroom 3 bathroom home, with TWO master suites! This home offers tile floors throughout, a carport, inside laundry room, screened lanai, spacious fenced yard and a smart thermostat. The A/C was replaced in 2019 and the windows have been updated. Currently occupied by a month to month tenant with a 24 hour showing notice required.
Key facts
- Private yard
- Flexible-use home
- Quiet neighborhood
Tags
Property features AI
Finance
- Other: Furnished; Property type: Residential — Single Family Residence; Zoning: RSF5; Lot approximately 0.24 acres; Public maintained asphalt road; Living area reported as 1,344 square feet
- HOA & community: Community street lights; Pets allowed
Exterior
- Parking: Covered parking; Driveway; Carport (2 spaces)
- Utilities: Public water; Public sewer; Electricity connected; Cable available; Broadband/high-speed internet available
- Home design: Single-family residence; One story; North facing; Completed condition
- Construction: Block and stucco construction; Shingle roof; Slab foundation; Built as a single-story home
- Exterior features: Covered patio; Screened patio; Patio; Sliding doors; Private mailbox; Chain link fence; Street dead-end lot; Paved lot; Mature landscaping with trees
Interior
- Kitchen: Cooktop; Range; Range hood; Microwave; Dishwasher; Disposal; Refrigerator; Freezer
- Bedrooms: 3 bedrooms
- Flooring: Ceramic tile
- Bathrooms: 3 full bathrooms
- Heating & cooling: Electric heating; Central air conditioning
- Interior features: Ceiling fans; Solid surface counters; Thermostat; Window treatments; Blinds
- Laundry & utility: Inside laundry with washer hookup; Dryer
Neighborhood map
What this means for you Summary
Snapshot
- This is a 3-bed/3.0-bath single-family listed at $229k.
Deal economics
- At list price, monthly cash flow is $-39 ($-473/yr) — negative.
- To cash-flow at today's rent, offer at most $222k (3.0% below list).
- To meet the 1% rule (rent ≥ 1% of price), the offer needs to be $213k (6.8% below list).
- Recommended offer: $202k (12.0% below list) — sets the bar for market timing.
- Cap rate 6.4% vs local median 2.8% in Grove City — top-decile yield for the area; either an underpriced asset or a hidden risk that comps aren't pricing in. Stress-test before assuming the spread holds.
Location & tenants
- Location reads 63/100 on livability (#713 in FL) — a middle-class / working-renter tenant base. Strengths: crime A+, cost of living A+, housing A+; Watch: employment C-, amenities F, commute F.
- Charlotte (suburban): math 54% / reading 54% proficiency, ranked #22 of 73 in FL (top 30%) — acceptable for families but not a draw, mixed tenant base, ~2y average lease.
- Zoned schools: Vineland Elementary School (math 74% / reading 67%, grade A-, #333 of 2,144 statewide, top 16%, 579 students, 45% FRL); Lemon Bay High School (math 50% / reading 56%, grade C-, #148 of 667 statewide, top 23%, 1,360 students, 28% FRL) — zoned schools average 37% FRL vs 54% district-wide (17 pts lower); this property's tenant base skews higher-income than the district average.
- Market conditions: Rents soft (-0.1%/yr); 734 active listings in the ZIP; 20 comparable units currently listed for rent nearby; rentals at typical pace (median 22d on market — plan ~3-4 weeks tenant-placement turnaround); 4,585 units permitted in Charlotte County in 2024 (703 in 5+ unit buildings).
- This rent runs 45% of the median local income ($57k/yr) — at the standard rent-burdened threshold; future hikes will face affordability resistance.
Forward outlook
- Local home prices are declining (-3.0%/yr); year-one equity from $2k of loan paydown is wiped out by about $7k of value loss. Plan a longer hold.
- Charlotte County population projected at +24% by 2050 — long-run rental-demand tailwind backs the buy-and-hold thesis.
Negotiation context
- It's been on market 180 days — a 12% lower offer ($202k) is reasonable based on typical stale-listing flexibility.
- 4 sale attempts since 21y ago; this cycle's ask has dropped $16k (7%) from the opening price — seller is motivated, your offer sets the floor, not the list.
Risks & watch-outs
- Watch-outs: flood insurance adds $66/mo.
- Climate carrying-cost: major flood risk; severe wind risk, 99% chance of damaging wind over 30y; extreme-heat days projected 7→28/yr by 2055 (HVAC capex compounding) — expect insurance premiums to compound above CPI over the hold.
Questions for the listing agent
- What do current leases actually rent for vs. the listed asking? Can we see a recent rent roll and the last 12 months of T-12 income?
- It's been on market 180 days. Have you received any prior offers? Is the seller open to a 12% concession, seller financing, or rate buy-down credit?
- Built in 1974 — when were the roof, HVAC, electrical panel, plumbing, and water heater last replaced?
- What's the actual annual flood-insurance premium (NFIP or private), and is the property in a SFHA with mandatory coverage?
- Why hasn't it sold? Are there any deal-killer items the seller is aware of (foundation, flood, title, zoning, code violations)?
- Is there a deadline driving the sale (1031 exchange, divorce, estate, relocation)? That informs how much negotiation room exists.
- Schools are F-rated, which usually means shorter tenancies and higher turnover. Who's the typical renter profile here, and what's been the actual vacancy rate?
- The area grade is low — what's the realistic commute time and amenity access for the typical tenant pool here? Any planned neighborhood developments (good or bad) we should know about?
- What's the average days-on-market for RENTAL listings here right now (not sales)? A rising rental-DOM trend means longer vacancies and softer asking-rent achievability than the comps imply.
- What's the recent tenant-quality profile in this submarket — average credit score on applications, eviction rate, late-payment / NSF rate, and stable-employment percentage? A property-management company in the area should have these aggregated.
- How much new for-sale + rental construction is in the pipeline within 1–3 miles? Heavy new supply typically softens prices + rents 12–24 months out; constrained supply supports both.
Investment metrics
- 1% rule
- 0.93% ✗
- Cap rate
- 6.43%
- Cash-on-cash
- 0.51%
- DSCR
- 1.02
- GRM
- 8.9
CMA / ARV
- ARV (on-the-fly)
- $260,736
- Comps found
- 12
Show comp detail 12 sales within ~0.75 mi
| Address | Dist | Beds/Ba | Sqft | Sold | Price | $/sf | Match |
|---|---|---|---|---|---|---|---|
| 8650 Saint Kitts Cir | 0.67mi | 3/2.0 | 1,422 (+6%) | 8mo | $270,000 | $190 | 49 |
| 8706 Seasalt Loop | 0.71mi | 3/2.0 | 1,417 (+5%) | 10mo | $268,000 | $189 | 46 |
| 8700 Seasalt Loop | 0.71mi | 3/2.0 | 1,417 (+5%) | 11mo | $258,000 | $182 | 44 |
| 8646 Seasalt Loop | 0.71mi | 3/2.0 | 1,417 (+5%) | 13mo | $249,000 | $176 | 43 |
| 101 Lady Ln | 0.61mi | 3/2.0 | 1,502 (+12%) | 7mo | $410,000 | $273 | 42 |
| 8628 Seasalt Loop | 0.71mi | 3/2.0 | 1,417 (+5%) | 14mo | $260,000 | $183 | 42 |
| 8745 Saint Kitts Cir | 0.66mi | 3/2.0 | 1,423 (+6%) | 18mo | $300,318 | $211 | 40 |
| 8686 Saint Kitts Cir | 0.68mi | 3/2.0 | 1,417 (+5%) | 18mo | $275,000 | $194 | 40 |
| 8704 Saint Kitts Cir | 0.68mi | 3/2.0 | 1,417 (+5%) | 21mo | $299,997 | $212 | 38 |
| 8679 Seasalt Loop | 0.73mi | 2/2.0 (-1) | 1,417 (+5%) | 14mo | $249,000 | $176 | 36 |
| 8740 Saint Kitts Cir | 0.69mi | 3/2.0 | 1,417 (+5%) | 23mo | $295,000 | $208 | 36 |
| 8559 Seasalt Loop | 0.70mi | 3/2.0 | 1,417 (+5%) | 23mo | $325,563 | $230 | 35 |
Match score weights: distance 35% · size 25% · config 20% · recency 20%. Top-matched comps best support the ARV.
Projected returns pro-forma
-3.0% appreciation · 0.0% rent growth · sell at horizon
- IRR
- -21.2%
- Equity multiple
- 0.29×
- Total profit
- $-45,755
- Equity at exit
- $34,145
- IRR
- -25.0%
- Equity multiple
- -0.04×
- Total profit
- $-66,763
- Equity at exit
- $19,800
Cash invested: $64,120 (down + closing). Projections, not guarantees.
Landlord ↔ Tenant lean methodology
- Overall (STATE)
- 87 Strongly Landlord-Friendly
- State Florida
- 87 Strongly Landlord-Friendly · R+3
- County
- — inherits STATE
- City
- — inherits STATE
ZIP-level market 34224
- Home prices YoY
- -18.9%
- Rents YoY
- -0.1%
- Active inventory
- 734
- Price-to-rent
- 8.9×
Monthly cashflow live
- Estimated rent
- $2,134 high interval (Pro) →
- Mortgage (P&I)
- −$1,201
- Tax from tax record
- −$363 /mo · $4,353/yr
- Insurance
- −$95
- Flood insurance flood zone
- −$66 /mo · $798/yr
- HOA
- −$0
- Vacancy / Maint / Mgmt
- −$448
- Net cashflow
- $-39
Break-even live
Sensitivity live
| Price | -10% $90 | -5% $25 | +0% $-39 | +5% $-104 | +10% $-169 |
|---|---|---|---|---|---|
| Rent | -10% $-208 | -5% $-124 | +0% $-39 | +5% $45 | +10% $129 |
| Rate | -1.0pp $76 | -0.5pp $19 | base $-39 | +0.5pp $-99 | +1.0pp $-159 |
UW: 25.0% down · 7.5% · 30yr · 1.5% tax · 5.0% vac · 8.0% maint · 8.0% mgmt
Financing live
Cash to close
- Down payment
- $57,250
- Closing costs
- $6,870
- Reserves months
- —
- Total cash needed
- —
Loan-product check · same deal, 3 products live
Conventional
25% down · 7.5% · 30yr
- Down + closing
- —
- Monthly P&I
- —
- Monthly cashflow
- —
- DSCR
- —
- Eligible?
- —
Personal DTI + credit; lowest rate.
DSCR
20% down · 8.5% · 30yr
- Down + closing
- —
- Monthly P&I
- —
- Monthly cashflow
- —
- DSCR
- —
- Eligible?
- —
No personal income docs; deal must DSCR.
Hard money
10% down · 12.0% · 12mo
- Down + closing
- —
- Monthly P&I
- —
- Monthly cashflow
- —
- DSCR
- —
- Eligible?
- —
Short-term bridge; refi at stabilization.
Rent comps 20 comps
| Address | Beds | Baths | Sqft | Rent | $/sqft | DOM | Units | Dist |
|---|---|---|---|---|---|---|---|---|
| 4341 Placida Rd #5 Englewood, FL | 2.0 | 2.0 | 1071 | $1,350 | $1.26 | 21d | 1 | 0.29mi |
| 4341 Placida Rd #6 Englewood, FL | 2.0 | 2.0 | 1071 | $1,450 | $1.35 | 21d | 1 | 0.29mi |
| 8146 Saint Kitts Cir Englewood, FL | 3.0 | 2.0 | 1635 | $2,400 | $1.47 | 21d | 1 | 0.35mi |
| 8787 Saint Kitts Cir Englewood, FL | 3.0 | 2.0 | 1422 | $2,300 | $1.62 | 14d | 1 | 0.62mi |
| 8644 Saint Kitts Cir Englewood, FL | 3.0 | 3.0 | 1849 | $2,095 | $1.13 | 21d | 1 | 0.63mi |
| 8716 Saint Kitts Cir Englewood, FL | 3.0 | 2.0 | 1417 | $2,500 | $1.76 | 21d | 1 | 0.64mi |
| 8722 Saint Kitts Cir Englewood, FL | 3.0 | 2.0 | 1417 | $2,100 | $1.48 | 21d | 1 | 0.65mi |
| 8613 Seasalt Loop Englewood, FL | 3.0 | 2.0 | 1422 | $3,650 | $2.57 | 21d | 1 | 0.69mi |
| 3280 Holly Ave Englewood, FL | 3.0 | 2.0 | 900 | $3,300 | $3.67 | 21d | 1 | 0.84mi |
| 1950 Nebraska Ave Englewood, FL | 2.0 | 2.0 | 1325 | $3,536 | $2.67 | 21d | 1 | 0.85mi |
| 226 Boundary Blvd Rotonda West, FL | 2.0 | 2.0 | 1200 | $1,495 | $1.25 | 14d | 1 | 1.00mi |
| 278 Boundary Blvd Unit B Rotonda West, FL | 2.0 | 2.0 | 1138 | $1,625 | $1.43 | 21d | 1 | 1.04mi |
| 289 Boundary Blvd Unit 202 Rotonda West, FL | 3.0 | 2.0 | 1168 | $1,645 | $1.41 | 21d | 1 | 1.04mi |
| 309 Boundary Blvd Unit B Rotonda West, FL | 2.0 | 2.0 | 960 | $1,450 | $1.51 | 21d | 1 | 1.12mi |
| 100 Rotonda Lakes Cir Rotonda West, FL | 1.0–3.0 | 1.0–2.0 | 1024 | $1,232 | $1.20 | 14d | 1 | 1.16mi |
| 260 Rotonda Blvd W Unit 2 Rotonda West, FL | 3.0 | 2.0 | 1047 | $1,500 | $1.43 | 21d | 1 | 1.16mi |
| 284 Rotonda Blvd W Rotonda West, FL | 2.0 | 2.0 | 897 | $1,475 | $1.64 | 21d | 1 | 1.20mi |
| 173 Rotonda Cir Rotonda West, FL | 3.0 | 2.0 | 1350 | $3,200 | $2.37 | 21d | 1 | 1.22mi |
| 42 Mark Twain Ln Rotonda West, FL | 3.0 | 2.5 | 1677 | $2,800 | $1.67 | 21d | 1 | 1.39mi |
| 8363 Sago Ct Englewood, FL | 2.0 | 2.0 | 1360 | $1,950 | $1.43 | 21d | 1 | 1.46mi |
Listing history 16 events
-
2026-03-04price $229,000
-
2026-02-16price $235,000
-
2025-11-28$245,000 Active
-
2022-10-21soldstatus $245,000 Closed 359-char remark
Show marketing remark (359 chars)
Come see this desirable 3 bedroom 3 bathroom home, with TWO master suites! This home offers tile floors throughout, a carport, inside laundry room, screened lanai, spacious fenced yard and a smart thermostat. The A/C was replaced in 2019 and the windows have been updated. Currently occupied by a month to month tenant with a 24 hour showing notice required.
-
2022-10-21soldstatus $245,000
Show marketing remark (359 chars)
Come see this desirable 3 bedroom 3 bathroom home, with TWO master suites! This home offers tile floors throughout, a carport, inside laundry room, screened lanai, spacious fenced yard and a smart thermostat. The A/C was replaced in 2019 and the windows have been updated. Currently occupied by a month to month tenant with a 24 hour showing notice required.
-
2022-08-22status Pending 359-char remark
Show marketing remark (359 chars)
Come see this desirable 3 bedroom 3 bathroom home, with TWO master suites! This home offers tile floors throughout, a carport, inside laundry room, screened lanai, spacious fenced yard and a smart thermostat. The A/C was replaced in 2019 and the windows have been updated. Currently occupied by a month to month tenant with a 24 hour showing notice required.
-
2022-08-16$245,000 Active 359-char remark
Show marketing remark (359 chars)
Come see this desirable 3 bedroom 3 bathroom home, with TWO master suites! This home offers tile floors throughout, a carport, inside laundry room, screened lanai, spacious fenced yard and a smart thermostat. The A/C was replaced in 2019 and the windows have been updated. Currently occupied by a month to month tenant with a 24 hour showing notice required.
-
2009-08-10soldstatus $65,000
-
2009-07-28soldstatus $65,000 193-char remark
Show marketing remark (193 chars)
Lovely 3 BR home situated on 1-1/2 lots, perfect for the growing family. Unique custom kitchen with antique pine hand-finished countertops with multi-coat Poly seal and Tile floors throughout.
-
2009-05-27$65,900 193-char remark
Show marketing remark (193 chars)
Lovely 3 BR home situated on 1-1/2 lots, perfect for the growing family. Unique custom kitchen with antique pine hand-finished countertops with multi-coat Poly seal and Tile floors throughout.
-
2005-09-21soldstatus $174,500
-
2005-09-16soldstatus $174,500
-
2005-04-12$176,500
-
2001-03-26soldstatus $74,500
-
2000-03-07soldstatus $46,300
-
1995-12-29soldstatus $62,000
ⓘ Source: listings_history table (triggers on properties + properties_extension) + one-shot
backfill from property_details.listing_events for pre-trigger history.
Tax reassessment forecast FL · Resets to sale price
- Current annual tax
- $4,353 · $363/mo
- Projected year-2 tax
- $4,353 · $363/mo
- Expected delta
- $0/yr ($0/mo · 0.0%)
ⓘ Screening estimate from a state-policy table — verify with the county assessor before closing.
Climate risk First Street
- Flood 7/10 Severe FEMA zone X (shaded) · 72% chance over 30 yrs
- Wildfire 3/10 Moderate
- Heat 10/10 Extreme 7 d/yr ≥107°F today · 28 d/yr by 30 yrs out
- Wind 10/10 Extreme 99% chance of damaging wind over 30 yrs
- Air quality 2/10 Low 1 unhealthy d/yr today · 1 by 30 yrs out
Nearby sold comps map
Loading sold comps map…
Walkable amenities ~0.75 mi
Loading nearby amenities…
Taxation est. · year 1
- Rental income
- $25,611
- − Mortgage interest
- −$12,828
- − Property taxes
- −$4,353
- − Insurance
- −$1,942
- − Repairs & maintenance
- −$2,049
- − Management
- −$2,049
- − Depreciation
- −$6,662
- Taxable loss
- −$4,271
- Est. tax savings @ 24.0%
- +$1,025
- After-tax cash flow
- $552/yr
For passive investors: Depreciation is non-cash, so a rental often shows a tax loss while cash-flowing — sheltering income. Rental losses are passive: they offset passive income freely, and up to $25,000/yr can offset ordinary (W-2) income if you actively participate and your MAGI is under $100k (phasing out to $0 by $150k); unused losses carry forward. On sale, claimed depreciation is recaptured at up to 25%, and gains may owe capital-gains tax (a 1031 exchange can defer both). Figures are a year-1 estimate at your 24.0% rate — not tax advice; consult a CPA.
Schools (NCES district)
- District
- Charlotte
- NCES district ID
- 1200240
- Math proficiency
- 54% ▼ -6.00%
- Reading proficiency
- 54% ▼ -1.00%
- Median HH income
- $44,864
- Composite
- 45.62/100
- National rank
- #2586
- State rank
- #22 of 73 in FL
Livability — Grove City
- Score
- 63/100
- State rank
- #713
- US rank
- #15171
Category grades
Schools grade is shown separately in the Schools card above.
Census & demographics
- County
- Charlotte County · 196,994 people
- Metro
- Punta Gorda, FL
- Population (ZIP)
- 15,536
- Household income
- $57,281
- Rent vs Own
- Severe rent burden
- 329.0
Population outlook (Charlotte County) Hauer SSP2
- Today (2025)
- 198,646 people
- By 2030
- 210,507 · +6.0%
- By 2040
- 230,857 · +16.2%
- By 2050
- 247,148 · +24.4%
- By 2075
- 281,777 · +41.8%
- By 2100
- 293,609 · +47.8%
Race, ethnicity, and origin ACS 2023
- Neighborhood character
- Predominantly White (92%)
- Race & ethnicity
- White 92% Two or more races 5% Hispanic / Latino 3% Asian 1%
- Common ancestry
- Romanian 4% Slovak 4% Lithuanian 4%
- Foreign-born
- 9% · Canada
- Languages at home
- 92% English-only · Other Indo-European 2% Spanish 2% German/W. Germanic 1%
Political lean MEDSL · Charlotte
- 2024 margin
- Solid R (+34.0) · D 32.7% · R 66.7%
- 2008→2024 swing
- -26.7pp toward R · 2008: -7.2pp · 2024: -34.0pp
- All cycles
- 2024: R+34.0 2020: R+26.6 2016: R+27.8 2012: R+14.3 2008: R+7.2
Not yet ingested
- Civics
- —
Market trends
- HPI YoY
- ▼ -75.76%
- Current HPI
- 325.0345
- Rent YoY
- ▼ -0.11%
- Metro
- Punta Gorda, FL
- State GDP YoY
- ▲ 3.28%
- F500 in state
- 36
Industry mix (Fortune 500 HQ in FL)
| Industry | F500 HQs | Revenue |
|---|---|---|
| Industrial Technology | 2 | $29B |
|
||
| Insurance | 2 | $17B |
|
||
| Retail | 1 | $60B |
|
||
| Technology Distribution | 1 | $58B |
|
||
| Homebuilding | 1 | $35B |
|
||
| Technology Manufacturing | 1 | $35B |
|
||
Price history
+269.4% since first listed16 events — show timeline
- 2026-03-04 Price Changed $229,000 Stellar MLS as Distributed by MLS Grid
- 2026-02-16 Price Changed $235,000 Stellar MLS as Distributed by MLS Grid
- 2025-11-28 Listed $245,000 Stellar MLS as Distributed by MLS Grid
- 2022-10-21 Sold (Public Records) $245,000 Public Records
- 2022-10-21 Sold (MLS) $245,000 Stellar MLS as Distributed by MLS Grid
- 2022-08-22 Pending — Stellar MLS as Distributed by MLS Grid
- 2022-08-16 Listed $245,000 Stellar MLS as Distributed by MLS Grid
- 2009-08-10 Sold (Public Records) $65,000 Public Records
- 2009-07-28 Sold (MLS) $65,000 Stellar MLS as Distributed by MLS Grid
- 2009-05-27 Listed $65,900 Stellar MLS as Distributed by MLS Grid
- 2005-09-21 Sold (Public Records) $174,500 Public Records
- 2005-09-16 Sold (MLS) $174,500 Stellar MLS as Distributed by MLS Grid
- 2005-04-12 Listed $176,500 Stellar MLS as Distributed by MLS Grid
- 2001-03-26 Sold (Public Records) $74,500 Public Records
- 2000-03-07 Sold (Public Records) $46,300 Public Records
- 1995-12-29 Sold (Public Records) $62,000 Public Records
Property tax history
+15.4%/yrLatest (2025): $4,353 · -1.6% YoY. Source: county tax records.
Cash-flow waterfall
monthlySold comps — $/sqft
last 12 mo · ≤1 miLoading sold comps…