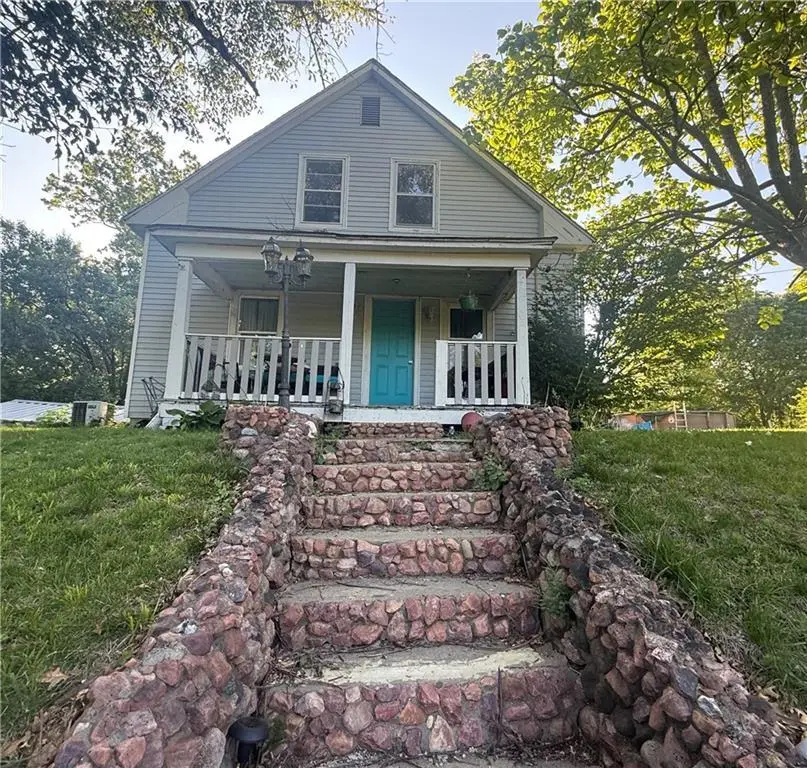
402 Auburn Ave · Oregon, MO
Flood risk 1/10 · Minimal
- FEMA flood zone
- —
- Chance of flooding over 30 yrs
- 0.0%
- Est. flood insurance / yr
- —
Fire risk 1/10 · Minimal
- Est. fire insurance / yr
- $1,054 – $1,958
Heat risk 3/10 · Minor
- Hot days now (above 105°F)
- 7 days/yr
- Hot days in 30 yrs
- 16 days/yr
Wind risk 2/10 · Minimal
- Chance of severe wind over 30 yrs
- —
Air-quality risk 1/10 · Minimal
- Unhealthy air days now
- 0 days/yr
- Unhealthy air days in 30 yrs
- 0 days/yr
Risk factors via First Street. Map © Google.
Why this score? — see what drove the B- grade
The composite is a weighted blend of 9 inputs, each scored 0–100. Each bar is that input's sub-score; the figure is the points it added to the 100-point composite (weight × sub-score).
- Cash flow +25.4/30.0
- DSCR +8.4/10.0
- Appreciation +8.2/10.0
- ARV discount +7.5/15.0
- 1% rule +5.4/10.0
- Schools +4.0/10.0
- Livability +3.4/5.0
- Rent growth +2.5/5.0
- Condition / age +2.5/5.0
$110,000
🖨 Deal sheet 📄 Offer letter ✓ Due diligence
Listing remarks
Enjoy small-town living with a private country feel in this charming 2-story home located in the friendly community of Oregon. Nestled on a large private lot in town, this spacious home offers 3 possible 4 bedrooms and 2 full baths with plenty of room to grow. The property features a welcoming layout with generous living spaces, abundant natural light, and flexibility for a home office, guest room, or additional bedroom. Step outside and enjoy the peaceful setting with mature trees and plenty of outdoor space for entertaining, gardening, or relaxing. Experience the best of both worlds — the convenience of town living with the privacy and feel of the countryside. Don’t miss this
Key facts
- Large private lot
- Outdoor space
- Mature trees
Tags
Property features AI
Finance
- Other: Property not in flood plain
- HOA & community: No association fees
Exterior
- Parking: Detached 1-car garage
- Utilities: Public water; Public sewer
- Home design: Single family residence; Residential property; 2 stories; Facing direction not specified; Entry level not specified
- Construction: Vinyl siding; Composition roof; Concrete basement; Built approximately 76–100 years ago
- Exterior features: Porch; Acreage lot
Interior
- Kitchen: Refrigerator; Electric range; Eat-in kitchen
- Bedrooms: 4 bedrooms
- Flooring: Carpet; Vinyl
- Bathrooms: 2 full bathrooms
- Heating & cooling: Forced air heating; Electric cooling
- Interior features: Eat-in kitchen; Refrigerator; Electric range
- Laundry & utility: Laundry in basement
Neighborhood map
What this means for you Summary
Snapshot
- This is a 4-bed/2.0-bath other listed at $110k.
Deal economics
- At list price, monthly cash flow is $254 ($3k/yr) — positive.
- The deal already cash-flows at list — no discount required.
- Meets the 1% rule at list price ($1k rent vs $110k).
- Recommended offer: $108k (1.5% below list) — sets the bar for market timing.
Location & tenants
- Location reads 68/100 on livability (#172 in MO) — a middle-class / working-renter tenant base. Strengths: crime A+, cost of living A+, housing A+; Watch: amenities F, commute F, health & safety F.
- South Holt County R-I (rural): math 40% / reading 50% proficiency, ranked #199 of 535 in MO (top 37%) — families likely to look elsewhere, expect single-tenant / working-renter base with shorter leases.
- Market conditions: 13 active listings in the ZIP.
Forward outlook
- In year one you build about $8k of equity ($761 loan paydown + $7k appreciation (6.5% local appreciation)).
- Holt County population projected at -42% by 2050 — secular population decline; favor cash flow + early exit over multi-decade hold.
- At projected returns (6.5% appreciation + 3.0% rent growth), your $31k cash investment doubles in ~3 years — after that, you're playing with house money.
- By year 5, paydown + projected appreciation supports a ~$35k cash-out refi (75% LTV) — recoverable capital for the next deal without selling this one.
Negotiation context
- It's been on market 22 days — a 2% lower offer ($108k) is reasonable based on typical stale-listing flexibility.
Risks & watch-outs
- Watch-outs: built in 1930 — expect roof / HVAC / electrical / plumbing capex.
Questions for the listing agent
- Built in 1930 — when were the roof, HVAC, electrical panel, plumbing, and water heater last replaced?
- Is there a deadline driving the sale (1031 exchange, divorce, estate, relocation)? That informs how much negotiation room exists.
- Schools are B-rated — typically a magnet for longer-tenancy family renters. What's the average tenant stay here, and is there a school-zone premium baked into asking?
- What's the average days-on-market for RENTAL listings here right now (not sales)? A rising rental-DOM trend means longer vacancies and softer asking-rent achievability than the comps imply.
- What's the recent tenant-quality profile in this submarket — average credit score on applications, eviction rate, late-payment / NSF rate, and stable-employment percentage? A property-management company in the area should have these aggregated.
- How much new for-sale + rental construction is in the pipeline within 1–3 miles? Heavy new supply typically softens prices + rents 12–24 months out; constrained supply supports both.
Investment metrics
- 1% rule
- 1.04% ✓
- Cap rate
- 9.06%
- Cash-on-cash
- 9.89%
- DSCR
- 1.44
- GRM
- 8.0
CMA / ARV
No comps found within radius.
Projected returns pro-forma
6.45% appreciation · 3.0% rent growth · sell at horizon
- IRR
- 24.5%
- Equity multiple
- 2.65×
- Total profit
- $50,841
- Equity at exit
- $72,297
- IRR
- 22.8%
- Equity multiple
- 5.42×
- Total profit
- $136,083
- Equity at exit
- $133,912
Cash invested: $30,800 (down + closing). Projections, not guarantees.
Landlord ↔ Tenant lean methodology
- Overall (STATE)
- 81 Strongly Landlord-Friendly
- State Missouri
- 81 Strongly Landlord-Friendly · R+10
- County
- — inherits STATE
- City
- — inherits STATE
ZIP-level market 64473
- Home prices YoY
- 5.3%
- Active inventory
- 13
- Price-to-rent
- 8.0×
Monthly cashflow live
- Estimated rent
- $1,147 medium interval (Pro) →
- Mortgage (P&I)
- −$577
- Tax from tax record
- −$30 /mo · $357/yr
- Insurance
- −$46
- HOA
- −$0
- Vacancy / Maint / Mgmt
- −$241
- Net cashflow
- $254
Break-even live
UW: 25.0% down · 7.5% · 30yr · 1.5% tax · 5.0% vac · 8.0% maint · 8.0% mgmt
Financing live
Cash to close
- Down payment
- $27,500
- Closing costs
- $3,300
- Reserves months
- —
- Total cash needed
- —
Loan-product check · same deal, 3 products live
Conventional
25% down · 7.5% · 30yr
- Down + closing
- —
- Monthly P&I
- —
- Monthly cashflow
- —
- DSCR
- —
- Eligible?
- —
Personal DTI + credit; lowest rate.
DSCR
20% down · 8.5% · 30yr
- Down + closing
- —
- Monthly P&I
- —
- Monthly cashflow
- —
- DSCR
- —
- Eligible?
- —
No personal income docs; deal must DSCR.
Hard money
10% down · 12.0% · 12mo
- Down + closing
- —
- Monthly P&I
- —
- Monthly cashflow
- —
- DSCR
- —
- Eligible?
- —
Short-term bridge; refi at stabilization.
Listing history 16 events
-
2026-06-18days on market $110,000 Active 22 DOM
-
2026-06-17days on market $110,000 Active 21 DOM
-
2026-06-16days on market $110,000 Active 20 DOM
-
2026-06-15days on market $110,000 Active 19 DOM
-
2026-06-13days on market $110,000 Active 17 DOM
-
2026-06-12days on market $110,000 Active 16 DOM
-
2026-06-09days on market $110,000 Active 13 DOM
-
2026-06-08days on market $110,000 Active 12 DOM
-
2026-06-07days on market $110,000 Active 11 DOM
-
2026-06-07days on market $110,000 Active 10 DOM
-
2026-06-04days on market $110,000 Active 7 DOM
-
2026-06-02days on market $110,000 Active 6 DOM
-
2026-06-01days on market $110,000 Active 5 DOM
-
2026-05-31days on market $110,000 Active 4 DOM
-
2026-05-27$110,000 Active
-
2011-01-28soldstatus
ⓘ Source: listings_history table (triggers on properties + properties_extension) + one-shot
backfill from property_details.listing_events for pre-trigger history.
Tax reassessment forecast MO · Resets to sale price
- Current annual tax
- $357 · $30/mo
- Projected year-2 tax
- $1,067 · $89/mo
- Expected delta
- +$710/yr (+$59/mo · 198.7%)
ⓘ Screening estimate from a state-policy table — verify with the county assessor before closing.
Climate risk First Street
- Flood 1/10 Low 0% chance over 30 yrs
- Wildfire 1/10 Low
- Heat 3/10 Moderate 7 d/yr ≥105°F today · 16 d/yr by 30 yrs out
- Wind 2/10 Low
- Air quality 1/10 Low 0 unhealthy d/yr today · 0 by 30 yrs out
Nearby sold comps map
Loading sold comps map…
Walkable amenities ~0.75 mi
Loading nearby amenities…
Taxation est. · year 1
- Rental income
- $13,768
- − Mortgage interest
- −$6,162
- − Property taxes
- −$357
- − Insurance
- −$550
- − Repairs & maintenance
- −$1,101
- − Management
- −$1,101
- − Depreciation
- −$3,200
- Taxable income
- $1,296
- Est. tax owed @ 24.0%
- −$311
- After-tax cash flow
- $2,736/yr
For passive investors: Depreciation is non-cash, so a rental often shows a tax loss while cash-flowing — sheltering income. Rental losses are passive: they offset passive income freely, and up to $25,000/yr can offset ordinary (W-2) income if you actively participate and your MAGI is under $100k (phasing out to $0 by $150k); unused losses carry forward. On sale, claimed depreciation is recaptured at up to 25%, and gains may owe capital-gains tax (a 1031 exchange can defer both). Figures are a year-1 estimate at your 24.0% rate — not tax advice; consult a CPA.
Schools (NCES district)
- District
- South Holt County R-I
- NCES district ID
- 2923190
- Math proficiency
- 40% ▬ 0.00%
- Reading proficiency
- 50% ▼ -5.00%
- Median HH income
- $43,833
- Composite
- 40.25/100
- National rank
- #7805
- State rank
- #199 of 535 in MO
Livability — Oregon
- Score
- 68/100
- State rank
- #172
- US rank
- #9186
Category grades
Schools grade is shown separately in the Schools card above.
Census & demographics
- Census place
- Oregon, MO
- Population (ZIP)
- 1,267
Population outlook (Holt County) Hauer SSP2
- Today (2025)
- 3,689 people
- By 2030
- 3,318 · -10.1%
- By 2040
- 2,666 · -27.7%
- By 2050
- 2,151 · -41.7%
- By 2075
- 1,390 · -62.3%
- By 2100
- 995 · -73.0%
Race, ethnicity, and origin ACS 2023
- Neighborhood character
- Predominantly White (94%)
- Race & ethnicity
- White 94% Two or more races 4% Black 2%
- Common ancestry
- Romanian 1% Iranian 1% Lithuanian 1%
- Foreign-born
- 0%
Political lean MEDSL · Holt
- 2024 margin
- Solid R (+69.1) · D 15.2% · R 84.3%
- 2008→2024 swing
- -31.4pp toward R · 2008: -37.7pp · 2024: -69.1pp
- All cycles
- 2024: R+69.1 2020: R+69.9 2016: R+67.3 2012: R+50.8 2008: R+37.7
Not yet ingested
- Civics
- —
Market trends
- HPI YoY
- ▲ 6.45%
- Current HPI
- 128.39
- Rent YoY
- —
- Metro
- —
- State GDP YoY
- ▲ 1.84%
- F500 in state
- 20
Industry mix (Fortune 500 HQ in MO)
| Industry | F500 HQs | Revenue |
|---|---|---|
| Healthcare | 1 | $163B |
|
||
| Insurance | 1 | $21B |
|
||
| Industrial Technology | 1 | $17B |
|
||
| Retail | 1 | $16B |
|
||
| Industrial Distribution | 1 | $10B |
|
||
| Utilities | 1 | $9B |
|
||
Price history
2 events — show timeline
- 2026-05-27 Listed $110,000 Heartland MLS as Distributed by MLS Grid
- 2011-01-28 Sold (Public Records) — Public Records
Property tax history
-0.1%/yrLatest (2025): $357 · +2.0% YoY. Source: county tax records.
Cash-flow waterfall
monthlySold comps — $/sqft
last 12 mo · ≤1 miLoading sold comps…