 Fourplex
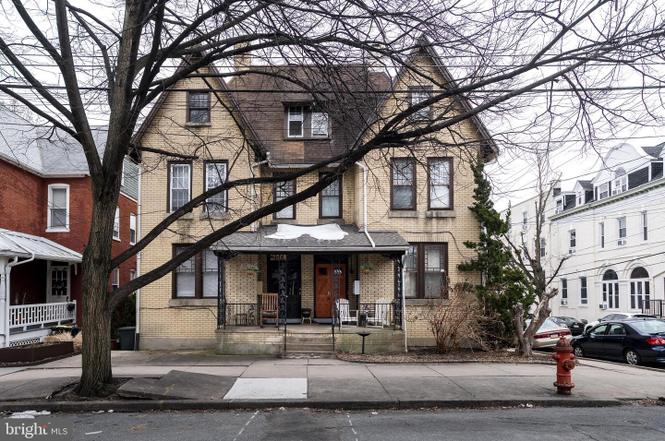
526 W James St · Lancaster, PA
Flood risk 1/10 · Minimal
- FEMA flood zone
- X (unshaded)
- Chance of flooding over 30 yrs
- 0.0%
- Est. flood insurance / yr
- $473 – $860
Fire risk 1/10 · Minimal
- Est. fire insurance / yr
- $511 – $949
Heat risk 6/10 · Moderate
- Hot days now (above 101°F)
- 7 days/yr
- Hot days in 30 yrs
- 15 days/yr
Wind risk 4/10 · Minor
- Chance of severe wind over 30 yrs
- 16.0%
Air-quality risk 4/10 · Minor
- Unhealthy air days now
- 4 days/yr
- Unhealthy air days in 30 yrs
- 7 days/yr
Risk factors via First Street. Map © Google.
Why this score? — see what drove the C- grade
The composite is a weighted blend of 9 inputs, each scored 0–100. Each bar is that input's sub-score; the figure is the points it added to the 100-point composite (weight × sub-score).
- Cash flow +25.0/30.0
- DSCR +8.2/10.0
- 1% rule +6.5/10.0
- Livability +4.2/5.0
- Rent growth +2.6/5.0
- Condition / age +2.5/5.0
- Schools +1.6/10.0
- ARV discount +0.0/15.0
- Appreciation +0.0/10.0
$469,900
🖨 Deal sheet (PDF) 📄 Offer letter ✓ Due diligence
Multi-family units
County records classify this as Multi-Family (2-4 Unit). Listing-text estimate: 4 units. confirmed
Listing remarks
MOTIVATED SELLER! Fully occupied 4‑unit on Lancaster’s West Side, steps from F & M College, Buchanan Park and popular LUCA Italian Kitchen. All four units are 1 BR/1 BA with a strong history of consistent occupancy, providing immediate in‑place income. Current rents are below market, offering a clear value‑add opportunity through strategic upgrades and rent increases over time. Classic Victorian brick architecture, covered front porch, and a highly walkable Chestnut Hill location support long‑term tenant demand and future appreciation. See Documents for Rent Roll. Sellers have identified a 1031 exchange opportunity and are prepared to engage and respond quickly to written offers.
Key facts
- Covered front porch
- Luca italian kitchen
- 4 unit
Tags
Neighborhood map
What this means for you Summary
Snapshot
- This is a 4 × 1.0-bed/1.0-bath units multifamily listed at $470k.
Deal economics
- At list price, monthly cash flow is $1k ($12k/yr) — positive. Per door: $256/mo.
- The deal already cash-flows at list — no discount required.
- Meets the 1% rule at list price ($5k rent vs $470k).
- Recommended offer: $456k (3.0% below list) — sets the bar for market timing.
- Cap rate 8.9% vs local median 4.3% in Lancaster — top-decile yield for the area; either an underpriced asset or a hidden risk that comps aren't pricing in. Stress-test before assuming the spread holds.
Location & tenants
- Location reads 85/100 on livability (#71 in PA, #498 nationally) — a professional / high-income tenant draw. Strengths: amenities A+, commute A+, cost of living A+; Watch: crime C-, employment C-.
- Lancaster SD (urban): math 12% / reading 25% proficiency, ranked #500 of 539 in PA (top 93%) — low school quality limits family demand, transient renter base, plan for 1-2y turnover; 72% free/reduced lunch — lower-income household profile, screen leases tightly.
- Zoned schools: Wharton El Sch (math 32% / reading 52%, grade F, #883 of 1,518 statewide, top 61%, 326 students, 100% FRL); Reynolds Ms (math 6% / reading 31%, grade F, #451 of 512 statewide, top 88%, 527 students, 92% FRL); Mccaskey Campus (math 50% / reading 34%, grade F, #230 of 437 statewide, top 53%, 2,620 students, 88% FRL) — zoned schools average 93% FRL vs 72% district-wide (21 pts higher); higher-poverty schools than district average — tighter screening recommended.
- Zoned-school proficiency averages 34% at this address vs 18% district-wide (+16 pts) — the actual schools serving this property are materially stronger than the Lancaster SD average implies; a family-tenant draw the district grade alone would hide.
- Market conditions: Rents flat; 296 active listings in the ZIP; 10 comparable units currently listed for rent nearby; rentals lingering (median 45d on market — plan ~5-8 weeks vacancy on turnover, expect pricing pressure); 50% of comp listings sitting > 30 days — soft ceiling on asking rent; solid renter incomes; 1,093 units permitted in Lancaster County in 2024 (201 in 5+ unit buildings).
- At $5,387/mo this rent would consume 84% of the median local household income ($77k/yr) (locally 2557% of renters already pay >50% of income on rent) — very limited rent-growth headroom before tenants either downsize or default.
Forward outlook
- Local home prices are declining (-3.0%/yr); year-one equity from $3k of loan paydown is wiped out by about $14k of value loss. Plan a longer hold.
- Lancaster County population projected at +5% by 2050 — modest demand growth; plan on rents tracking national, not racing it.
Negotiation context
- It's been on market 36 days — a 3% lower offer ($456k) is reasonable based on typical stale-listing flexibility.
- Current owner paid $122k; list at $470k implies a 284% gain — meaningful room to come down on a strong offer.
Risks & watch-outs
- Watch-outs: built in 1870 — expect roof / HVAC / electrical / plumbing capex.
- Climate carrying-cost: extreme-heat days projected 7→15/yr by 2055 (HVAC capex compounding) — expect insurance premiums to compound above CPI over the hold.
Questions for the listing agent
- It's been on market 36 days. Have you received any prior offers? Is the seller open to a 3% concession, seller financing, or rate buy-down credit?
- Can we see the unit-by-unit rent roll, current vacancy, and any below-market leases? What's the average tenancy length?
- What capital expenditures (roof, boiler, parking lot, exteriors) have been made in the last 5 years, and what's planned in the next 2?
- Built in 1870 — when were the roof, HVAC, electrical panel, plumbing, and water heater last replaced?
- Is there a deadline driving the sale (1031 exchange, divorce, estate, relocation)? That informs how much negotiation room exists.
- What's the average days-on-market for RENTAL listings here right now (not sales)? A rising rental-DOM trend means longer vacancies and softer asking-rent achievability than the comps imply.
- What's the recent tenant-quality profile in this submarket — average credit score on applications, eviction rate, late-payment / NSF rate, and stable-employment percentage? A property-management company in the area should have these aggregated.
- How much new apartment / multifamily construction is in the pipeline within 1–3 miles? Heavy new supply (>2% of stock underway) typically softens rents 12–24 months out; light construction supports rent growth.
Investment metrics
- 1% rule
- 1.15% ✓
- Cap rate
- 8.91%
- Cash-on-cash
- 9.35%
- DSCR
- 1.42
- GRM
- 7.3
CMA / ARV
- ARV (on-the-fly)
- $330,106
- Comps found
- 12
Show comp detail 12 sales within ~0.75 mi
| Address | Dist | Beds/Ba | Sqft | Sold | Price | $/sf | Match |
|---|---|---|---|---|---|---|---|
| 329 W King St | 0.56mi | 4/— | 2,149 (-5%) | 1mo | $270,000 | $126 | 64 |
| 14 W James St | 0.49mi | 4/2.0 | 2,280 (+1%) | 4mo | $330,000 | $145 | 64 |
| 102 Ruby St | 0.59mi | 4/3.0 | 2,379 (+5%) | 1mo | $300,000 | $126 | 59 |
| 213 N Mulberry St | 0.40mi | 5/— (+1) | 2,592 (+15%) | 1mo | $400,000 | $154 | 51 |
| 503-505 Manor St | 0.63mi | 4/3.0 | 2,056 (-9%) | 1mo | $355,000 | $173 | 51 |
| 433 N Queen St | 0.53mi | 4/— | 2,468 (+9%) | 12mo | $472,500 | $191 | 50 |
| 128 E New St | 0.71mi | 4/— | 2,474 (+9%) | 2mo | $360,000 | $146 | 49 |
| 410 W Vine St | 0.72mi | 5/2.5 (+1) | 2,311 (+2%) | 5mo | $252,500 | $109 | 48 |
| 642 Second St | 0.67mi | 4/— | 2,013 (-11%) | 4mo | $270,000 | $134 | 48 |
| 528 Manor St | 0.67mi | 4/4.0 | 2,465 (+9%) | 8mo | $434,000 | $176 | 47 |
| 506 N Queen St | 0.51mi | 5/3.0 (+1) | 2,553 (+13%) | 1mo | $440,000 | $172 | 45 |
| 635 Manor St | 0.74mi | 4/— | 2,490 (+10%) | 5mo | $356,775 | $143 | 44 |
Match score weights: distance 35% · size 25% · config 20% · recency 20%. Top-matched comps best support the ARV.
Projected returns pro-forma
-3.0% appreciation · 0.47% rent growth · sell at horizon
- IRR
- -5.1%
- Equity multiple
- 0.82×
- Total profit
- $-24,175
- Equity at exit
- $70,064
- IRR
- 1.3%
- Equity multiple
- 1.08×
- Total profit
- $11,113
- Equity at exit
- $40,628
Cash invested: $131,572 (down + closing). Projections, not guarantees.
Landlord ↔ Tenant lean methodology
- Overall (STATE)
- 62 Landlord-Friendly
- State Pennsylvania
- 62 Landlord-Friendly · EVEN
- County
- — inherits STATE
- City
- — inherits STATE
ZIP-level market 17603
- Rents YoY
- 0.5%
- Active inventory
- 296
- Price-to-rent
- 29.1×
Monthly cashflow live
- Estimated rent
- $5,387 high interval (Pro) →
- Mortgage (P&I)
- −$2,464
- Tax from tax record
- −$571 /mo · $6,851/yr
- Insurance
- −$196
- HOA
- −$0
- Vacancy / Maint / Mgmt
- −$1,131
- Net cashflow
- $1,025
Break-even live
Sensitivity live
| Price | -10% $1,291 | -5% $1,158 | +0% $1,025 | +5% $892 | +10% $759 |
|---|---|---|---|---|---|
| Rent | -10% $599 | -5% $812 | +0% $1,025 | +5% $1,238 | +10% $1,450 |
| Rate | -1.0pp $1,261 | -0.5pp $1,144 | base $1,025 | +0.5pp $903 | +1.0pp $779 |
4-unit breakdown (identical units grouped — click to expand)
| Units | Beds | Baths | Est. rent |
|---|---|---|---|
| 4× units | 1.0 | 1 | $5,388 |
| #1 | 1.0 | 1 | $1,347 |
| #2 | 1.0 | 1 | $1,347 |
| #3 | 1.0 | 1 | $1,347 |
| #4 | 1.0 | 1 | $1,347 |
| Total (4 units) | $5,387 | ||
UW: 25.0% down · 7.5% · 30yr · 1.5% tax · 5.0% vac · 8.0% maint · 8.0% mgmt
Financing live
Cash to close
- Down payment
- $117,475
- Closing costs
- $14,097
- Reserves months
- —
- Total cash needed
- —
Loan-product check · same deal, 3 products live
Conventional
25% down · 7.5% · 30yr
- Down + closing
- —
- Monthly P&I
- —
- Monthly cashflow
- —
- DSCR
- —
- Eligible?
- —
Personal DTI + credit; lowest rate.
DSCR
20% down · 8.5% · 30yr
- Down + closing
- —
- Monthly P&I
- —
- Monthly cashflow
- —
- DSCR
- —
- Eligible?
- —
No personal income docs; deal must DSCR.
Hard money
10% down · 12.0% · 12mo
- Down + closing
- —
- Monthly P&I
- —
- Monthly cashflow
- —
- DSCR
- —
- Eligible?
- —
Short-term bridge; refi at stabilization.
Rent comps 10 comps
| Address | Beds | Baths | Sqft | Rent | $/sqft | DOM | Units | Dist |
|---|---|---|---|---|---|---|---|---|
| 520 W Frederick St Lancaster, PA | 4.0 | 1.0 | 1713 | $1,895 | $1.11 | 45d | 1 | 0.09mi |
| 337 W Lemon St Unit 2 Lancaster, PA | 3.0 | 1.0 | 1588 | $1,895 | $1.19 | 15d | 1 | 0.22mi |
| 403 N Queen St Lancaster, PA | 3.0 | 2.0 | 1950 | $3,500 | $1.79 | 15d | 1 | 0.55mi |
| 118 N Prince St Lancaster, PA | 1.0–3.0 | 1.0–3.0 | 1274 | $4,703 | $3.69 | 15d | 48 | 0.57mi |
| 49 W Farnum St Lancaster, PA | 3.0 | 1.0 | 1820 | $1,650 | $0.91 | 45d | 1 | 0.89mi |
| 1121 Spring Grove Ave Lancaster, PA | 4.0 | 2.0 | 1755 | $2,200 | $1.25 | 45d | 1 | 1.00mi |
| 611 S West End Ave Lancaster, PA | 4.0 | 1.5 | 1589 | $1,800 | $1.13 | 15d | 1 | 1.02mi |
| 836 N Plum St Lancaster, PA | 3.0 | 2.0 | 1602 | $2,150 | $1.34 | 15d | 1 | 1.03mi |
| 631 E Frederick St Lancaster, PA | 3.0 | 1.0 | 1830 | $1,850 | $1.01 | 45d | 1 | 1.21mi |
| 708 S Lime St Unit 3 Lancaster, PA | 4.0 | 1.0 | 1742 | $1,850 | $1.06 | 45d | 1 | 1.43mi |
Listing history 5 events
-
2026-04-18status Pending
-
2026-03-31price $469,900
-
2026-03-12$499,900 Active
-
2003-07-22soldstatus $122,500
-
1996-05-13soldstatus $59,900
ⓘ Source: listings_history table (triggers on properties + properties_extension) + one-shot
backfill from property_details.listing_events for pre-trigger history.
Tax reassessment forecast PA · Partial reset (capped growth)
- Current annual tax
- $6,851 · $571/mo
- Projected year-2 tax
- $7,138 · $595/mo
- Expected delta
- +$287/yr (+$24/mo · 4.2%)
ⓘ Screening estimate from a state-policy table — verify with the county assessor before closing.
Climate risk First Street
- Flood 1/10 Low FEMA zone X (unshaded) · 0% chance over 30 yrs
- Wildfire 1/10 Low
- Heat 6/10 Major 7 d/yr ≥101°F today · 15 d/yr by 30 yrs out
- Wind 4/10 Moderate 16% chance of damaging wind over 30 yrs
- Air quality 4/10 Moderate 4 unhealthy d/yr today · 7 by 30 yrs out
Nearby sold comps map
Loading sold comps map…
Walkable amenities ~0.75 mi
Loading nearby amenities…
Taxation est. · year 1
- Rental income
- $64,644
- − Mortgage interest
- −$26,322
- − Property taxes
- −$6,851
- − Insurance
- −$2,350
- − Repairs & maintenance
- −$5,172
- − Management
- −$5,172
- − Depreciation
- −$13,670
- Taxable income
- $5,109
- Est. tax owed @ 24.0%
- −$1,226
- After-tax cash flow
- $11,072/yr
For passive investors: Depreciation is non-cash, so a rental often shows a tax loss while cash-flowing — sheltering income. Rental losses are passive: they offset passive income freely, and up to $25,000/yr can offset ordinary (W-2) income if you actively participate and your MAGI is under $100k (phasing out to $0 by $150k); unused losses carry forward. On sale, claimed depreciation is recaptured at up to 25%, and gains may owe capital-gains tax (a 1031 exchange can defer both). Figures are a year-1 estimate at your 24.0% rate — not tax advice; consult a CPA.
Schools (NCES district)
- District
- Lancaster SD
- NCES district ID
- 4213140
- Math proficiency
- 12% ▼ -10.00%
- Reading proficiency
- 25% ▼ -13.00%
- Median HH income
- $38,500
- Composite
- 15.52/100
- National rank
- #9301
- State rank
- #500 of 539 in PA
Livability — Lancaster
- Score
- 85/100
- State rank
- #71
- US rank
- #498
Category grades
Schools grade is shown separately in the Schools card above.
Census & demographics
- Census place
- Lancaster, PA
- County
- Lancaster County · 390,309 people
- City population
- 176,170
- Metro
- Lancaster, PA
- Population (ZIP)
- 67,571
- Household income
- $77,084
- Rent vs Own
- Severe rent burden
- 2557.0
Population outlook (Lancaster County) Hauer SSP2
- Today (2025)
- 561,011 people
- By 2030
- 570,969 · +1.8%
- By 2040
- 585,929 · +4.4%
- By 2050
- 591,056 · +5.4%
- By 2075
- 594,747 · +6.0%
- By 2100
- 558,850 · -0.4%
Race, ethnicity, and origin ACS 2023
- Neighborhood character
- Diverse neighborhood (Simpson 0.59)
- Race & ethnicity
- White 58% Hispanic / Latino 27% Two or more races 12% Black 7% Asian 4%
- Hispanic origin (detail)
- Mexican 1% Puerto Rican 19% Cuban 1% Dominican 2%
- Common ancestry
- Romanian 2% Slovak 2% Lithuanian 1%
- Foreign-born
- 9% · Canada, China, India
- Languages at home
- 77% English-only · Spanish 17% Other Indo-European 1% Chinese 1%
Political lean MEDSL · Lancaster
- 2024 margin
- R (+15.9) · D 41.5% · R 57.5%
- 2008→2024 swing
- -4.1pp toward R · 2008: -11.8pp · 2024: -15.9pp
- All cycles
- 2024: R+15.9 2020: R+15.8 2016: R+19.7 2012: R+19.2 2008: R+11.8
Not yet ingested
- Civics
- —
Market trends
- HPI YoY
- ▼ -508.78%
- Current HPI
- 289.3324
- Rent YoY
- ▲ 0.47%
- Metro
- Lancaster, PA
- State GDP YoY
- ▲ 1.68%
- F500 in state
- 34
Industry mix (Fortune 500 HQ in PA)
| Industry | F500 HQs | Revenue |
|---|---|---|
| Healthcare | 2 | $309B |
|
||
| Insurance | 2 | $27B |
|
||
| Telecommunications / Media | 1 | $124B |
|
||
| Industrial Distribution | 1 | $22B |
|
||
| Financial Services | 1 | $20B |
|
||
| Chemicals / Materials | 1 | $18B |
|
||
Price history
+684.5% since first listed5 events — show timeline
- 2026-04-18 Pending — BRIGHT MLS
- 2026-03-31 Price Changed $469,900 BRIGHT MLS
- 2026-03-12 Listed $499,900 BRIGHT MLS
- 2003-07-22 Sold (Public Records) $122,500 Public Records
- 1996-05-13 Sold (Public Records) $59,900 Public Records
Property tax history
+3.9%/yrLatest (2026): $6,851 · +3.3% YoY. Source: county tax records.
Cash-flow waterfall
monthlySold comps — $/sqft
last 12 mo · ≤1 miLoading sold comps…