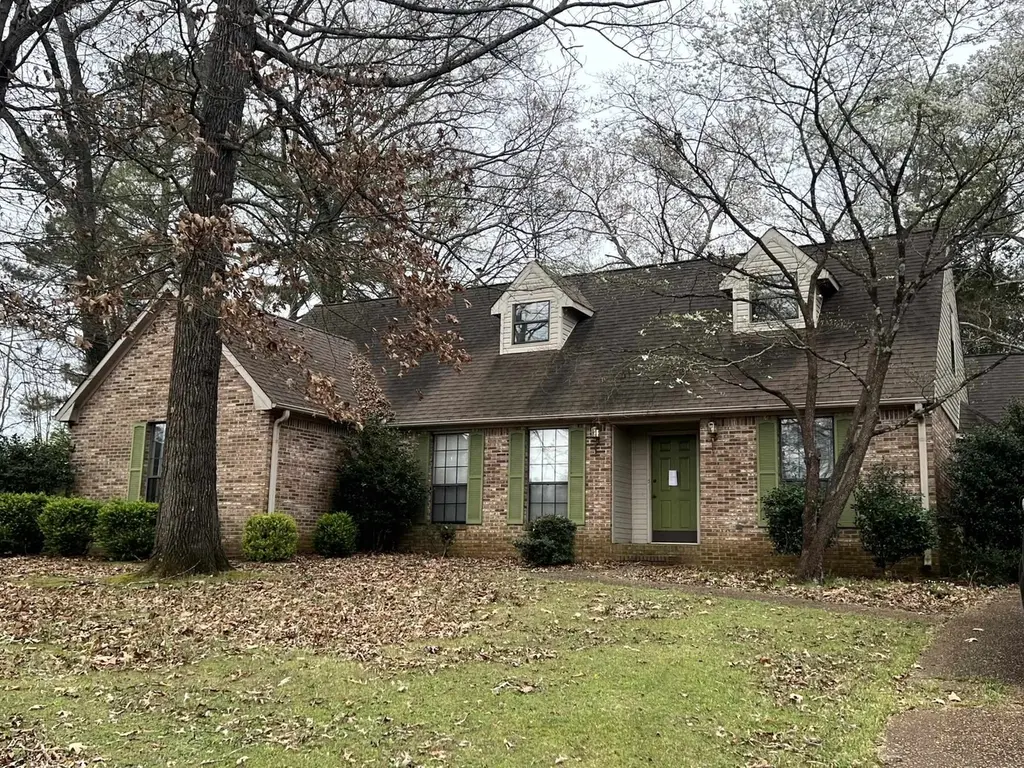
1903 Beechwood Cir · Florence, AL
Flood risk 1/10 · Minimal
- FEMA flood zone
- X (unshaded)
- Chance of flooding over 30 yrs
- 0.0%
- Est. flood insurance / yr
- $507 – $1,088
Fire risk 1/10 · Minimal
- Est. fire insurance / yr
- $916 – $1,700
Heat risk 6/10 · Moderate
- Hot days now (above 107°F)
- 7 days/yr
- Hot days in 30 yrs
- 20 days/yr
Wind risk 5/10 · Moderate
- Chance of severe wind over 30 yrs
- 23.0%
Air-quality risk 2/10 · Minimal
- Unhealthy air days now
- 0 days/yr
- Unhealthy air days in 30 yrs
- 1 days/yr
Risk factors via First Street. Map © Google.
Why this score? — see what drove the D+ grade
The composite is a weighted blend of 9 inputs, each scored 0–100. Each bar is that input's sub-score; the figure is the points it added to the 100-point composite (weight × sub-score).
- ARV discount +15.0/15.0
- Cash flow +12.9/30.0
- 1% rule +4.1/10.0
- Livability +4.1/5.0
- Rent growth +4.0/5.0
- DSCR +3.9/10.0
- Schools +3.0/10.0
- Condition / age +2.5/5.0
- Appreciation +0.0/10.0
$175,000
🖨 Deal sheet 📄 Offer letter ✓ Due diligence
Listing remarks
Being sold AS-IS, this home presents an excellent investment opportunity in an area where inventory is limited and demand remains strong. Enjoy the charm of an established neighborhood with the convenience of everything Florence has to offer just moments away. Buyer to verify everything.
Key facts
- 0.38 acre lot
- 3 garage spots
- Built 1985
Property features AI
Finance
- Financial info: Annual tax amount listed (not included per instructions)
Exterior
- Parking: Attached and detached garage space; Three garage spaces
- Utilities: Public sewer
- Home design: Single-family residence; Residential property; Fixer condition; Above-grade finished area about 2,500
- Exterior features: Lot approximately 0.38 acres; Lot dimensions about 84.9' x 200' (irregular); Subdivision: Beechwood
Interior
- Bedrooms: Two main-level bedrooms
- Bathrooms: Three full bathrooms; Two bathrooms on the main level
- Interior features: Fireplace (1)
Neighborhood map
What this means for you Summary
Snapshot
- This is a 4-bed/3.0-bath single-family listed at $175k.
Deal economics
- At list price, monthly cash flow is $-13 ($-151/yr) — negative.
- To cash-flow at today's rent, offer at most $173k (1.3% below list).
- To meet the 1% rule (rent ≥ 1% of price), the offer needs to be $160k (8.5% below list).
- Recommended offer: $160k (8.5% below list) — sets the bar for 1% rule.
- Cap rate 6.2% vs local median 3.6% in Florence — top-decile yield for the area; either an underpriced asset or a hidden risk that comps aren't pricing in. Stress-test before assuming the spread holds.
Location & tenants
- Location reads 82/100 on livability (#4 in AL, #1,140 nationally) — a professional / high-income tenant draw. Strengths: amenities A+, commute A+, cost of living A+; Watch: crime F, employment F.
- Florence City (urban): math 28% / reading 44% proficiency, ranked #44 of 129 in AL (top 34%) — families likely to look elsewhere, expect single-tenant / working-renter base with shorter leases.
- Zoned schools: Forest Hills School (math 39% / reading 65%, grade C-, #102 of 627 statewide, top 17%, 831 students, 45% FRL); Florence Middle School (math 22% / reading 44%, grade F, #101 of 257 statewide, top 40%, 689 students, 51% FRL); Florence High School (math 28% / reading 34%, grade F, #66 of 305 statewide, top 21%, 1,034 students, 36% FRL).
- Market conditions: Rents rising fast (+6.2%/yr); 268 active listings in the ZIP; 1 comparable units currently listed for rent nearby; 164 units permitted in Lauderdale County in 2024 (72 in 5+ unit buildings).
- This rent runs 41% of the median local income ($46k/yr) — at the standard rent-burdened threshold; future hikes will face affordability resistance.
Forward outlook
- Local home prices are declining (-3.0%/yr); year-one equity from $1k of loan paydown is wiped out by about $5k of value loss. Plan a longer hold.
Negotiation context
- Only 1 days on market — expect competitive offers; lowballing is unlikely to land.
- 2 sale attempts since 20y ago with the ask held roughly flat each time — persistent listings suggest the price (not the market) is what's stuck; bring a comps-based counter.
Risks & watch-outs
- Climate carrying-cost: moderate wind risk, 23% chance of damaging wind over 30y; extreme-heat days projected 7→20/yr by 2055 (HVAC capex compounding) — expect insurance premiums to compound above CPI over the hold.
Questions for the listing agent
- What do current leases actually rent for vs. the listed asking? Can we see a recent rent roll and the last 12 months of T-12 income?
- Is there a deadline driving the sale (1031 exchange, divorce, estate, relocation)? That informs how much negotiation room exists.
- Crime grade is F in this area — have there been break-ins, vandalism, or insurance claims at this property in the last 3 years? What carrier currently insures it and at what premium?
- The area grade is low — what's the realistic commute time and amenity access for the typical tenant pool here? Any planned neighborhood developments (good or bad) we should know about?
- What's the average days-on-market for RENTAL listings here right now (not sales)? A rising rental-DOM trend means longer vacancies and softer asking-rent achievability than the comps imply.
- What's the recent tenant-quality profile in this submarket — average credit score on applications, eviction rate, late-payment / NSF rate, and stable-employment percentage? A property-management company in the area should have these aggregated.
- How much new for-sale + rental construction is in the pipeline within 1–3 miles? Heavy new supply typically softens prices + rents 12–24 months out; constrained supply supports both.
Investment metrics
- 1% rule
- 0.91% ✗
- Cap rate
- 6.21%
- Cash-on-cash
- -0.31%
- DSCR
- 0.99
- GRM
- 9.1
CMA / ARV
- ARV (on-the-fly)
- $327,700
- Comps found
- 11
Show comp detail 11 sales within ~0.75 mi
| Address | Dist | Beds/Ba | Sqft | Sold | Price | $/sf | Match |
|---|---|---|---|---|---|---|---|
| 1925 S Beechwood Dr | 0.05mi | 4/2.5 | 2,825 (-3%) | 24mo | $299,000 | $106 | 72 |
| 1907 N Beechwood Dr | 0.15mi | 4/2.5 | 2,504 (-14%) | 5mo | $289,900 | $116 | 64 |
| 245 Sequoia Blvd | 0.20mi | 4/3.0 | 3,165 (+9%) | 18mo | $285,000 | $90 | 60 |
| 1942 Charlotte Ct | 0.54mi | 3/2.5 (-1) | 2,846 (-2%) | 9mo | $475,000 | $167 | 58 |
| 153 Cedarcrest Dr | 0.39mi | 3/2.5 (-1) | 3,000 (+3%) | 18mo | $455,000 | $152 | 54 |
| 137 S Sequoia Blvd | 0.50mi | 4/4.0 | 2,698 (-7%) | 9mo | $369,900 | $137 | 53 |
| 103 Creekwood Cir | 0.70mi | 4/3.0 | 2,722 (-6%) | 12mo | $265,000 | $97 | 48 |
| 1926 Charlotte Ct | 0.63mi | 4/3.0 | 2,616 (-10%) | 11mo | $390,000 | $149 | 45 |
| 118 Cedarcrest Dr | 0.44mi | 5/3.0 (+1) | 3,100 (+7%) | 22mo | $350,000 | $113 | 45 |
| 114 Cedarcrest Dr | 0.46mi | 4/3.5 | 2,607 (-10%) | 23mo | $255,000 | $98 | 41 |
| 120 S Sequoia Blvd | 0.51mi | 4/2.0 | 2,541 (-12%) | 18mo | $284,000 | $112 | 36 |
Match score weights: distance 35% · size 25% · config 20% · recency 20%. Top-matched comps best support the ARV.
Projected returns pro-forma
-3.0% appreciation · 6.18% rent growth · sell at horizon
- IRR
- -13.1%
- Equity multiple
- 0.51×
- Total profit
- $-23,809
- Equity at exit
- $26,093
- IRR
- 0.4%
- Equity multiple
- 1.03×
- Total profit
- $1,653
- Equity at exit
- $15,131
Cash invested: $49,000 (down + closing). Projections, not guarantees.
Landlord ↔ Tenant lean methodology
- Overall (STATE)
- 90 Strongly Landlord-Friendly
- State Alabama
- 90 Strongly Landlord-Friendly · R+15
- County
- — inherits STATE
- City
- — inherits STATE
ZIP-level market 35630
- Home prices YoY
- -33.7%
- Rents YoY
- 6.2%
- Active inventory
- 268
- Price-to-rent
- 9.1×
Monthly cashflow live
- Estimated rent
- $1,601 medium interval (Pro) →
- Mortgage (P&I)
- −$918
- Tax from tax record
- −$286 /mo · $3,438/yr
- Insurance
- −$73
- HOA
- −$0
- Vacancy / Maint / Mgmt
- −$336
- Net cashflow
- $-13
Break-even live
UW: 25.0% down · 7.5% · 30yr · 1.5% tax · 5.0% vac · 8.0% maint · 8.0% mgmt
Financing live
Cash to close
- Down payment
- $43,750
- Closing costs
- $5,250
- Reserves months
- —
- Total cash needed
- —
Loan-product check · same deal, 3 products live
Conventional
25% down · 7.5% · 30yr
- Down + closing
- —
- Monthly P&I
- —
- Monthly cashflow
- —
- DSCR
- —
- Eligible?
- —
Personal DTI + credit; lowest rate.
DSCR
20% down · 8.5% · 30yr
- Down + closing
- —
- Monthly P&I
- —
- Monthly cashflow
- —
- DSCR
- —
- Eligible?
- —
No personal income docs; deal must DSCR.
Hard money
10% down · 12.0% · 12mo
- Down + closing
- —
- Monthly P&I
- —
- Monthly cashflow
- —
- DSCR
- —
- Eligible?
- —
Short-term bridge; refi at stabilization.
Rent comps 1 comps
| Address | Beds | Baths | Sqft | Rent | $/sqft | DOM | Units | Dist |
|---|---|---|---|---|---|---|---|---|
| 212 Woodcastle Dr Florence, AL | 3.0 | 2.0 | 2262 | $1,400 | $0.62 | 44d | 1 | 0.56mi |
Listing history 3 events
-
2026-05-24status Pending
-
2026-05-20$175,000 Active
-
2006-08-07$199,900
ⓘ Source: listings_history table (triggers on properties + properties_extension) + one-shot
backfill from property_details.listing_events for pre-trigger history.
Tax reassessment forecast AL · Resets to sale price
- Current annual tax
- $3,438 · $286/mo
- Projected year-2 tax
- $3,438 · $286/mo
- Expected delta
- $0/yr ($0/mo · 0.0%)
ⓘ Screening estimate from a state-policy table — verify with the county assessor before closing.
Climate risk First Street
- Flood 1/10 Low FEMA zone X (unshaded) · 0% chance over 30 yrs
- Wildfire 1/10 Low
- Heat 6/10 Major 7 d/yr ≥107°F today · 20 d/yr by 30 yrs out
- Wind 5/10 Major 23% chance of damaging wind over 30 yrs
- Air quality 2/10 Low 0 unhealthy d/yr today · 1 by 30 yrs out
Nearby sold comps map
Loading sold comps map…
Walkable amenities ~0.75 mi
Loading nearby amenities…
Taxation est. · year 1
- Rental income
- $19,208
- − Mortgage interest
- −$9,803
- − Property taxes
- −$3,438
- − Insurance
- −$875
- − Repairs & maintenance
- −$1,537
- − Management
- −$1,537
- − Depreciation
- −$5,091
- Taxable loss
- −$3,072
- Est. tax savings @ 24.0%
- +$737
- After-tax cash flow
- $586/yr
For passive investors: Depreciation is non-cash, so a rental often shows a tax loss while cash-flowing — sheltering income. Rental losses are passive: they offset passive income freely, and up to $25,000/yr can offset ordinary (W-2) income if you actively participate and your MAGI is under $100k (phasing out to $0 by $150k); unused losses carry forward. On sale, claimed depreciation is recaptured at up to 25%, and gains may owe capital-gains tax (a 1031 exchange can defer both). Figures are a year-1 estimate at your 24.0% rate — not tax advice; consult a CPA.
Schools (NCES district)
- District
- Florence City
- NCES district ID
- 0101530
- Math proficiency
- 28% ▼ -28.00%
- Reading proficiency
- 44% ▼ -4.00%
- Median HH income
- $34,997
- Composite
- 29.69/100
- National rank
- #6456
- State rank
- #44 of 129 in AL
Livability — Florence
- Score
- 82/100
- State rank
- #4
- US rank
- #1140
Category grades
Schools grade is shown separately in the Schools card above.
Census & demographics
- Census place
- Florence, AL
- County
- Lauderdale County · 47,988 people
- City population
- 34,028
- Metro
- Florence-Muscle Shoals, AL
- Population (ZIP)
- 34,028
- Household income
- $46,304
- Rent vs Own
- Severe rent burden
- 1516.0
Population outlook (Lauderdale County) Hauer SSP2
- Today (2025)
- 93,386 people
- By 2030
- 93,634 · +0.3%
- By 2040
- 93,114 · -0.3%
- By 2050
- 91,586 · -1.9%
- By 2075
- 88,667 · -5.1%
- By 2100
- 81,098 · -13.2%
Race, ethnicity, and origin ACS 2023
- Neighborhood character
- Predominantly White (70%)
- Race & ethnicity
- White 70% Black 18% Two or more races 6% Hispanic / Latino 6%
- Hispanic origin (detail)
- Mexican 5%
- Common ancestry
- Slovak 3% Serbian 2% Romanian 1%
- Foreign-born
- 4% · Canada, Vietnam, Guatemala
- Languages at home
- 92% English-only · Spanish 6% Vietnamese 1%
Political lean MEDSL · Lauderdale
- 2024 margin
- Solid R (+51.5) · D 23.8% · R 75.3%
- 2008→2024 swing
- -23.3pp toward R · 2008: -28.2pp · 2024: -51.5pp
- All cycles
- 2024: R+51.5 2020: R+44.7 2016: R+46.0 2012: R+30.9 2008: R+28.2
Not yet ingested
- Civics
- —
Market trends
- HPI YoY
- ▼ -104.78%
- Current HPI
- 206.1364
- Rent YoY
- ▲ 6.18%
- Metro
- Florence-Muscle Shoals, AL
- State GDP YoY
- ▲ 2.94%
- F500 in state
- 4
Industry mix (Fortune 500 HQ in AL)
| Industry | F500 HQs | Revenue |
|---|---|---|
| Financial Services | 1 | $8B |
|
||
| Healthcare | 1 | $5B |
|
||
Price history
-12.5% since first listed3 events — show timeline
- 2026-05-24 Pending — SAARMLS
- 2026-05-20 Listed $175,000 SAARMLS
- 2006-08-07 Listed $199,900 SAARMLS
Property tax history
+4.3%/yrLatest (2025): $3,438 · +0.0% YoY. Source: county tax records.
Cash-flow waterfall
monthlySold comps — $/sqft
last 12 mo · ≤1 miLoading sold comps…