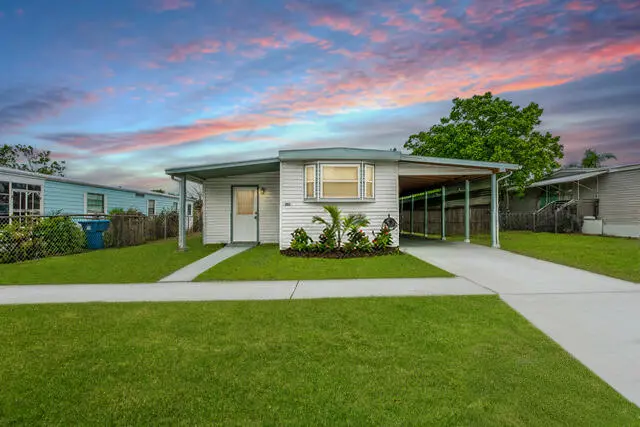
2531 Chatham Way NE · Palm Bay, FL
Flood risk 1/10 · Minimal
- FEMA flood zone
- X (unshaded)
- Chance of flooding over 30 yrs
- 0.0%
- Est. flood insurance / yr
- $507 – $1,088
Fire risk 1/10 · Minimal
- Est. fire insurance / yr
- $947 – $1,759
Heat risk 10/10 · Severe
- Hot days now (above 105°F)
- 7 days/yr
- Hot days in 30 yrs
- 22 days/yr
Wind risk 10/10 · Severe
- Chance of severe wind over 30 yrs
- 99.0%
Air-quality risk 1/10 · Minimal
- Unhealthy air days now
- 0 days/yr
- Unhealthy air days in 30 yrs
- 0 days/yr
Risk factors via First Street. Map © Google.
Why this score? — see what drove the D+ grade
The composite is a weighted blend of 9 inputs, each scored 0–100. Each bar is that input's sub-score; the figure is the points it added to the 100-point composite (weight × sub-score).
- Cash flow +16.6/30.0
- ARV discount +7.5/15.0
- DSCR +5.2/10.0
- Schools +4.7/10.0
- 1% rule +4.0/10.0
- Livability +3.6/5.0
- Condition / age +2.5/5.0
- Rent growth +2.4/5.0
- Appreciation +2.2/10.0
$169,999
🖨 Deal sheet 📄 Offer letter ✓ Due diligence
Listing remarks
Minutes to the beach!! Land OWNED, City - Water and Sewer. NO HOA LIMITATIONS! NO HOA HEADACHES! Experience modern living in this beautifully remodeled and completely updated 3-bedroom, 2-bathroom home just minutes from the beach. With NO HOA and ownership of the land, this property offers the perfect blend of style, comfort, and flexibility. One bedroom features a private entrance, creating an excellent opportunity for additional income by renting the room while living in the other two bedrooms. Recent improvements include a newly resealed roof, adding peace of mind for the next owner. Conveniently located near shopping, dining, and coastal attractions, this move-in-ready home is packed wi
Key facts
- No hoa limitations
- No hoa headaches
- Minutes to the beach
Tags
Property features AI
Finance
- Other: Pets allowed with no restrictions
- Financial info: No land lease
Exterior
- Parking: Attached carport; Covered parking for 2 vehicles; Total 2 parking spaces
- Utilities: Public water; Public sewer; Sewer and water available
- Home design: Mobile home (modular construction); One story; Faces south; Resale condition
- Construction: Modular construction; Aluminum roof; Owner-reported building area 1,010
- Exterior features: Sidewalks; Cross-fenced yard; Not waterfront
Interior
- Kitchen: Dishwasher; Electric range; Microwave; Refrigerator; Electric water heater
- Bedrooms: Three main-level bedrooms
- Flooring: Vinyl flooring
- Bathrooms: Two full bathrooms on the main level
- Heating & cooling: Central electric heating; Central air conditioning (electric)
- Interior features: No notable built-in interior features listed
- Laundry & utility: Laundry area (other type)
Neighborhood map
What this means for you Summary
Snapshot
- This is a 3-bed/1.0-bath manufactured listed at $170k.
Deal economics
- At list price, monthly cash flow is $103 ($1k/yr) — positive.
- The deal already cash-flows at list — no discount required.
- To meet the 1% rule (rent ≥ 1% of price), the offer needs to be $153k (10.2% below list).
- Recommended offer: $153k (10.2% below list) — sets the bar for 1% rule.
Location & tenants
- Location reads 72/100 on livability (#366 in FL) — a middle-class / working-renter tenant base. Strengths: cost of living A+, housing A+; Watch: schools C-, employment D+, amenities F.
- Brevard (suburban): math 53% / reading 57% proficiency, ranked #19 of 73 in FL (top 26%) — acceptable for families but not a draw, mixed tenant base, ~2y average lease.
- Market conditions: Rents soft (-0.5%/yr); 321 active listings in the ZIP; 4 comparable units currently listed for rent nearby; rentals at typical pace (median 24d on market — plan ~3-4 weeks tenant-placement turnaround); 4,602 units permitted in Brevard County in 2024 (702 in 5+ unit buildings).
- This rent runs 32% of the median local income ($56k/yr) — at the standard rent-burdened threshold; future hikes will face affordability resistance.
Forward outlook
- Local home prices are declining (-3.0%/yr); year-one equity from $1k of loan paydown is wiped out by about $5k of value loss. Plan a longer hold.
- Brevard County population projected at +15% by 2050 — modest demand growth; plan on rents tracking national, not racing it.
Negotiation context
- It's been on market 16 days — a 2% lower offer ($167k) is reasonable based on typical stale-listing flexibility.
- 12 sale attempts since 2y ago with the ask held roughly flat each time — persistent listings suggest the price (not the market) is what's stuck; bring a comps-based counter.
- Current owner paid $110k; list at $170k implies a 55% gain — meaningful room to come down on a strong offer.
Risks & watch-outs
- Climate carrying-cost: severe wind risk, 99% chance of damaging wind over 30y; extreme-heat days projected 7→22/yr by 2055 (HVAC capex compounding) — expect insurance premiums to compound above CPI over the hold.
Questions for the listing agent
- Built in 1971 — when were the roof, HVAC, electrical panel, plumbing, and water heater last replaced?
- Is there a deadline driving the sale (1031 exchange, divorce, estate, relocation)? That informs how much negotiation room exists.
- The area grade is low — what's the realistic commute time and amenity access for the typical tenant pool here? Any planned neighborhood developments (good or bad) we should know about?
- What's the average days-on-market for RENTAL listings here right now (not sales)? A rising rental-DOM trend means longer vacancies and softer asking-rent achievability than the comps imply.
- What's the recent tenant-quality profile in this submarket — average credit score on applications, eviction rate, late-payment / NSF rate, and stable-employment percentage? A property-management company in the area should have these aggregated.
- How much new for-sale + rental construction is in the pipeline within 1–3 miles? Heavy new supply typically softens prices + rents 12–24 months out; constrained supply supports both.
Investment metrics
- 1% rule
- 0.90% ✗
- Cap rate
- 7.02%
- Cash-on-cash
- 2.59%
- DSCR
- 1.12
- GRM
- 9.3
CMA / ARV
No comps found within radius.
Projected returns pro-forma
-3.0% appreciation · 0.0% rent growth · sell at horizon
- IRR
- -15.5%
- Equity multiple
- 0.46×
- Total profit
- $-25,509
- Equity at exit
- $25,347
- IRR
- -12.8%
- Equity multiple
- 0.35×
- Total profit
- $-31,171
- Equity at exit
- $14,698
Cash invested: $47,600 (down + closing). Projections, not guarantees.
Landlord ↔ Tenant lean methodology
- Overall (STATE)
- 87 Strongly Landlord-Friendly
- State Florida
- 87 Strongly Landlord-Friendly · R+3
- County
- — inherits STATE
- City
- — inherits STATE
ZIP-level market 32905
- Home prices YoY
- -1.8%
- Rents YoY
- -0.5%
- Active inventory
- 321
- Price-to-rent
- 9.3×
Monthly cashflow live
- Estimated rent
- $1,526 medium interval (Pro) →
- Mortgage (P&I)
- −$891
- Tax from tax record
- −$141 /mo · $1,687/yr
- Insurance
- −$71
- HOA
- −$0
- Vacancy / Maint / Mgmt
- −$320
- Net cashflow
- $103
Break-even live
UW: 25.0% down · 7.5% · 30yr · 1.5% tax · 5.0% vac · 8.0% maint · 8.0% mgmt
Financing live
Cash to close
- Down payment
- $42,500
- Closing costs
- $5,100
- Reserves months
- —
- Total cash needed
- —
Loan-product check · same deal, 3 products live
Conventional
25% down · 7.5% · 30yr
- Down + closing
- —
- Monthly P&I
- —
- Monthly cashflow
- —
- DSCR
- —
- Eligible?
- —
Personal DTI + credit; lowest rate.
DSCR
20% down · 8.5% · 30yr
- Down + closing
- —
- Monthly P&I
- —
- Monthly cashflow
- —
- DSCR
- —
- Eligible?
- —
No personal income docs; deal must DSCR.
Hard money
10% down · 12.0% · 12mo
- Down + closing
- —
- Monthly P&I
- —
- Monthly cashflow
- —
- DSCR
- —
- Eligible?
- —
Short-term bridge; refi at stabilization.
Rent comps 4 comps
| Address | Beds | Baths | Sqft | Rent | $/sqft | DOM | Units | Dist |
|---|---|---|---|---|---|---|---|---|
| 2522 Amberly Rd NE Palm Bay, FL | 2.0 | 1.0 | 672 | $1,300 | $1.93 | 23d | 1 | 0.06mi |
| 1700 Woodlake Dr NE Palm Bay, FL | 1.0–2.0 | 1.0–2.0 | 875 | $1,500 | $1.71 | 23d | 12 | 1.06mi |
| 1630 Bottlebrush Dr Palm Bay, FL | 2.0 | 1.0 | 600 | $1,495 | $2.49 | 23d | 1 | 1.20mi |
| 3016 Pinewood Dr NE Palm Bay, FL | 1.0–2.0 | 1.0 | 800 | $1,103 | $1.38 | 23d | 1 | 1.44mi |
Listing history 11 events
-
2026-06-18days on market $169,999 Active 16 DOM
-
2026-06-17days on market $169,999 Active 15 DOM
-
2026-06-16days on market $169,999 Active 14 DOM
-
2026-06-15days on market $169,999 Active 13 DOM
-
2026-06-14days on market $169,999 Active 11 DOM
-
2026-06-10days on market $169,999 Active 8 DOM
-
2026-06-08days on market $169,999 Active 6 DOM
-
2026-06-07days on market $169,999 Active 5 DOM
-
2026-06-05days on market $169,999 Active 2 DOM
-
2026-06-03remarks 699-char remark
-
2026-06-03$169,999 Active 1 DOM
ⓘ Source: listings_history table (triggers on properties + properties_extension) + one-shot
backfill from property_details.listing_events for pre-trigger history.
Tax reassessment forecast FL · Resets to sale price
- Current annual tax
- $1,687 · $141/mo
- Projected year-2 tax
- $1,687 · $141/mo
- Expected delta
- $0/yr ($0/mo · 0.0%)
ⓘ Screening estimate from a state-policy table — verify with the county assessor before closing.
Climate risk First Street
- Flood 1/10 Low FEMA zone X (unshaded) · 0% chance over 30 yrs
- Wildfire 1/10 Low
- Heat 10/10 Extreme 7 d/yr ≥105°F today · 22 d/yr by 30 yrs out
- Wind 10/10 Extreme 99% chance of damaging wind over 30 yrs
- Air quality 1/10 Low 0 unhealthy d/yr today · 0 by 30 yrs out
Nearby sold comps map
Loading sold comps map…
Walkable amenities ~0.75 mi
Loading nearby amenities…
Taxation est. · year 1
- Rental income
- $18,311
- − Mortgage interest
- −$9,523
- − Property taxes
- −$1,687
- − Insurance
- −$850
- − Repairs & maintenance
- −$1,465
- − Management
- −$1,465
- − Depreciation
- −$4,945
- Taxable loss
- −$1,624
- Est. tax savings @ 24.0%
- +$390
- After-tax cash flow
- $1,620/yr
For passive investors: Depreciation is non-cash, so a rental often shows a tax loss while cash-flowing — sheltering income. Rental losses are passive: they offset passive income freely, and up to $25,000/yr can offset ordinary (W-2) income if you actively participate and your MAGI is under $100k (phasing out to $0 by $150k); unused losses carry forward. On sale, claimed depreciation is recaptured at up to 25%, and gains may owe capital-gains tax (a 1031 exchange can defer both). Figures are a year-1 estimate at your 24.0% rate — not tax advice; consult a CPA.
Schools (NCES district)
- District
- Brevard
- NCES district ID
- 1200150
- Math proficiency
- 53% ▼ -9.00%
- Reading proficiency
- 57% ▼ -4.00%
- Median HH income
- $49,426
- Composite
- 46.86/100
- National rank
- #2370
- State rank
- #19 of 73 in FL
Livability — Palm Bay
- Score
- 72/100
- State rank
- #366
- US rank
- #6458
Category grades
Schools grade is shown separately in the Schools card above.
Census & demographics
- Census place
- Palm Bay, FL
- County
- Brevard County · 602,871 people
- City population
- 132,211
- Metro
- Palm Bay-Melbourne-Titusville, FL
- Population (ZIP)
- 24,792
- Household income
- $56,411
- Rent vs Own
- Severe rent burden
- 1962.0
Population outlook (Brevard County) Hauer SSP2
- Today (2025)
- 623,254 people
- By 2030
- 648,420 · +4.0%
- By 2040
- 690,009 · +10.7%
- By 2050
- 715,669 · +14.8%
- By 2075
- 775,744 · +24.5%
- By 2100
- 776,687 · +24.6%
Race, ethnicity, and origin ACS 2023
- Neighborhood character
- Diverse neighborhood (Simpson 0.57)
- Race & ethnicity
- White 61% Hispanic / Latino 16% Black 16% Two or more races 11% Asian 2%
- Hispanic origin (detail)
- Mexican 1% Puerto Rican 4% Cuban 4%
- Common ancestry
- Romanian 2% Hispanic 2% Slovak 2%
- Foreign-born
- 13% · Canada, Jamaica
- Languages at home
- 83% English-only · Spanish 12% French/Haitian/Cajun 2% Other Indo-European 2%
Political lean MEDSL · Brevard
- 2024 margin
- Strong R (+20.8) · D 39.1% · R 59.9% · Other 1.0%
- 2008→2024 swing
- -10.4pp toward R · 2008: -10.4pp · 2024: -20.8pp
- All cycles
- 2024: R+20.8 2020: R+16.4 2016: R+19.8 2012: R+12.7 2008: R+10.4
Not yet ingested
- Civics
- —
Market trends
- HPI YoY
- ▼ -5.59%
- Current HPI
- 309.8748
- Rent YoY
- ▼ -0.52%
- Metro
- Palm Bay-Melbourne-Titusville, FL
- State GDP YoY
- ▲ 3.28%
- F500 in state
- 36
Industry mix (Fortune 500 HQ in FL)
| Industry | F500 HQs | Revenue |
|---|---|---|
| Industrial Technology | 2 | $29B |
|
||
| Insurance | 2 | $17B |
|
||
| Retail | 1 | $60B |
|
||
| Technology Distribution | 1 | $58B |
|
||
| Homebuilding | 1 | $35B |
|
||
| Technology Manufacturing | 1 | $35B |
|
||
Price history
+1033.3% since first listed34 events — show timeline
- 2026-05-29 Listed $169,999 Beaches MLS
- 2026-05-17 Listing Removed — Beaches MLS
- 2026-05-04 Listed $169,900 RAIRCMLS
- 2026-03-28 Price Changed $169,900 Beaches MLS
- 2026-01-01 Listed $176,000 Beaches MLS
- 2025-12-24 Listing Removed — SCMLS
- 2025-11-04 Price Changed $176,999 SCMLS
- 2025-10-22 Price Changed $184,000 SCMLS
- 2025-06-24 Listing Removed — MARMLS
- 2025-06-24 Listed $189,000 SCMLS
- 2025-05-31 Listed $189,000 MARMLS
- 2025-05-14 Listing Removed — Beaches MLS
- 2025-05-01 Price Changed $184,000 Beaches MLS
- 2025-05-01 Price Changed $184,000 RAIRCMLS
- 2025-04-07 Price Changed $189,000 Beaches MLS
- 2025-04-06 Price Changed $189,000 RAIRCMLS
- 2025-02-27 Price Changed $195,000 Beaches MLS
- 2025-02-27 Price Changed $195,000 RAIRCMLS
- 2025-02-04 Listed $199,900 RAIRCMLS
- 2025-02-04 Listed $199,900 Beaches MLS
- 2024-07-26 Relisted — SCMLS
- 2024-07-26 Sold (MLS) $110,000 SCMLS
- 2024-07-08 Contingent — SCMLS
- 2024-06-21 Listed $119,900 SCMLS
- 2024-06-21 Listing Removed — SCMLS
- 2024-06-20 Relisted — SCMLS
- 2024-06-19 Listing Removed — SCMLS
- 2024-05-23 Relisted — SCMLS
- 2024-05-18 Contingent — SCMLS
- 2024-05-11 Price Changed $124,900 SCMLS
- 2024-04-30 Price Changed $134,900 SCMLS
- 2024-03-19 Listed $139,900 SCMLS
- 2012-04-05 Sold (Public Records) $24,000 Public Records
- 1982-11-01 Sold (Public Records) $15,000 Public Records
Property tax history
+13.4%/yrLatest (2025): $1,687 · +77.1% YoY. Source: county tax records.
Cash-flow waterfall
monthlySold comps — $/sqft
last 12 mo · ≤1 miLoading sold comps…