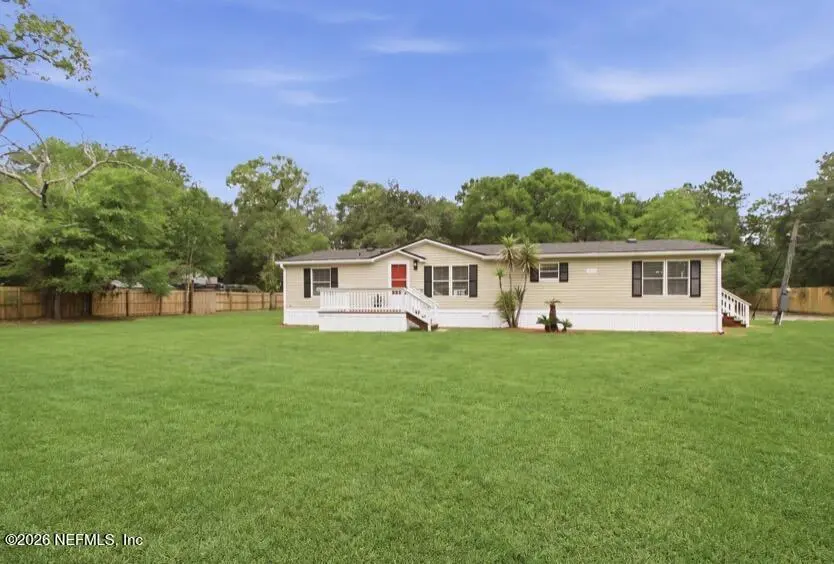
85279 Ashley Ave · Yulee, FL
Flood risk 1/10 · Minimal
- FEMA flood zone
- X (unshaded)
- Chance of flooding over 30 yrs
- 0.0%
- Est. flood insurance / yr
- $507 – $1,088
Fire risk 8/10 · Major
- Est. fire insurance / yr
- $947 – $1,759
Heat risk 9/10 · Severe
- Hot days now (above 106°F)
- 7 days/yr
- Hot days in 30 yrs
- 20 days/yr
Wind risk 9/10 · Severe
- Chance of severe wind over 30 yrs
- 99.0%
Air-quality risk 5/10 · Moderate
- Unhealthy air days now
- 6 days/yr
- Unhealthy air days in 30 yrs
- 7 days/yr
Risk factors via First Street. Map © Google.
Why this score? — see what drove the D+ grade
The composite is a weighted blend of 9 inputs, each scored 0–100. Each bar is that input's sub-score; the figure is the points it added to the 100-point composite (weight × sub-score).
- Cash flow +11.8/30.0
- Appreciation +10.0/10.0
- Schools +6.0/10.0
- DSCR +3.5/10.0
- 1% rule +3.4/10.0
- ARV discount +3.3/15.0
- Livability +3.3/5.0
- Rent growth +3.2/5.0
- Condition / age +2.5/5.0
$304,900
🖨 Deal sheet 📄 Offer letter ✓ Due diligence
Listing remarks
Check out this beautiful 3/2 mobile home on an acre lot in the desirable Wilson Neck area. Brand new AC, Roof, Skirting, Water Heater and all new Floors throughout. Big kitchen with stainless appliances and tons of cabinet space. Enjoy your time relaxing in front of the fireplace or on the oversized deck looking out at the gorgeous oak trees. Septic recently pumped and new well tank.
Key facts
- New floors
- New water heater
- New skirting
Tags
Property features AI
Finance
- HOA & community: Not a senior community
Exterior
- Parking: Additional parking available
- Utilities: Septic tank sewer; Electricity available
- Home design: Manufactured/mobile home; Used as single-family residential
- Exterior features: Other exterior features; 1 acre lot
Interior
- Kitchen: Dishwasher; Electric oven; Electric range; Refrigerator; ENERGY STAR qualified water heater
- Bedrooms: Three bedrooms (all on the main level)
- Bathrooms: Two full bathrooms
- Heating & cooling: Central heating; Central air conditioning
- Interior features: Seven total rooms
Neighborhood map
What this means for you Summary
Snapshot
- This is a 3-bed/2.0-bath manufactured listed at $305k.
Deal economics
- At list price, monthly cash flow is $-84 ($-1k/yr) — negative.
- To cash-flow at today's rent, offer at most $293k (4.0% below list).
- To meet the 1% rule (rent ≥ 1% of price), the offer needs to be $256k (16.0% below list).
- Recommended offer: $256k (16.0% below list) — sets the bar for 1% rule.
- Cap rate 6.0% vs local median 3.4% in Yulee — top-decile yield for the area; either an underpriced asset or a hidden risk that comps aren't pricing in. Stress-test before assuming the spread holds.
Location & tenants
- Location reads 66/100 on livability (#605 in FL) — a middle-class / working-renter tenant base. Strengths: housing A+, cost of living A-, crime B+; Watch: amenities F, commute F, health & safety F.
- Nassau (town): math 74% / reading 65% proficiency, ranked #4 of 73 in FL (top 6%) — acceptable for families but not a draw, mixed tenant base, ~2y average lease.
- Market conditions: Rents rising (+2.9%/yr); 596 active listings in the ZIP; 3 comparable units currently listed for rent nearby; rentals at typical pace (median 24d on market — plan ~3-4 weeks tenant-placement turnaround); solid renter incomes; 953 units permitted in Nassau County in 2024 (24 in 5+ unit buildings).
- This rent runs 33% of the median local income ($93k/yr) — at the standard rent-burdened threshold; future hikes will face affordability resistance.
Forward outlook
- In year one you build about $33k of equity ($2k loan paydown + $30k appreciation (10.0% local appreciation)).
- Nassau County population projected at +17% by 2050 — long-run rental-demand tailwind backs the buy-and-hold thesis.
- By year 2, paydown + projected appreciation supports a ~$52k cash-out refi (75% LTV) — recoverable capital for the next deal without selling this one.
Negotiation context
- Only 13 days on market — expect competitive offers; lowballing is unlikely to land.
- 3 sale attempts since 11y ago with the ask held roughly flat each time — persistent listings suggest the price (not the market) is what's stuck; bring a comps-based counter.
- Current owner paid $118k; list at $305k implies a 157% gain — meaningful room to come down on a strong offer.
Risks & watch-outs
- Climate carrying-cost: severe wind risk, 99% chance of damaging wind over 30y; severe wildfire risk; extreme-heat days projected 7→20/yr by 2055 (HVAC capex compounding) — expect insurance premiums to compound above CPI over the hold.
Questions for the listing agent
- What do current leases actually rent for vs. the listed asking? Can we see a recent rent roll and the last 12 months of T-12 income?
- Is there a deadline driving the sale (1031 exchange, divorce, estate, relocation)? That informs how much negotiation room exists.
- Schools are B-rated — typically a magnet for longer-tenancy family renters. What's the average tenant stay here, and is there a school-zone premium baked into asking?
- The area grade is low — what's the realistic commute time and amenity access for the typical tenant pool here? Any planned neighborhood developments (good or bad) we should know about?
- What's the average days-on-market for RENTAL listings here right now (not sales)? A rising rental-DOM trend means longer vacancies and softer asking-rent achievability than the comps imply.
- What's the recent tenant-quality profile in this submarket — average credit score on applications, eviction rate, late-payment / NSF rate, and stable-employment percentage? A property-management company in the area should have these aggregated.
- How much new for-sale + rental construction is in the pipeline within 1–3 miles? Heavy new supply typically softens prices + rents 12–24 months out; constrained supply supports both.
Investment metrics
- 1% rule
- 0.84% ✗
- Cap rate
- 5.96%
- Cash-on-cash
- -1.18%
- DSCR
- 0.95
- GRM
- 9.9
CMA / ARV
- ARV (on-the-fly)
- $278,640
- Comps found
- 10
Show comp detail 10 sales within ~0.75 mi
| Address | Dist | Beds/Ba | Sqft | Sold | Price | $/sf | Match |
|---|---|---|---|---|---|---|---|
| 85377 Theresa Rd | 0.21mi | 3/2.0 | 1,631 (+1%) | 17mo | $340,000 | $208 | 75 |
| 85110 Theresa Rd | 0.58mi | 3/2.0 | 1,670 (+3%) | 3mo | $131,000 | $78 | 66 |
| 85790 Radio Ave | 0.27mi | 4/2.0 (+1) | 1,512 (-7%) | 16mo | $243,000 | $161 | 57 |
| 85083 Condor Ln | 0.57mi | 3/2.0 | 1,440 (-11%) | 1mo | $275,000 | $191 | 54 |
| 85490 Alene Rd | 0.52mi | 3/2.0 | 1,404 (-13%) | 7mo | $285,000 | $203 | 47 |
| 85160 Miner Rd | 0.71mi | 3/2.0 | 1,550 (-4%) | 17mo | $309,000 | $199 | 46 |
| 85115 Miner Rd | 0.59mi | 3/2.0 | 1,792 (+11%) | 13mo | $299,900 | $167 | 44 |
| 85518 Duane Rd | 0.62mi | 3/2.0 | 1,800 (+11%) | 11mo | $310,000 | $172 | 43 |
| 85109 Hurricane Ln | 0.74mi | 3/2.0 | 1,714 (+6%) | 16mo | $271,000 | $158 | 42 |
| 85205 Winona Bayview Rd | 0.73mi | 3/2.0 | 1,424 (-12%) | 13mo | $230,000 | $162 | 35 |
Match score weights: distance 35% · size 25% · config 20% · recency 20%. Top-matched comps best support the ARV.
Projected returns pro-forma
10.0% appreciation · 2.88% rent growth · sell at horizon
- IRR
- 23.4%
- Equity multiple
- 2.88×
- Total profit
- $160,431
- Equity at exit
- $274,678
- IRR
- 20.8%
- Equity multiple
- 6.58×
- Total profit
- $476,107
- Equity at exit
- $592,354
Cash invested: $85,372 (down + closing). Projections, not guarantees.
Landlord ↔ Tenant lean methodology
- Overall (STATE)
- 87 Strongly Landlord-Friendly
- State Florida
- 87 Strongly Landlord-Friendly · R+3
- County
- — inherits STATE
- City
- — inherits STATE
ZIP-level market 32097
- Home prices YoY
- 19.5%
- Rents YoY
- 2.9%
- Active inventory
- 596
- Price-to-rent
- 9.9×
Monthly cashflow live
- Estimated rent
- $2,561 medium interval (Pro) →
- Mortgage (P&I)
- −$1,599
- Tax est. 1.5%
- −$381 /mo · $4,574/yr
- Insurance
- −$127
- HOA
- −$0
- Vacancy / Maint / Mgmt
- −$538
- Net cashflow
- $-84
Break-even live
UW: 25.0% down · 7.5% · 30yr · 1.5% tax · 5.0% vac · 8.0% maint · 8.0% mgmt
Financing live
Cash to close
- Down payment
- $76,225
- Closing costs
- $9,147
- Reserves months
- —
- Total cash needed
- —
Loan-product check · same deal, 3 products live
Conventional
25% down · 7.5% · 30yr
- Down + closing
- —
- Monthly P&I
- —
- Monthly cashflow
- —
- DSCR
- —
- Eligible?
- —
Personal DTI + credit; lowest rate.
DSCR
20% down · 8.5% · 30yr
- Down + closing
- —
- Monthly P&I
- —
- Monthly cashflow
- —
- DSCR
- —
- Eligible?
- —
No personal income docs; deal must DSCR.
Hard money
10% down · 12.0% · 12mo
- Down + closing
- —
- Monthly P&I
- —
- Monthly cashflow
- —
- DSCR
- —
- Eligible?
- —
Short-term bridge; refi at stabilization.
Rent comps 3 comps
| Address | Beds | Baths | Sqft | Rent | $/sqft | DOM | Units | Dist |
|---|---|---|---|---|---|---|---|---|
| 86467 Moonlit Walk Cir Yulee, FL | 4.0 | 3.0 | 2010 | $3,100 | $1.54 | 23d | 1 | 0.88mi |
| 86624 Mainline Rd Yulee, FL | 2.0 | 2.5 | 1168 | $1,695 | $1.45 | 23d | 1 | 1.46mi |
| 78295 Saddle Rock Rd Yulee, FL | 4.0 | 2.0 | 1846 | $2,191 | $1.19 | 23d | 1 | 1.47mi |
Listing history 11 events
-
2026-06-17status $304,900 Pending 13 DOM
-
2026-06-17days on market $304,900 Active 13 DOM
-
2026-06-16days on market $304,900 Active 12 DOM
-
2026-06-15days on market $304,900 Active 11 DOM
-
2026-06-13days on market $304,900 Active 9 DOM
-
2026-06-13days on market $304,900 Active 8 DOM
-
2026-06-09days on market $304,900 Active 5 DOM
-
2026-06-08days on market $304,900 Active 4 DOM
-
2026-06-07days on market $304,900 Active 3 DOM
-
2026-06-05remarks 386-char remark
-
2026-06-05$304,900 Active 1 DOM
ⓘ Source: listings_history table (triggers on properties + properties_extension) + one-shot
backfill from property_details.listing_events for pre-trigger history.
Climate risk First Street
- Flood 1/10 Low FEMA zone X (unshaded) · 0% chance over 30 yrs
- Wildfire 8/10 Severe
- Heat 9/10 Extreme 7 d/yr ≥106°F today · 20 d/yr by 30 yrs out
- Wind 9/10 Extreme 99% chance of damaging wind over 30 yrs
- Air quality 5/10 Major 6 unhealthy d/yr today · 7 by 30 yrs out
Nearby sold comps map
Loading sold comps map…
Walkable amenities ~0.75 mi
Loading nearby amenities…
Taxation est. · year 1
- Rental income
- $30,729
- − Mortgage interest
- −$17,079
- − Property taxes
- −$4,574
- − Insurance
- −$1,524
- − Repairs & maintenance
- −$2,458
- − Management
- −$2,458
- − Depreciation
- −$8,870
- Taxable loss
- −$6,234
- Est. tax savings @ 24.0%
- +$1,496
- After-tax cash flow
- $487/yr
For passive investors: Depreciation is non-cash, so a rental often shows a tax loss while cash-flowing — sheltering income. Rental losses are passive: they offset passive income freely, and up to $25,000/yr can offset ordinary (W-2) income if you actively participate and your MAGI is under $100k (phasing out to $0 by $150k); unused losses carry forward. On sale, claimed depreciation is recaptured at up to 25%, and gains may owe capital-gains tax (a 1031 exchange can defer both). Figures are a year-1 estimate at your 24.0% rate — not tax advice; consult a CPA.
Schools (NCES district)
- District
- Nassau
- NCES district ID
- 1201350
- Math proficiency
- 74% ▼ -2.00%
- Reading proficiency
- 65% ▼ -2.00%
- Median HH income
- $58,267
- Composite
- 59.79/100
- National rank
- #899
- State rank
- #4 of 73 in FL
Livability — Yulee
- Score
- 66/100
- State rank
- #605
- US rank
- #11615
Category grades
Schools grade is shown separately in the Schools card above.
Census & demographics
- Census place
- Yulee, FL
- County
- Nassau County · 67,729 people
- City population
- 26,700
- Metro
- Jacksonville, FL
- Population (ZIP)
- 26,700
- Household income
- $93,161
- Rent vs Own
- Severe rent burden
- 404.0
Population outlook (Nassau County) Hauer SSP2
- Today (2025)
- 88,419 people
- By 2030
- 92,679 · +4.8%
- By 2040
- 99,257 · +12.3%
- By 2050
- 103,378 · +16.9%
- By 2075
- 109,726 · +24.1%
- By 2100
- 107,006 · +21.0%
Race, ethnicity, and origin ACS 2023
- Neighborhood character
- Predominantly White (75%)
- Race & ethnicity
- White 75% Two or more races 9% Black 9% Hispanic / Latino 8% Asian 1% Native American 1%
- Hispanic origin (detail)
- Mexican 2% Puerto Rican 2%
- Common ancestry
- Lithuanian 4% Italian 3% Romanian 2%
- Foreign-born
- 4% · Canada, Vietnam
- Languages at home
- 93% English-only · Spanish 5% Vietnamese 1%
Political lean MEDSL · Nassau
- 2024 margin
- Solid R (+46.9) · D 26.1% · R 73.1%
- 2008→2024 swing
- -3.1pp toward R · 2008: -43.8pp · 2024: -46.9pp
- All cycles
- 2024: R+46.9 2020: R+45.9 2016: R+50.2 2012: R+48.6 2008: R+43.8
Not yet ingested
- Civics
- —
Market trends
- HPI YoY
- ▲ 49.35%
- Current HPI
- 301.9299
- Rent YoY
- ▲ 2.88%
- Metro
- Jacksonville, FL
- State GDP YoY
- ▲ 3.28%
- F500 in state
- 36
Industry mix (Fortune 500 HQ in FL)
| Industry | F500 HQs | Revenue |
|---|---|---|
| Industrial Technology | 2 | $29B |
|
||
| Insurance | 2 | $17B |
|
||
| Retail | 1 | $60B |
|
||
| Technology Distribution | 1 | $58B |
|
||
| Homebuilding | 1 | $35B |
|
||
| Technology Manufacturing | 1 | $35B |
|
||
Price history
+1932.7% since first listed5 events — show timeline
- 2026-06-04 Listed $304,900 realMLS
- 2016-01-03 Listed $110,000 AINCAR
- 2015-04-29 Listed $110,000 AINCAR
- 2005-09-07 Sold (Public Records) $118,500 Public Records
- 1990-03-23 Sold (Public Records) $15,000 Public Records
Property tax history
+3.0%/yrLatest (2021): $554 · +1.8% YoY. Source: county tax records.
Cash-flow waterfall
monthlySold comps — $/sqft
last 12 mo · ≤1 miLoading sold comps…