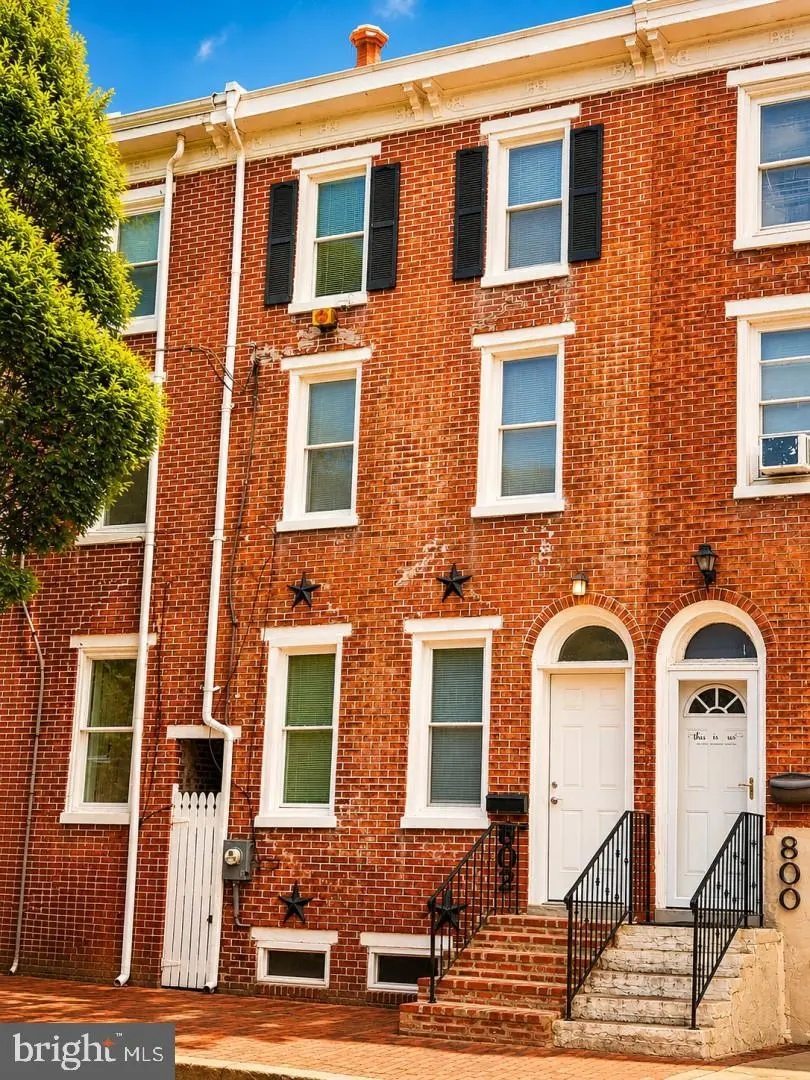
802 N Madison St · Wilmington, DE
Flood risk 1/10 · Minimal
- FEMA flood zone
- X (unshaded)
- Chance of flooding over 30 yrs
- 0.0%
- Est. flood insurance / yr
- $473 – $860
Fire risk 1/10 · Minimal
- Est. fire insurance / yr
- $476 – $884
Heat risk 8/10 · Major
- Hot days now (above 103°F)
- 7 days/yr
- Hot days in 30 yrs
- 16 days/yr
Wind risk 6/10 · Moderate
- Chance of severe wind over 30 yrs
- 27.0%
Air-quality risk 3/10 · Minor
- Unhealthy air days now
- 3 days/yr
- Unhealthy air days in 30 yrs
- 4 days/yr
Risk factors via First Street. Map © Google.
Why this score? — see what drove the D grade
The composite is a weighted blend of 9 inputs, each scored 0–100. Each bar is that input's sub-score; the figure is the points it added to the 100-point composite (weight × sub-score).
- Cash flow +19.6/30.0
- DSCR +6.2/10.0
- 1% rule +3.9/10.0
- ARV discount +3.4/15.0
- Livability +3.2/5.0
- Rent growth +2.9/5.0
- Schools +2.5/10.0
- Condition / age +2.5/5.0
- Appreciation +0.0/10.0
$259,900
🖨 Deal sheet (PDF) 📄 Offer letter ✓ Due diligence
Listing remarks MLS
Lots of home for the money. This 4-5 bedroom, 2 bath brick row is available for immediate occupancy. Located in downtown Wilmington, within walking distance to business district and bus route. Home features full wall of shelving in living room, main floor laundry, basement entrance from outside only. All cash offers must have proof of funds and all financing offer must have pre-approval. Home is being sold as-is with no warranties expressed or implied. Bank addendums required with accepted offer.
Key facts
- Three story layout
- Rooftop access
- Updated kitchen
Tags
Property features AI
Finance
- Other: Estimated finished below-grade area; Accessibility features including 32+ inch wide doors, lever-handle doors, and multiple access exits
Exterior
- Parking: Asphalt driveway; One off-street parking space; Lighted parking
- Utilities: Public water; Public sewer; Electric service with circuit breakers; Natural gas hot water
- Home design: Interior townhouse/rowhouse; Brick/brick-front construction; Fee simple ownership
- Construction: Stone foundation; Above-grade and below-grade living areas
- Exterior features: Wood fencing; Level entry at main; Walkout-level basement; Rear entrance to basement
Interior
- Kitchen: Microwave; Stove; Refrigerator; Upgraded countertops; Eat-in kitchen
- Bedrooms: Three bedrooms on the upper level
- Flooring: Carpet; Ceramic tile; Wood floors
- Bathrooms: Two full bathrooms
- Heating & cooling: 90% efficient forced-air heating (natural gas); Ceiling fans
- Interior features: Additional stairway; Tub/shower combo; Combination kitchen and dining area; Eat-in kitchen; Recessed lighting; Upgraded countertops; Window treatments; Wood floors
- Laundry & utility: Main-floor laundry with ENERGY STAR clothes washer; Gas dryer
Neighborhood map
What this means for you Summary
Snapshot
- This is a 5-bed/2.0-bath townhouse listed at $260k.
Deal economics
- At list price, monthly cash flow is $300 ($4k/yr) — positive.
- The deal already cash-flows at list — no discount required.
- To meet the 1% rule (rent ≥ 1% of price), the offer needs to be $232k (10.9% below list).
- Recommended offer: $232k (10.9% below list) — sets the bar for 1% rule.
- Cap rate 7.7% vs local median 5.7% in Wilmington — top-decile yield for the area; either an underpriced asset or a hidden risk that comps aren't pricing in. Stress-test before assuming the spread holds.
Location & tenants
- Location reads 64/100 on livability (#52 in DE) — a middle-class / working-renter tenant base. Strengths: cost of living A+, housing A; Watch: employment D+, commute D, crime F.
- Christina School District (suburban): math 22% / reading 33% proficiency, ranked #18 of 26 in DE (top 69%) — low school quality limits family demand, transient renter base, plan for 1-2y turnover.
- Zoned schools: Stubbs Early Education Center (190 students, 0% FRL); Shue-Medill Middle School (math 21% / reading 30%, grade F, #21 of 36 statewide, top 57%, 808 students, 0% FRL); Christiana High School (math 49% / reading 66%, grade C, #3 of 40 statewide, top 5%, 1,256 students, 0% FRL) — zoned schools average 0% FRL vs 50% district-wide (50 pts lower); this property's tenant base skews higher-income than the district average.
- Zoned-school proficiency averages 42% at this address vs 28% district-wide (+14 pts) — the actual schools serving this property are materially stronger than the Christina School District average implies; a family-tenant draw the district grade alone would hide.
- Market conditions: Rents rising (+1.6%/yr); 75 active listings in the ZIP; 6 comparable units currently listed for rent nearby; rentals lingering (median 46d on market — plan ~5-8 weeks vacancy on turnover, expect pricing pressure); 50% of comp listings sitting > 30 days — soft ceiling on asking rent; 1,367 units permitted in New Castle County in 2024 (201 in 5+ unit buildings).
Forward outlook
- Local home prices are declining (-3.0%/yr); year-one equity from $2k of loan paydown is wiped out by about $8k of value loss. Plan a longer hold.
- New Castle County population projected at +9% by 2050 — modest demand growth; plan on rents tracking national, not racing it.
Negotiation context
- It's been on market 40 days — a 3% lower offer ($252k) is reasonable based on typical stale-listing flexibility.
- 4 sale attempts since 23y ago with the ask held roughly flat each time — persistent listings suggest the price (not the market) is what's stuck; bring a comps-based counter.
- Current owner paid $29k; list at $260k implies a 796% gain — meaningful room to come down on a strong offer.
Risks & watch-outs
- Watch-outs: built in 1900 — expect roof / HVAC / electrical / plumbing capex.
- Climate carrying-cost: major wind risk, 27% chance of damaging wind over 30y; extreme-heat days projected 7→16/yr by 2055 (HVAC capex compounding) — expect insurance premiums to compound above CPI over the hold.
Questions for the listing agent
- It's been on market 40 days. Have you received any prior offers? Is the seller open to a 11% concession, seller financing, or rate buy-down credit?
- Built in 1900 — when were the roof, HVAC, electrical panel, plumbing, and water heater last replaced?
- Is there a deadline driving the sale (1031 exchange, divorce, estate, relocation)? That informs how much negotiation room exists.
- Schools are D-rated, which usually means shorter tenancies and higher turnover. Who's the typical renter profile here, and what's been the actual vacancy rate?
- Crime grade is F in this area — have there been break-ins, vandalism, or insurance claims at this property in the last 3 years? What carrier currently insures it and at what premium?
- The area grade is low — what's the realistic commute time and amenity access for the typical tenant pool here? Any planned neighborhood developments (good or bad) we should know about?
- What's the average days-on-market for RENTAL listings here right now (not sales)? A rising rental-DOM trend means longer vacancies and softer asking-rent achievability than the comps imply.
- What's the recent tenant-quality profile in this submarket — average credit score on applications, eviction rate, late-payment / NSF rate, and stable-employment percentage? A property-management company in the area should have these aggregated.
- How much new for-sale + rental construction is in the pipeline within 1–3 miles? Heavy new supply typically softens prices + rents 12–24 months out; constrained supply supports both.
Investment metrics
- 1% rule
- 0.89% ✗
- Cap rate
- 7.68%
- Cash-on-cash
- 4.95%
- DSCR
- 1.22
- GRM
- 9.4
CMA / ARV
- ARV (median comp)
- $238,295
- List price
- $259,900
- Delta
- 9.07%
- Verdict
- FAIR
- Comps
- 20 within 1.0 mi
Show comp detail 12 sales within ~0.75 mi
| Address | Dist | Beds/Ba | Sqft | Sold | Price | $/sf | Match |
|---|---|---|---|---|---|---|---|
| 823 W 7th St | 0.14mi | 5/1.5 | 1,825 (0%) | 2mo | $150,000 | $82 | 90 |
| 837 N Madison St | 0.05mi | 4/1.5 (-1) | 1,775 (-3%) | 0mo | $315,000 | $177 | 86 |
| 1011 W 5th St | 0.30mi | 4/2.0 (-1) | 1,725 (-6%) | 0mo | $240,000 | $139 | 71 |
| 602 N Harrison St | 0.34mi | 4/2.0 (-1) | 1,750 (-4%) | 5mo | $140,000 | $80 | 68 |
| 1407 W 6th St | 0.56mi | 5/1.0 | 1,800 (-1%) | 1mo | $233,000 | $129 | 67 |
| 1409 W 3rd St | 0.61mi | 4/1.0 (-1) | 1,825 (0%) | 7mo | $125,000 | $68 | 56 |
| 209 N Jackson St | 0.41mi | 4/2.0 (-1) | 1,650 (-10%) | 8mo | $135,000 | $82 | 53 |
| 328 Compton Ct | 0.56mi | 4/1.5 (-1) | 2,031 (+11%) | 7mo | $230,000 | $113 | 42 |
| 516 E 9th St | 0.71mi | 4/2.0 (-1) | 1,625 (-11%) | 2mo | $184,000 | $113 | 42 |
| 130 N Connell St | 0.58mi | 4/1.5 (-1) | 1,575 (-14%) | 4mo | $135,090 | $86 | 40 |
| 1003 Sycamore St | 0.73mi | 4/2.0 (-1) | 1,575 (-14%) | 8mo | $250,000 | $159 | 31 |
| 1604 W 4th St | 0.71mi | 4/3.5 (-1) | 1,575 (-14%) | 7mo | $237,000 | $150 | 27 |
Match score weights: distance 35% · size 25% · config 20% · recency 20%. Top-matched comps best support the ARV.
Projected returns pro-forma
-3.0% appreciation · 1.59% rent growth · sell at horizon
- IRR
- -10.1%
- Equity multiple
- 0.64×
- Total profit
- $-26,375
- Equity at exit
- $38,752
- IRR
- -2.6%
- Equity multiple
- 0.84×
- Total profit
- $-11,808
- Equity at exit
- $22,471
Cash invested: $72,772 (down + closing). Projections, not guarantees.
Landlord ↔ Tenant lean methodology
- Overall (STATE)
- 70 Landlord-Friendly
- State Delaware
- 70 Landlord-Friendly · D+7
- County
- — inherits STATE
- City
- — inherits STATE
ZIP-level market 19801
- Rents YoY
- 1.6%
- Active inventory
- 75
- Price-to-rent
- 9.4×
Monthly cashflow live
- Estimated rent
- $2,316 high interval (Pro) →
- Mortgage (P&I)
- −$1,363
- Tax from tax record
- −$58 /mo · $700/yr
- Insurance
- −$108
- HOA
- −$0
- Vacancy / Maint / Mgmt
- −$486
- Net cashflow
- $300
Break-even live
Sensitivity live
| Price | -10% $447 | -5% $374 | +0% $300 | +5% $226 | +10% $153 |
|---|---|---|---|---|---|
| Rent | -10% $117 | -5% $209 | +0% $300 | +5% $392 | +10% $483 |
| Rate | -1.0pp $431 | -0.5pp $366 | base $300 | +0.5pp $233 | +1.0pp $164 |
UW: 25.0% down · 7.5% · 30yr · 1.5% tax · 5.0% vac · 8.0% maint · 8.0% mgmt
Financing live
Cash to close
- Down payment
- $64,975
- Closing costs
- $7,797
- Reserves months
- —
- Total cash needed
- —
Loan-product check · same deal, 3 products live
Conventional
25% down · 7.5% · 30yr
- Down + closing
- —
- Monthly P&I
- —
- Monthly cashflow
- —
- DSCR
- —
- Eligible?
- —
Personal DTI + credit; lowest rate.
DSCR
20% down · 8.5% · 30yr
- Down + closing
- —
- Monthly P&I
- —
- Monthly cashflow
- —
- DSCR
- —
- Eligible?
- —
No personal income docs; deal must DSCR.
Hard money
10% down · 12.0% · 12mo
- Down + closing
- —
- Monthly P&I
- —
- Monthly cashflow
- —
- DSCR
- —
- Eligible?
- —
Short-term bridge; refi at stabilization.
Rent comps 6 comps
| Address | Beds | Baths | Sqft | Rent | $/sqft | DOM | Units | Dist |
|---|---|---|---|---|---|---|---|---|
| 1029 Lancaster Ave Wilmington, DE | 4.0 | 1.5 | 1375 | $1,900 | $1.38 | 26d | 1 | 0.50mi |
| 1913 W 2nd St Unit 1913 Wilmington, DE | 5.0 | 1.5 | 1675 | $2,050 | $1.22 | 45d | 1 | 0.98mi |
| 125 W 23rd St Wilmington, DE | 4.0 | 2.0 | 1672 | $1,995 | $1.19 | 45d | 1 | 1.02mi |
| 2401 N West St Wilmington, DE | 4.0 | 1.0 | 1650 | $1,900 | $1.15 | 17d | 1 | 1.08mi |
| 2518 N Tatnall St Wilmington, DE | 4.0 | 1.5 | 1575 | $1,995 | $1.27 | 45d | 1 | 1.16mi |
| 1601 E Latimer Pl Wilmington, DE | 4.0 | 1.0 | 1450 | $2,195 | $1.51 | 20d | 1 | 1.27mi |
Listing history 26 events
-
2026-06-21days on market $259,900 Active 40 DOM
-
2026-06-18days on market $259,900 Active 37 DOM
-
2026-06-17days on market $259,900 Active 36 DOM
-
2026-06-16days on market $259,900 Active 35 DOM
-
2026-06-15days on market $259,900 Active 34 DOM
-
2026-06-13days on market $259,900 Active 32 DOM
-
2026-06-13days on market $259,900 Active 31 DOM
-
2026-06-09days on market $259,900 Active 28 DOM
-
2026-06-08days on market $259,900 Active 27 DOM
-
2026-06-07days on market $259,900 Active 26 DOM
-
2026-06-04days on market $259,900 Active 23 DOM
-
2026-06-03days on market $259,900 Active 22 DOM
-
2026-06-02days on market $259,900 Active 21 DOM
-
2026-06-02price $259,900 Active 20 DOM
-
2026-06-01days on market $265,000 Active 20 DOM
-
2026-05-31days on market $265,000 Active 19 DOM
-
2026-05-12$265,000 Active 1398-char remark
-
2012-03-29soldstatus $29,000 501-char remark
Show marketing remark (501 chars)
Lots of home for the money. This 4-5 bedroom, 2 bath brick row is available for immediate occupancy. Located in downtown Wilmington, within walking distance to business district and bus route. Home features full wall of shelving in living room, main floor laundry, basement entrance from outside only. All cash offers must have proof of funds and all financing offer must have pre-approval. Home is being sold as-is with no warranties expressed or implied. Bank addendums required with accepted offer.
-
2012-03-29soldstatus $29,000
Show marketing remark (501 chars)
Lots of home for the money. This 4-5 bedroom, 2 bath brick row is available for immediate occupancy. Located in downtown Wilmington, within walking distance to business district and bus route. Home features full wall of shelving in living room, main floor laundry, basement entrance from outside only. All cash offers must have proof of funds and all financing offer must have pre-approval. Home is being sold as-is with no warranties expressed or implied. Bank addendums required with accepted offer.
-
2012-03-05historical
Show marketing remark (501 chars)
Lots of home for the money. This 4-5 bedroom, 2 bath brick row is available for immediate occupancy. Located in downtown Wilmington, within walking distance to business district and bus route. Home features full wall of shelving in living room, main floor laundry, basement entrance from outside only. All cash offers must have proof of funds and all financing offer must have pre-approval. Home is being sold as-is with no warranties expressed or implied. Bank addendums required with accepted offer.
-
2012-01-11$28,400 501-char remark
Show marketing remark (501 chars)
Lots of home for the money. This 4-5 bedroom, 2 bath brick row is available for immediate occupancy. Located in downtown Wilmington, within walking distance to business district and bus route. Home features full wall of shelving in living room, main floor laundry, basement entrance from outside only. All cash offers must have proof of funds and all financing offer must have pre-approval. Home is being sold as-is with no warranties expressed or implied. Bank addendums required with accepted offer.
-
2012-01-11$28,400
Show marketing remark (501 chars)
Lots of home for the money. This 4-5 bedroom, 2 bath brick row is available for immediate occupancy. Located in downtown Wilmington, within walking distance to business district and bus route. Home features full wall of shelving in living room, main floor laundry, basement entrance from outside only. All cash offers must have proof of funds and all financing offer must have pre-approval. Home is being sold as-is with no warranties expressed or implied. Bank addendums required with accepted offer.
-
2004-02-06soldstatus $63,000
-
2004-01-30soldstatus $63,000
-
2003-01-31$63,000
-
1979-12-01soldstatus $51,750
ⓘ Source: listings_history table (triggers on properties + properties_extension) + one-shot
backfill from property_details.listing_events for pre-trigger history.
Tax reassessment forecast DE · Partial reset (capped growth)
- Current annual tax
- $700 · $58/mo
- Projected year-2 tax
- $1,104 · $92/mo
- Expected delta
- +$404/yr (+$34/mo · 57.6%)
ⓘ Screening estimate from a state-policy table — verify with the county assessor before closing.
Climate risk First Street
- Flood 1/10 Low FEMA zone X (unshaded) · 0% chance over 30 yrs
- Wildfire 1/10 Low
- Heat 8/10 Severe 7 d/yr ≥103°F today · 16 d/yr by 30 yrs out
- Wind 6/10 Major 27% chance of damaging wind over 30 yrs
- Air quality 3/10 Moderate 3 unhealthy d/yr today · 4 by 30 yrs out
Nearby sold comps map
Loading sold comps map…
Walkable amenities ~0.75 mi
Loading nearby amenities…
Taxation est. · year 1
- Rental income
- $27,792
- − Mortgage interest
- −$14,558
- − Property taxes
- −$700
- − Insurance
- −$1,300
- − Repairs & maintenance
- −$2,223
- − Management
- −$2,223
- − Depreciation
- −$7,561
- Taxable loss
- −$774
- Est. tax savings @ 24.0%
- +$186
- After-tax cash flow
- $3,786/yr
For passive investors: Depreciation is non-cash, so a rental often shows a tax loss while cash-flowing — sheltering income. Rental losses are passive: they offset passive income freely, and up to $25,000/yr can offset ordinary (W-2) income if you actively participate and your MAGI is under $100k (phasing out to $0 by $150k); unused losses carry forward. On sale, claimed depreciation is recaptured at up to 25%, and gains may owe capital-gains tax (a 1031 exchange can defer both). Figures are a year-1 estimate at your 24.0% rate — not tax advice; consult a CPA.
Schools (NCES district)
- District
- Christina School District
- NCES district ID
- 1000200
- Math proficiency
- 22% ▼ -12.00%
- Reading proficiency
- 33% ▼ -5.00%
- Median HH income
- $58,838
- Composite
- 24.93/100
- National rank
- #7567
- State rank
- #18 of 26 in DE
Livability — Wilmington
- Score
- 64/100
- State rank
- #52
- US rank
- #14251
Category grades
Schools grade is shown separately in the Schools card above.
Census & demographics
- Census place
- Wilmington, DE
- County
- New Castle County · 483,412 people
- City population
- 173,480
- Metro
- Philadelphia-Camden-Wilmington, PA-NJ-DE-MD
- Population (ZIP)
- 16,327
- Household income
- $52,810
- Rent vs Own
- Severe rent burden
- 919.0
Population outlook (New Castle County) Hauer SSP2
- Today (2025)
- 594,686 people
- By 2030
- 609,164 · +2.4%
- By 2040
- 632,154 · +6.3%
- By 2050
- 649,068 · +9.1%
- By 2075
- 687,771 · +15.7%
- By 2100
- 694,961 · +16.9%
Race, ethnicity, and origin ACS 2023
- Neighborhood character
- Predominantly Black (67%)
- Race & ethnicity
- Black 67% White 15% Hispanic / Latino 9% Two or more races 7% Asian 4%
- Hispanic origin (detail)
- Mexican 3% Puerto Rican 4%
- Common ancestry
- Romanian 1% Slovak 1% Italian 1%
- Foreign-born
- 9% · Canada, China, Vietnam
- Languages at home
- 87% English-only · Spanish 7% Other Indo-European 2% Chinese 1%
Political lean MEDSL · New Castle
- 2024 margin
- Solid D (+32.6) · D 65.5% · R 32.9% · Other 1.6%
- 2008→2024 swing
- -8.1pp toward R · 2008: 40.6pp · 2024: 32.6pp
- All cycles
- 2024: D+32.6 2020: D+37.1 2016: D+29.6 2012: D+34.1 2008: D+40.6
Not yet ingested
- Civics
- —
Market trends
- HPI YoY
- ▼ -112.65%
- Current HPI
- 151.1288
- Rent YoY
- ▲ 1.59%
- Metro
- Philadelphia-Camden-Wilmington, PA-NJ-DE-MD
- State GDP YoY
- —
- F500 in state
- 0
Price history
+402.2% since first listed11 events — show timeline
- 2026-06-01 Price Changed $259,900 BRIGHT MLS
- 2026-05-12 Listed $265,000 BRIGHT MLS
- 2012-03-29 Sold (MLS) $29,000 TREND
- 2012-03-29 Sold (MLS) $29,000 BRIGHT MLS
- 2012-03-05 Listing Removed — BRIGHT MLS
- 2012-01-11 Listed $28,400 TREND
- 2012-01-11 Listed $28,400 BRIGHT MLS
- 2004-02-06 Sold (Public Records) $63,000 Public Records
- 2004-01-30 Sold (MLS) $63,000 BRIGHT MLS
- 2003-01-31 Listed $63,000 BRIGHT MLS
- 1979-12-01 Sold (Public Records) $51,750 Public Records
Property tax history
+3.9%/yrLatest (2024): $700 · +2.6% YoY. Source: county tax records.
Cash-flow waterfall
monthlySold comps — $/sqft
last 12 mo · ≤1 miLoading sold comps…