7103 Donnell Pl Unit D · Forestville, MD
Flood risk 1/10 · Minimal
- FEMA flood zone
- X (unshaded)
- Chance of flooding over 30 yrs
- 0.0%
- Est. flood insurance / yr
- $507 – $1,088
Fire risk 1/10 · Minimal
- Est. fire insurance / yr
- $755 – $1,403
Heat risk 8/10 · Major
- Hot days now (above 103°F)
- 7 days/yr
- Hot days in 30 yrs
- 16 days/yr
Wind risk 4/10 · Minor
- Chance of severe wind over 30 yrs
- 21.0%
Air-quality risk 3/10 · Minor
- Unhealthy air days now
- 2 days/yr
- Unhealthy air days in 30 yrs
- 3 days/yr
Risk factors via First Street. Map © Google.
Why this score? — see what drove the C grade
The composite is a weighted blend of 9 inputs, each scored 0–100. Each bar is that input's sub-score; the figure is the points it added to the 100-point composite (weight × sub-score).
- Cash flow +21.6/30.0
- 1% rule +10.0/10.0
- ARV discount +7.5/15.0
- DSCR +6.9/10.0
- Livability +3.4/5.0
- Rent growth +3.0/5.0
- Condition / age +2.5/5.0
- Schools +1.7/10.0
- Appreciation +0.0/10.0
$100,000
🖨 Deal sheet 📄 Offer letter ✓ Due diligence
Listing remarks MLS
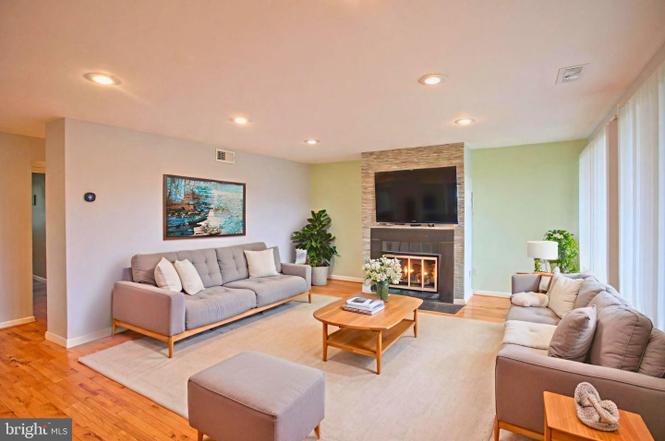
This unit has been remodeled and is ready to move-into. All new hardwood floors, new carpet in bedrooms, new kitchen with stainless steel appliances, ceramic tile flooring, tiled back splash and balcony.
Key facts
- $500 HOA
- Community pool
- Built 1964
Neighborhood map
What this means for you Summary
Snapshot
- This is a 2-bed/1.0-bath condo listed at $100k.
Deal economics
- At list price, monthly cash flow is $151 ($2k/yr) — positive.
- The deal already cash-flows at list — no discount required.
- Meets the 1% rule at list price ($2k rent vs $100k).
- Recommended offer: $88k (12.0% below list) — sets the bar for market timing.
- Cap rate 8.1% vs local median 4.1% in Forestville — top-decile yield for the area; either an underpriced asset or a hidden risk that comps aren't pricing in. Stress-test before assuming the spread holds.
Location & tenants
- Location reads 67/100 on livability (#215 in MD) — a middle-class / working-renter tenant base. Strengths: housing A+, employment B+; Watch: health & safety C-, crime D-, amenities F.
- Prince George'S County Public Schools (suburban): math 8% / reading 24% proficiency, ranked #21 of 24 in MD (top 88%) — low school quality limits family demand, transient renter base, plan for 1-2y turnover.
- Zoned schools: Andrew Jackson Academy (math 2% / reading 13%, grade F, #681 of 860 statewide, top 81%, 407 students, 69% FRL); Drew Freeman Middle (math 2% / reading 12%, grade F, #219 of 225 statewide, top 98%, 833 students, 67% FRL).
- Market conditions: Rents rising (+2.0%/yr); 114 active listings in the ZIP; 24 comparable units currently listed for rent nearby; rentals at typical pace (median 25d on market — plan ~3-4 weeks tenant-placement turnaround); 46% of comp listings sitting > 30 days — soft ceiling on asking rent; solid renter incomes; 1,481 units permitted in Prince George's County in 2024 (0 in 5+ unit buildings).
Forward outlook
- Local home prices are declining (-3.0%/yr); year-one equity from $691 of loan paydown is wiped out by about $3k of value loss. Plan a longer hold.
- Prince George's County population projected at +18% by 2050 — long-run rental-demand tailwind backs the buy-and-hold thesis.
Negotiation context
- It's been on market 183 days — a 12% lower offer ($88k) is reasonable based on typical stale-listing flexibility.
- 9 sale attempts since 13y ago; this cycle's ask has dropped $40k (29%) from the opening price — seller is motivated, your offer sets the floor, not the list.
- Current owner paid $60k; list at $100k implies a 66% gain — meaningful room to come down on a strong offer.
Risks & watch-outs
- Watch-outs: HOA is 29% of rent.
- Climate carrying-cost: extreme-heat days projected 7→16/yr by 2055 (HVAC capex compounding) — expect insurance premiums to compound above CPI over the hold.
Questions for the listing agent
- It's been on market 183 days. Have you received any prior offers? Is the seller open to a 12% concession, seller financing, or rate buy-down credit?
- Built in 1964 — when were the roof, HVAC, electrical panel, plumbing, and water heater last replaced?
- What does the HOA fee cover, when was the last increase, and are there any pending special assessments or reserve-fund shortfalls?
- Any open or pending special assessments — roof, HVAC, plumbing, elevator, façade? What's the per-unit balance and payoff schedule, and is the seller paying it off at close or rolling it to the buyer?
- Why hasn't it sold? Are there any deal-killer items the seller is aware of (foundation, flood, title, zoning, code violations)?
- Is there a deadline driving the sale (1031 exchange, divorce, estate, relocation)? That informs how much negotiation room exists.
- Schools are F-rated, which usually means shorter tenancies and higher turnover. Who's the typical renter profile here, and what's been the actual vacancy rate?
- Crime grade is D in this area — have there been break-ins, vandalism, or insurance claims at this property in the last 3 years? What carrier currently insures it and at what premium?
- What's the average days-on-market for RENTAL listings here right now (not sales)? A rising rental-DOM trend means longer vacancies and softer asking-rent achievability than the comps imply.
- What's the recent tenant-quality profile in this submarket — average credit score on applications, eviction rate, late-payment / NSF rate, and stable-employment percentage? A property-management company in the area should have these aggregated.
- How much new apartment / multifamily construction is in the pipeline within 1–3 miles? Heavy new supply (>2% of stock underway) typically softens rents 12–24 months out; light construction supports rent growth.
Investment metrics
- 1% rule
- 1.70% ✓
- Cap rate
- 8.11%
- Cash-on-cash
- 6.49%
- DSCR
- 1.29
- GRM
- 4.9
CMA / ARV
No comps found within radius.
Projected returns pro-forma
-3.0% appreciation · 2.0% rent growth · sell at horizon
- IRR
- -7.8%
- Equity multiple
- 0.72×
- Total profit
- $-7,926
- Equity at exit
- $14,910
- IRR
- 0.0%
- Equity multiple
- 1.00×
- Total profit
- $54
- Equity at exit
- $8,646
Cash invested: $28,000 (down + closing). Projections, not guarantees.
Landlord ↔ Tenant lean methodology
- Overall (STATE)
- 27 Tenant-Leaning
- State Maryland
- 27 Tenant-Leaning · D+14
- County
- — inherits STATE
- City
- — inherits STATE
ZIP-level market 20747
- Home prices YoY
- -19.0%
- Rents YoY
- 2.0%
- Active inventory
- 114
- Price-to-rent
- 4.9×
Monthly cashflow live
- Estimated rent
- $1,699 high interval (Pro) →
- Mortgage (P&I)
- −$524
- Tax est. 1.5%
- −$125 /mo · $1,500/yr
- Insurance
- −$42
- HOA
- −$500
- Vacancy / Maint / Mgmt
- −$357
- Net cashflow
- $151
Break-even live
UW: 25.0% down · 7.5% · 30yr · 1.5% tax · 5.0% vac · 8.0% maint · 8.0% mgmt
Financing live
Cash to close
- Down payment
- $25,000
- Closing costs
- $3,000
- Reserves months
- —
- Total cash needed
- —
Loan-product check · same deal, 3 products live
Conventional
25% down · 7.5% · 30yr
- Down + closing
- —
- Monthly P&I
- —
- Monthly cashflow
- —
- DSCR
- —
- Eligible?
- —
Personal DTI + credit; lowest rate.
DSCR
20% down · 8.5% · 30yr
- Down + closing
- —
- Monthly P&I
- —
- Monthly cashflow
- —
- DSCR
- —
- Eligible?
- —
No personal income docs; deal must DSCR.
Hard money
10% down · 12.0% · 12mo
- Down + closing
- —
- Monthly P&I
- —
- Monthly cashflow
- —
- DSCR
- —
- Eligible?
- —
Short-term bridge; refi at stabilization.
Rent comps 24 comps
| Address | Beds | Baths | Sqft | Rent | $/sqft | DOM | Units | Dist |
|---|---|---|---|---|---|---|---|---|
| 7116 Donnell Pl Unit C Forestville, MD | 2.0 | 1.0 | 886 | $1,650 | $1.86 | 43d | 1 | 0.04mi |
| 7135 Donnell Pl Unit A1 District Heights, MD | 1.0 | 1.0 | 659 | $1,450 | $2.20 | 43d | 1 | 0.05mi |
| 7135 Donnell Pl Unit A1 District Heights, MD | 1.0 | 1.0 | 659 | $1,300 | $1.97 | 3d | 1 | 0.05mi |
| 7244 Donnell Pl Unit D2 District Heights, MD | 3.0 | 1.5 | 1108 | $1,900 | $1.71 | 43d | 1 | 0.06mi |
| 7248 Donnell Pl Unit B5 District Heights, MD | 2.0 | 1.0 | 886 | $1,950 | $2.20 | 24d | 1 | 0.08mi |
| 7248 Donnell Pl Unit B5 District Heights, MD | 2.0 | 1.0 | 886 | $1,950 | $2.20 | 17d | 1 | 0.08mi |
| 7206 Donnell Pl Unit D8 District Heights, MD | 2.0 | 1.0 | 884 | $1,800 | $2.04 | 43d | 1 | 0.08mi |
| 7208 Donnell Pl Unit C1 District Heights, MD | 2.0 | 1.0 | 800 | $1,649 | $2.06 | 43d | 1 | 0.09mi |
| 7157 Donnell Pl Unit A1 District Heights, MD | 1.0 | 1.0 | 700 | $1,500 | $2.14 | 43d | 1 | 0.09mi |
| 7169 Cross St Unit T1 District Heights, MD | 2.0 | 2.0 | 906 | $1,850 | $2.04 | 18d | 1 | 0.16mi |
| 3253 Walters Ln District Heights, MD | 1.0–3.0 | 1.0–1.5 | 941 | $1,705 | $1.81 | 3d | 17 | 0.54mi |
| 2908 Walters Ln Unit 1 District Heights, MD | 2.0 | 1.0 | 1100 | $1,400 | $1.27 | 24d | 1 | 0.64mi |
| 6501 Hil Mar Dr District Heights, MD | 1.0–3.0 | 1.0–1.5 | 1014 | $1,712 | $1.69 | 43d | 27 | 0.65mi |
| 2707 Judith Ave District Heights, MD | 2.0 | 1.0 | 816 | $2,500 | $3.06 | 43d | 1 | 0.70mi |
| 6310 Hil Mar Dr Unit 9-11 District Heights, MD | 2.0 | 1.0 | 913 | $1,750 | $1.92 | 18d | 1 | 0.78mi |
| 6525 Kenova St District Heights, MD | 2.0 | 1.0 | 1075 | $1,500 | $1.40 | 43d | 1 | 0.79mi |
| 2610 Lakehurst Ave District Heights, MD | 3.0 | 1.0 | 1096 | $2,150 | $1.96 | 43d | 1 | 0.82mi |
| 6305 Hil-Mar Dr District Heights, MD | 2.0 | 1.0 | 921 | $1,825 | $1.98 | 43d | 1 | 0.85mi |
| 4400 Rena Rd Suitland, MD | 1.0–3.0 | 1.0–1.5 | 995 | $1,832 | $1.84 | 3d | 9 | 0.90mi |
| 6311 Pennsylvania Ave District Heights, MD | 1.0–3.0 | 1.0 | 883 | $1,632 | $1.85 | 1d | 10 | 0.96mi |
| 3516 Community Dr District Heights, MD | 3.0 | 2.0 | 1096 | $1,500 | $1.37 | 5d | 1 | 0.99mi |
| 6024 Surrey Square Ln District Heights, MD | 1.0–3.0 | 1.0–2.0 | 1059 | $1,796 | $1.70 | 2d | 22 | 1.06mi |
| 5635 Regency Park Ct Hillcrest Heights, MD | 1.0–4.0 | 1.0–2.0 | 1177 | $1,635 | $1.39 | 2d | 28 | 1.47mi |
| 3321 Chester Grove Rd Upper Marlboro, MD | 2.0 | 1.0 | 780 | $2,100 | $2.69 | 18d | 1 | 1.49mi |
HOA detail condo
- Monthly dues
- $500 · $6,000/yr
- Assessments
- None detected in remarks — confirm with the listing agent.
Listing history 33 events
-
2026-04-22status Pending
-
2026-04-20price $100,000
-
2026-03-10price $110,000
-
2026-01-23price $125,000
-
2025-11-11status Active
-
2025-10-30historical Active Under Contract
-
2025-10-13status Active
-
2025-10-09historical
-
2025-10-07$140,000 Active
-
2025-09-18historical $140,000
-
2015-06-03soldstatus $60,300 203-char remark
Show marketing remark (203 chars)
This unit has been remodeled and is ready to move-into. All new hardwood floors, new carpet in bedrooms, new kitchen with stainless steel appliances, ceramic tile flooring, tiled back splash and balcony.
-
2015-06-03soldstatus $60,300 Sold 203-char remark
Show marketing remark (203 chars)
This unit has been remodeled and is ready to move-into. All new hardwood floors, new carpet in bedrooms, new kitchen with stainless steel appliances, ceramic tile flooring, tiled back splash and balcony.
-
2015-04-30status Contract 203-char remark
Show marketing remark (203 chars)
This unit has been remodeled and is ready to move-into. All new hardwood floors, new carpet in bedrooms, new kitchen with stainless steel appliances, ceramic tile flooring, tiled back splash and balcony.
-
2015-03-21price $59,900 203-char remark
Show marketing remark (203 chars)
This unit has been remodeled and is ready to move-into. All new hardwood floors, new carpet in bedrooms, new kitchen with stainless steel appliances, ceramic tile flooring, tiled back splash and balcony.
-
2015-03-09$63,900 Active 203-char remark
Show marketing remark (203 chars)
This unit has been remodeled and is ready to move-into. All new hardwood floors, new carpet in bedrooms, new kitchen with stainless steel appliances, ceramic tile flooring, tiled back splash and balcony.
-
2014-06-01historical
-
2014-05-29soldstatus $39,786 Sold
-
2014-05-29soldstatus $39,786
-
2014-04-04status Contingent (No Kick Out)
-
2014-04-03price $31,900
-
2014-04-03historical
-
2014-03-28status Active
-
2014-03-25historical
-
2014-03-25$34,900
-
2014-03-25$31,900
-
2013-12-27historical
-
2013-12-23soldstatus $35,000 Sold
-
2013-12-23soldstatus $35,000
-
2013-12-23status Contingent (No Kick Out)
-
2013-12-21historical
-
2013-12-03price $34,900
-
2013-11-01$34,900
-
2013-11-01$42,900 Active
ⓘ Source: listings_history table (triggers on properties + properties_extension) + one-shot
backfill from property_details.listing_events for pre-trigger history.
Climate risk First Street
- Flood 1/10 Low FEMA zone X (unshaded) · 0% chance over 30 yrs
- Wildfire 1/10 Low
- Heat 8/10 Severe 7 d/yr ≥103°F today · 16 d/yr by 30 yrs out
- Wind 4/10 Moderate 21% chance of damaging wind over 30 yrs
- Air quality 3/10 Moderate 2 unhealthy d/yr today · 3 by 30 yrs out
Nearby sold comps map
Loading sold comps map…
Walkable amenities ~0.75 mi
Loading nearby amenities…
Taxation est. · year 1
- Rental income
- $20,391
- − Mortgage interest
- −$5,602
- − Property taxes
- −$1,500
- − Insurance
- −$500
- − Repairs & maintenance
- −$1,631
- − Management
- −$1,631
- − HOA
- −$6,000
- − Depreciation
- −$2,909
- Taxable income
- $618
- Est. tax owed @ 24.0%
- −$148
- After-tax cash flow
- $1,668/yr
For passive investors: Depreciation is non-cash, so a rental often shows a tax loss while cash-flowing — sheltering income. Rental losses are passive: they offset passive income freely, and up to $25,000/yr can offset ordinary (W-2) income if you actively participate and your MAGI is under $100k (phasing out to $0 by $150k); unused losses carry forward. On sale, claimed depreciation is recaptured at up to 25%, and gains may owe capital-gains tax (a 1031 exchange can defer both). Figures are a year-1 estimate at your 24.0% rate — not tax advice; consult a CPA.
Schools (NCES district)
- District
- Prince George'S County Public Schools
- NCES district ID
- 2400510
- Math proficiency
- 8% ▼ -11.00%
- Reading proficiency
- 24% ▼ -9.00%
- Median HH income
- $73,967
- Composite
- 16.82/100
- National rank
- #9151
- State rank
- #21 of 24 in MD
Livability — Forestville
- Score
- 67/100
- State rank
- #215
- US rank
- #10596
Category grades
Schools grade is shown separately in the Schools card above.
Census & demographics
- Census place
- Forestville, MD
- County
- Prince Georges County · 919,866 people
- City population
- 37,924
- Metro
- Washington-Arlington-Alexandria, DC-VA-MD-WV
- Population (ZIP)
- 38,301
- Household income
- $76,298
- Rent vs Own
- Severe rent burden
- 2132.0
Population outlook (Prince George's County) Hauer SSP2
- Today (2025)
- 1,005,426 people
- By 2030
- 1,048,416 · +4.3%
- By 2040
- 1,123,425 · +11.7%
- By 2050
- 1,183,220 · +17.7%
- By 2075
- 1,306,202 · +29.9%
- By 2100
- 1,408,179 · +40.1%
Race, ethnicity, and origin ACS 2023
- Neighborhood character
- Predominantly Black (86%)
- Race & ethnicity
- Black 86% Hispanic / Latino 7% Two or more races 5% White 2%
- Hispanic origin (detail)
- Foreign-born
- 8% · Canada
- Languages at home
- 89% English-only · Spanish 6% French/Haitian/Cajun 1%
Political lean MEDSL · Prince George's
- 2024 margin
- Solid D (+75.2) · D 86.3% · R 11.2% · Other 2.5%
- 2008→2024 swing
- -3.3pp toward R · 2008: 78.5pp · 2024: 75.2pp
- All cycles
- 2024: D+75.2 2020: D+80.5 2016: D+81.0 2012: D+80.9 2008: D+78.5
Not yet ingested
- Civics
- —
Market trends
- HPI YoY
- ▼ -67.90%
- Current HPI
- 289.095
- Rent YoY
- ▲ 2.00%
- Metro
- Washington-Arlington-Alexandria, DC-VA-MD-WV
- State GDP YoY
- ▲ 2.97%
- F500 in state
- 12
Industry mix (Fortune 500 HQ in MD)
| Industry | F500 HQs | Revenue |
|---|---|---|
| Aerospace / Defense | 1 | $71B |
|
||
| Utilities | 1 | $25B |
|
||
| Hotels | 1 | $24B |
|
||
| Consumer Goods | 1 | $7B |
|
||
| Real Estate | 1 | $6B |
|
||
| Chemicals | 1 | $2B |
|
||
Price history
+133.1% since first listed33 events — show timeline
- 2026-04-22 Pending — BRIGHT MLS
- 2026-04-20 Price Changed $100,000 BRIGHT MLS
- 2026-03-10 Price Changed $110,000 BRIGHT MLS
- 2026-01-23 Price Changed $125,000 BRIGHT MLS
- 2025-11-11 Relisted — BRIGHT MLS
- 2025-10-30 Contingent — BRIGHT MLS
- 2025-10-13 Relisted — BRIGHT MLS
- 2025-10-09 Listing Removed — BRIGHT MLS
- 2025-10-07 Listed $140,000 BRIGHT MLS
- 2025-09-18 Coming Soon $140,000 BRIGHT MLS
- 2015-06-03 Sold (MLS) $60,300 MRIS
- 2015-06-03 Sold (MLS) $60,300 BRIGHT MLS
- 2015-04-30 Pending — MRIS
- 2015-03-21 Price Changed $59,900 MRIS
- 2015-03-09 Listed $63,900 MRIS
- 2014-06-01 Delisted — MRIS
- 2014-05-29 Sold (MLS) $39,786 BRIGHT MLS
- 2014-05-29 Sold (MLS) $39,786 MRIS
- 2014-04-04 Pending — MRIS
- 2014-04-03 Price Changed $31,900 MRIS
- 2014-04-03 Listing Removed — BRIGHT MLS
- 2014-03-28 Relisted — MRIS
- 2014-03-25 Listed $31,900 BRIGHT MLS
- 2014-03-25 Listed $34,900 MRIS
- 2014-03-25 Delisted — MRIS
- 2013-12-27 Delisted — MRIS
- 2013-12-23 Sold (MLS) $35,000 BRIGHT MLS
- 2013-12-23 Sold (MLS) $35,000 MRIS
- 2013-12-23 Pending — MRIS
- 2013-12-21 Listing Removed — BRIGHT MLS
- 2013-12-03 Price Changed $34,900 MRIS
- 2013-11-01 Listed $34,900 BRIGHT MLS
- 2013-11-01 Listed $42,900 MRIS
Cash-flow waterfall
monthlySold comps — $/sqft
last 12 mo · ≤1 miLoading sold comps…