 🌊 Lakefront
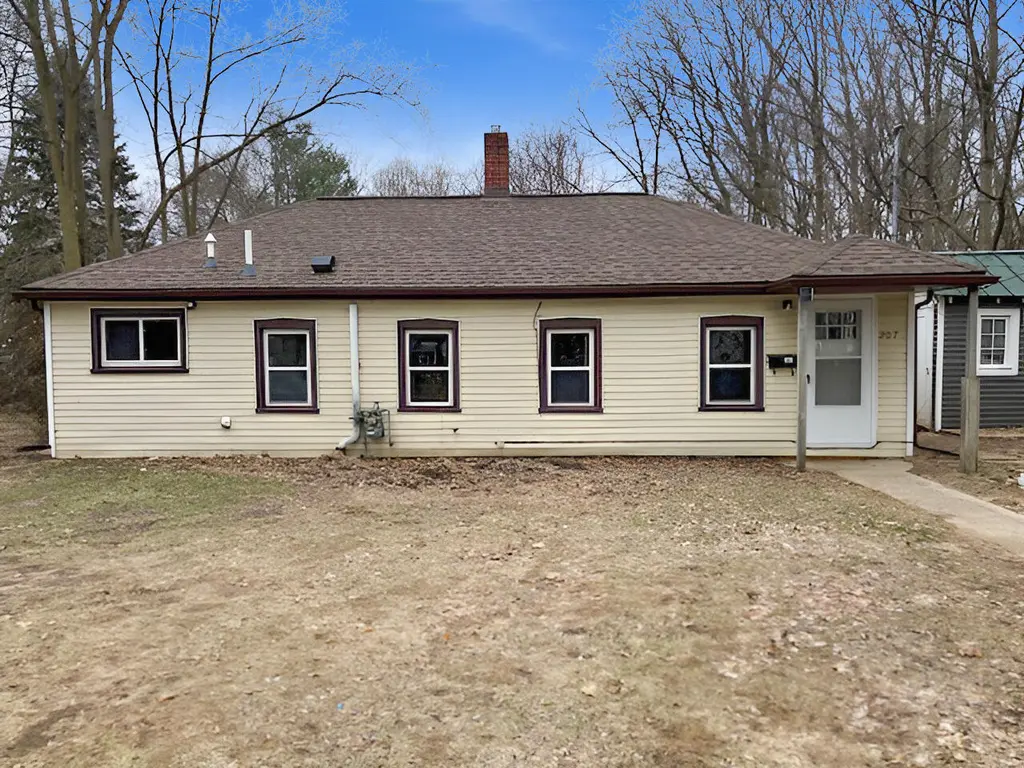
207 N Osmun St · Greenville, MI
Flood risk 1/10 · Minimal
- FEMA flood zone
- —
- Chance of flooding over 30 yrs
- 0.0%
- Est. flood insurance / yr
- —
Fire risk 1/10 · Minimal
- Est. fire insurance / yr
- $784 – $1,456
Heat risk 2/10 · Minimal
- Hot days now (above 98°F)
- 7 days/yr
- Hot days in 30 yrs
- 15 days/yr
Wind risk 1/10 · Minimal
- Chance of severe wind over 30 yrs
- —
Air-quality risk 2/10 · Minimal
- Unhealthy air days now
- 1 days/yr
- Unhealthy air days in 30 yrs
- 1 days/yr
Risk factors via First Street. Map © Google.
Why this score? — see what drove the C- grade
The composite is a weighted blend of 9 inputs, each scored 0–100. Each bar is that input's sub-score; the figure is the points it added to the 100-point composite (weight × sub-score).
- Cash flow +16.3/30.0
- ARV discount +15.0/15.0
- DSCR +5.0/10.0
- 1% rule +4.4/10.0
- Schools +3.7/10.0
- Livability +3.3/5.0
- Rent growth +2.5/5.0
- Condition / age +2.5/5.0
- Appreciation +0.0/10.0
$159,900
🖨 Deal sheet 📄 Offer letter ✓ Due diligence
Listing remarks MLS
This is a Fannie Mae HomePath property. This well-maintained home offers comfortable single-level living with two bedrooms and one bathroom. The property provides a practical floor plan that maximizes the available space efficiently. With its functional design and strategic positioning, this property offers the fundamentals needed for comfortable living while maintaining proximity to important local institutions. All information represented herein is approximated, and independent verification by buyer is required - information is not guaranteed. Potential buyers should independently verify all information on listing card for accuracy. Some images in this listing have been virtually staged.
Key facts
- 6,844 sq ft lot
- Built 1940
- Listed 47 days
Neighborhood map
What this means for you Summary
Snapshot
- This is a 2-bed/1.0-bath single-family listed at $160k.
Deal economics
- At list price, monthly cash flow is $88 ($1k/yr) — positive.
- The deal already cash-flows at list — no discount required.
- To meet the 1% rule (rent ≥ 1% of price), the offer needs to be $151k (5.6% below list).
- Recommended offer: $151k (5.6% below list) — sets the bar for 1% rule.
- Cap rate 7.0% vs local median 4.2% in Greenville — top-decile yield for the area; either an underpriced asset or a hidden risk that comps aren't pricing in. Stress-test before assuming the spread holds.
Location & tenants
- Location reads 66/100 on livability (#426 in MI) — a middle-class / working-renter tenant base. Strengths: cost of living A+, housing A+; Watch: schools D, crime F, amenities F.
- Greenville Public Schools (town): math 35% / reading 52% proficiency, ranked #167 of 540 in MI (top 31%) — families likely to look elsewhere, expect single-tenant / working-renter base with shorter leases.
- Market conditions: 192 active listings in the ZIP; 15 comparable units currently listed for rent nearby; rentals leasing fast (median 11d on market — plan ~1-2 weeks tenant-placement turnaround); 273 units permitted in Montcalm County in 2024 (5 in 5+ unit buildings).
Forward outlook
- Local home prices are declining (-3.0%/yr); year-one equity from $1k of loan paydown is wiped out by about $5k of value loss. Plan a longer hold.
- Montcalm County population projected at -17% by 2050 — secular population decline; favor cash flow + early exit over multi-decade hold.
Negotiation context
- It's been on market 47 days — a 3% lower offer ($155k) is reasonable based on typical stale-listing flexibility.
- 10 sale attempts since 7y ago; this cycle's ask has dropped $10k (6%) from the opening price — seller is motivated, your offer sets the floor, not the list.
- Current owner paid $67k; list at $160k implies a 137% gain — meaningful room to come down on a strong offer.
Risks & watch-outs
- Watch-outs: built in 1940 — expect roof / HVAC / electrical / plumbing capex.
Questions for the listing agent
- It's been on market 47 days. Have you received any prior offers? Is the seller open to a 6% concession, seller financing, or rate buy-down credit?
- Built in 1940 — when were the roof, HVAC, electrical panel, plumbing, and water heater last replaced?
- Is there a deadline driving the sale (1031 exchange, divorce, estate, relocation)? That informs how much negotiation room exists.
- Schools are D-rated, which usually means shorter tenancies and higher turnover. Who's the typical renter profile here, and what's been the actual vacancy rate?
- Crime grade is F in this area — have there been break-ins, vandalism, or insurance claims at this property in the last 3 years? What carrier currently insures it and at what premium?
- This sits on a lake — are riparian / water-frontage rights deeded with the parcel? Any dock permits, shoreline easements, or HOA water-use restrictions?
- What's the documented flood / surge / shoreline-erosion history here (FEMA AND non-FEMA — e.g., storm surge, creek backup, septic-field saturation)?
- Any water-quality or seasonal algae-bloom issues that affect tenant satisfaction or short-term-rental demand?
- What's the average days-on-market for RENTAL listings here right now (not sales)? A rising rental-DOM trend means longer vacancies and softer asking-rent achievability than the comps imply.
- What's the recent tenant-quality profile in this submarket — average credit score on applications, eviction rate, late-payment / NSF rate, and stable-employment percentage? A property-management company in the area should have these aggregated.
- How much new for-sale + rental construction is in the pipeline within 1–3 miles? Heavy new supply typically softens prices + rents 12–24 months out; constrained supply supports both.
Investment metrics
- 1% rule
- 0.94% ✗
- Cap rate
- 6.95%
- Cash-on-cash
- 2.35%
- DSCR
- 1.10
- GRM
- 8.8
CMA / ARV
- ARV (median comp)
- $195,379
- List price
- $159,900
- Delta
- -18.16%
- Verdict
- UNDERPRICED
- Comps
- 20 within 1.0 mi
Show comp detail 12 sales within ~0.75 mi
| Address | Dist | Beds/Ba | Sqft | Sold | Price | $/sf | Match |
|---|---|---|---|---|---|---|---|
| 726 N Lafayette St | 0.51mi | 2/1.0 | 1,084 (-3%) | 4mo | $159,950 | $148 | 68 |
| 515 W Montcalm St | 0.08mi | 1/1.0 (-1) | 1,008 (-9%) | 11mo | $190,000 | $188 | 66 |
| 516 W Montcalm St | 0.08mi | 1/1.0 (-1) | 956 (-14%) | 2mo | $203,000 | $212 | 66 |
| 803 W Cass St | 0.41mi | 2/1.5 | 1,178 (+6%) | 11mo | $215,000 | $183 | 60 |
| 202 E Summit St | 0.67mi | 2/1.0 | 1,094 (-2%) | 8mo | $190,000 | $174 | 59 |
| 310 S Bower St | 0.59mi | 2/1.0 | 1,201 (+8%) | 10mo | $185,000 | $154 | 51 |
| 315 E Coffren Ave | 0.62mi | 3/1.0 (+1) | 1,220 (+10%) | 1mo | $260,000 | $213 | 49 |
| 503 E Water St | 0.68mi | 3/1.0 (+1) | 1,030 (-8%) | 3mo | $45,000 | $44 | 48 |
| 301 E North St | 0.74mi | 2/1.0 | 1,200 (+8%) | 6mo | $80,000 | $67 | 48 |
| 927 W Grove St | 0.45mi | 2/1.0 | 1,252 (+12%) | 13mo | $185,000 | $148 | 48 |
| 516 E Market St | 0.71mi | 2/1.0 | 1,200 (+8%) | 11mo | $200,000 | $167 | 44 |
| 815 W Judd St | 0.72mi | 3/2.0 (+1) | 1,260 (+13%) | 12mo | $290,000 | $230 | 25 |
Match score weights: distance 35% · size 25% · config 20% · recency 20%. Top-matched comps best support the ARV.
Projected returns pro-forma
-3.0% appreciation · 3.0% rent growth · sell at horizon
- IRR
- -12.6%
- Equity multiple
- 0.55×
- Total profit
- $-20,309
- Equity at exit
- $23,842
- IRR
- -3.5%
- Equity multiple
- 0.77×
- Total profit
- $-10,408
- Equity at exit
- $13,825
Cash invested: $44,772 (down + closing). Projections, not guarantees.
Landlord ↔ Tenant lean methodology
- Overall (STATE)
- 62 Landlord-Friendly
- State Michigan
- 62 Landlord-Friendly · EVEN
- County
- — inherits STATE
- City
- — inherits STATE
ZIP-level market 48838
- Home prices YoY
- -30.2%
- Active inventory
- 192
- Price-to-rent
- 8.8×
Monthly cashflow live
- Estimated rent
- $1,510 high interval (Pro) →
- Mortgage (P&I)
- −$839
- Tax est. 1.5%
- −$200 /mo · $2,398/yr
- Insurance
- −$67
- HOA
- −$0
- Vacancy / Maint / Mgmt
- −$317
- Net cashflow
- $88
Break-even live
UW: 25.0% down · 7.5% · 30yr · 1.5% tax · 5.0% vac · 8.0% maint · 8.0% mgmt
Financing live
Cash to close
- Down payment
- $39,975
- Closing costs
- $4,797
- Reserves months
- —
- Total cash needed
- —
Loan-product check · same deal, 3 products live
Conventional
25% down · 7.5% · 30yr
- Down + closing
- —
- Monthly P&I
- —
- Monthly cashflow
- —
- DSCR
- —
- Eligible?
- —
Personal DTI + credit; lowest rate.
DSCR
20% down · 8.5% · 30yr
- Down + closing
- —
- Monthly P&I
- —
- Monthly cashflow
- —
- DSCR
- —
- Eligible?
- —
No personal income docs; deal must DSCR.
Hard money
10% down · 12.0% · 12mo
- Down + closing
- —
- Monthly P&I
- —
- Monthly cashflow
- —
- DSCR
- —
- Eligible?
- —
Short-term bridge; refi at stabilization.
Rent comps 15 comps
| Address | Beds | Baths | Sqft | Rent | $/sqft | DOM | Units | Dist |
|---|---|---|---|---|---|---|---|---|
| 102 1/2 S Lafayette St Unit 4 Greenville, MI | 1.0 | 1.0 | 700 | $975 | $1.39 | 2d | 1 | 0.36mi |
| 720 N Lafayette St Unit 2 Greenville, MI | 2.0 | 1.0 | 900 | $1,400 | $1.56 | 2d | 1 | 0.47mi |
| 305 E Grove St Unit 1 Greenville, MI | 2.0 | 1.0 | 800 | $1,095 | $1.37 | 10d | 1 | 0.50mi |
| 305 E Grove St Unit 1 Greenville, MI | 2.0 | 1.0 | 800 | $1,095 | $1.37 | 2d | 1 | 0.50mi |
| 212 E Grant St Unit 2 Greenville, MI | 1.0 | 1.0 | 750 | $925 | $1.23 | 2d | 1 | 0.75mi |
| 212 E Grant St Unit 2 Greenville, MI | 1.0 | 1.0 | 750 | $925 | $1.23 | 10d | 1 | 0.75mi |
| 804 S Clay St Greenville, MI | 2.0 | 1.0 | 900 | $1,300 | $1.44 | 10d | 1 | 0.80mi |
| 632 E Washington St Unit 1 Greenville, MI | 2.0 | 2.0 | 1024 | $1,425 | $1.39 | 2d | 1 | 0.89mi |
| 1305 Trail View Dr Greenville, MI | 3.0 | 2.5 | 1450 | $2,295 | $1.58 | 2d | 1 | 0.98mi |
| 1301 Timber Hollow Ct Greenville, MI | 3.0 | 2.5 | 1450 | $2,295 | $1.58 | 43d | 1 | 1.02mi |
| 1301 Timber Hollow Ct Greenville, MI | 3.0 | 2.5 | 1450 | $1,895 | $1.31 | 2d | 1 | 1.02mi |
| 1310 Timber Hollow Ct Greenville, MI | 3.0 | 2.5 | 1450 | $1,895 | $1.31 | 14d | 1 | 1.03mi |
| 1310 Timber Hollow Ct Greenville, MI | 3.0 | 2.5 | 1450 | $2,295 | $1.58 | 43d | 1 | 1.03mi |
| 1310 Trail View Dr Greenville, MI | 3.0 | 2.5 | 1450 | $2,195 | $1.51 | 10d | 1 | 1.04mi |
| 914 E Oak St Apt 7 Greenville, MI | 2.0 | 1.0 | 797 | $1,000 | $1.25 | 43d | 1 | 1.11mi |
Listing history 36 events
-
2026-06-03statusdays on market $159,900 Pending 47 DOM
-
2026-06-03days on market $159,900 Active 46 DOM
-
2026-06-01days on market $159,900 Active 45 DOM
-
2026-05-31days on market $159,900 Active 44 DOM
-
2026-05-12price $159,900 698-char remark
Show marketing remark (698 chars)
This is a Fannie Mae HomePath property. This well-maintained home offers comfortable single-level living with two bedrooms and one bathroom. The property provides a practical floor plan that maximizes the available space efficiently. With its functional design and strategic positioning, this property offers the fundamentals needed for comfortable living while maintaining proximity to important local institutions. All information represented herein is approximated, and independent verification by buyer is required - information is not guaranteed. Potential buyers should independently verify all information on listing card for accuracy. Some images in this listing have been virtually staged.
-
2026-05-12price $159,900
Show marketing remark (698 chars)
This is a Fannie Mae HomePath property. This well-maintained home offers comfortable single-level living with two bedrooms and one bathroom. The property provides a practical floor plan that maximizes the available space efficiently. With its functional design and strategic positioning, this property offers the fundamentals needed for comfortable living while maintaining proximity to important local institutions. All information represented herein is approximated, and independent verification by buyer is required - information is not guaranteed. Potential buyers should independently verify all information on listing card for accuracy. Some images in this listing have been virtually staged.
-
2026-04-16$169,900 Active 698-char remark
Show marketing remark (698 chars)
This is a Fannie Mae HomePath property. This well-maintained home offers comfortable single-level living with two bedrooms and one bathroom. The property provides a practical floor plan that maximizes the available space efficiently. With its functional design and strategic positioning, this property offers the fundamentals needed for comfortable living while maintaining proximity to important local institutions. All information represented herein is approximated, and independent verification by buyer is required - information is not guaranteed. Potential buyers should independently verify all information on listing card for accuracy. Some images in this listing have been virtually staged.
-
2026-04-16$169,900 Active
Show marketing remark (698 chars)
This is a Fannie Mae HomePath property. This well-maintained home offers comfortable single-level living with two bedrooms and one bathroom. The property provides a practical floor plan that maximizes the available space efficiently. With its functional design and strategic positioning, this property offers the fundamentals needed for comfortable living while maintaining proximity to important local institutions. All information represented herein is approximated, and independent verification by buyer is required - information is not guaranteed. Potential buyers should independently verify all information on listing card for accuracy. Some images in this listing have been virtually staged.
-
2024-12-17status Pending
-
2024-10-21status Pending
-
2024-10-21status Pending
-
2024-10-21historical
-
2024-10-21historical
-
2024-10-11$119,900 Active
-
2024-10-11$119,900 Active
-
2021-03-05soldstatus $67,400 Sold
-
2021-03-05soldstatus $67,400 Sold
-
2021-03-05soldstatus $67,400
-
2021-03-05soldstatus $67,400
-
2021-02-20status Pending
-
2021-02-20status Pending
-
2021-02-08price $74,900
-
2021-02-08price $74,900
-
2021-01-18price $79,900
-
2021-01-18price $79,900
-
2021-01-15soldstatus $53,000
-
2021-01-04status Active
-
2020-11-30price $84,900
-
2020-11-25historical
-
2020-11-18$84,900 Active
-
2020-11-18$90,000 Active
-
2020-11-18$74,900
-
2020-02-06soldstatus $95,000
-
2019-09-27$99,900
ⓘ Source: listings_history table (triggers on properties + properties_extension) + one-shot
backfill from property_details.listing_events for pre-trigger history.
Climate risk First Street
- Flood 1/10 Low 0% chance over 30 yrs
- Wildfire 1/10 Low
- Heat 2/10 Low 7 d/yr ≥98°F today · 15 d/yr by 30 yrs out
- Wind 1/10 Low
- Air quality 2/10 Low 1 unhealthy d/yr today · 1 by 30 yrs out
Nearby sold comps map
Loading sold comps map…
Walkable amenities ~0.75 mi
Loading nearby amenities…
Taxation est. · year 1
- Rental income
- $18,116
- − Mortgage interest
- −$8,957
- − Property taxes
- −$2,398
- − Insurance
- −$800
- − Repairs & maintenance
- −$1,449
- − Management
- −$1,449
- − Depreciation
- −$4,652
- Taxable loss
- −$1,589
- Est. tax savings @ 24.0%
- +$381
- After-tax cash flow
- $1,433/yr
For passive investors: Depreciation is non-cash, so a rental often shows a tax loss while cash-flowing — sheltering income. Rental losses are passive: they offset passive income freely, and up to $25,000/yr can offset ordinary (W-2) income if you actively participate and your MAGI is under $100k (phasing out to $0 by $150k); unused losses carry forward. On sale, claimed depreciation is recaptured at up to 25%, and gains may owe capital-gains tax (a 1031 exchange can defer both). Figures are a year-1 estimate at your 24.0% rate — not tax advice; consult a CPA.
Schools (NCES district)
- District
- Greenville Public Schools
- NCES district ID
- 2617160
- Math proficiency
- 35% ▼ -7.00%
- Reading proficiency
- 52% ▬ 0.00%
- Median HH income
- $44,624
- Composite
- 36.81/100
- National rank
- #4566
- State rank
- #167 of 540 in MI
Livability — Greenville
- Score
- 66/100
- State rank
- #426
- US rank
- #11581
Category grades
Schools grade is shown separately in the Schools card above.
Census & demographics
- Census place
- Greenville, MI
- County
- Montcalm County · 18,212 people
- City population
- 18,212
- Metro
- Grand Rapids-Kentwood, MI
- Population (ZIP)
- 18,212
- Household income
- $70,176
- Rent vs Own
- Severe rent burden
- 365.0
Population outlook (Montcalm County) Hauer SSP2
- Today (2025)
- 61,011 people
- By 2030
- 59,467 · -2.5%
- By 2040
- 55,427 · -9.2%
- By 2050
- 50,517 · -17.2%
- By 2075
- 38,731 · -36.5%
- By 2100
- 26,770 · -56.1%
Race, ethnicity, and origin ACS 2023
- Neighborhood character
- Predominantly White (85%)
- Race & ethnicity
- White 85% Two or more races 10% Hispanic / Latino 8%
- Hispanic origin (detail)
- Mexican 5% Puerto Rican 2%
- Common ancestry
- Iranian 5% Romanian 4% Lithuanian 2%
- Foreign-born
- 3% · Canada
- Languages at home
- 93% English-only · Spanish 5% Chinese 1%
Political lean MEDSL · Montcalm
- 2024 margin
- Solid R (+39.0) · D 29.8% · R 68.7% · Other 1.5%
- 2008→2024 swing
- -38.7pp toward R · 2008: -0.3pp · 2024: -39.0pp
- All cycles
- 2024: R+39.0 2020: R+37.7 2016: R+34.0 2012: R+8.6 2008: R+0.3
Not yet ingested
- Civics
- —
Market trends
- HPI YoY
- ▼ -108.31%
- Current HPI
- 249.996
- Rent YoY
- —
- Metro
- Grand Rapids-Kentwood, MI
- State GDP YoY
- ▲ 1.37%
- F500 in state
- 28
Industry mix (Fortune 500 HQ in MI)
| Industry | F500 HQs | Revenue |
|---|---|---|
| Automotive Parts | 3 | $48B |
|
||
| Automotive | 2 | $372B |
|
||
| Chemicals | 1 | $45B |
|
||
| Automotive Retail | 1 | $29B |
|
||
| Healthcare / Medical Devices | 1 | $23B |
|
||
| Automotive Technology | 1 | $20B |
|
||
Price history
+60.1% since first listed32 events — show timeline
- 2026-05-12 Price Changed $159,900 MiRealSource-MiMLS
- 2026-05-12 Price Changed $159,900 REALCOMP
- 2026-05-12 Price Changed $159,900 SW Michigan MLS
- 2026-04-16 Listed $169,900 SW Michigan MLS
- 2026-04-16 Listed $169,900 REALCOMP
- 2026-04-16 Listed $169,900 MiRealSource-MiMLS
- 2024-12-17 Pending — REALCOMP
- 2024-10-21 Pending — REALCOMP
- 2024-10-21 Pending — MiRealSource-MiMLS
- 2024-10-21 Listing Removed — MiRealSource-MiMLS
- 2024-10-21 Listing Removed — REALCOMP
- 2024-10-11 Listed $119,900 MiRealSource-MiMLS
- 2024-10-11 Listed $119,900 REALCOMP
- 2021-03-05 Sold (Public Records) $67,400 Public Records
- 2021-03-05 Sold (MLS) $67,400 MiRealSource-MiMLS
- 2021-03-05 Sold (MLS) $67,400 SW Michigan MLS
- 2021-03-05 Sold (MLS) $67,400 REALCOMP
- 2021-02-20 Pending — REALCOMP
- 2021-02-20 Pending — SW Michigan MLS
- 2021-02-08 Price Changed $74,900 REALCOMP
- 2021-02-08 Price Changed $74,900 SW Michigan MLS
- 2021-01-18 Price Changed $79,900 REALCOMP
- 2021-01-18 Price Changed $79,900 SW Michigan MLS
- 2021-01-15 Sold (Public Records) $53,000 Public Records
- 2021-01-04 Relisted — SW Michigan MLS
- 2020-11-30 Price Changed $84,900 SW Michigan MLS
- 2020-11-25 Listing Removed — SW Michigan MLS
- 2020-11-18 Listed $74,900 MiRealSource-MiMLS
- 2020-11-18 Listed $90,000 SW Michigan MLS
- 2020-11-18 Listed $84,900 REALCOMP
- 2020-02-06 Sold (Public Records) $95,000 Public Records
- 2019-09-27 Listed $99,900 MiRealSource-MiMLS
Cash-flow waterfall
monthlySold comps — $/sqft
last 12 mo · ≤1 miLoading sold comps…