 🏗️ New Construction
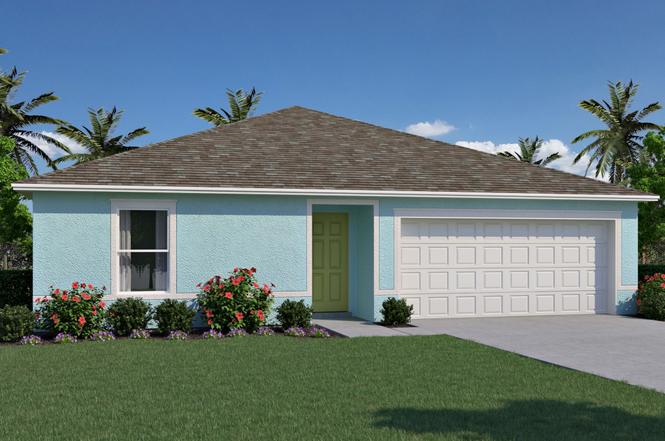
Fishtail Plan · Dundee, FL
Flood risk 1/10 · Minimal
- FEMA flood zone
- X (unshaded)
- Chance of flooding over 30 yrs
- 0.0%
- Est. flood insurance / yr
- $507 – $1,088
Fire risk 5/10 · Moderate
- Est. fire insurance / yr
- $947 – $1,759
Heat risk 9/10 · Severe
- Hot days now (above 108°F)
- 7 days/yr
- Hot days in 30 yrs
- 25 days/yr
Wind risk 10/10 · Severe
- Chance of severe wind over 30 yrs
- 99.0%
Air-quality risk 1/10 · Minimal
- Unhealthy air days now
- 0 days/yr
- Unhealthy air days in 30 yrs
- 0 days/yr
Risk factors via First Street. Map © Google.
Why this score? — see what drove the D grade
The composite is a weighted blend of 9 inputs, each scored 0–100. Each bar is that input's sub-score; the figure is the points it added to the 100-point composite (weight × sub-score).
- Appreciation +10.0/10.0
- Cash flow +7.8/30.0
- ARV discount +7.5/15.0
- Schools +3.5/10.0
- Livability +3.2/5.0
- Rent growth +2.5/5.0
- Condition / age +2.5/5.0
- 1% rule +2.3/10.0
- DSCR +1.8/10.0
$291,990
🖨 Deal sheet 📄 Offer letter ✓ Due diligence
Listing remarks
Introducing the Fishtail floorplan, a spacious and versatile offering from our Value Collection. This roomy plan spans 1,525 square feet, providing ample space for comfortable living. Upon entering, you'll find two bedrooms and a bathroom located in the front of the home, offering privacy and convenience. Nestled in the back of the home is the Owners Suite, featuring an attached bathroom and a walk-in closet with abundant storage space. The dining room space is perfectly situated near the open-air kitchen, creating an ideal setting for both meals and entertaining. With continued counterspace and ample cabinets, this kitchen is a dream for culinary enthusiasts. The great room seamlessly flow
Key facts
- Owners suite
- Open-air kitchen
- Walk-in closet
Tags
Property features AI
Finance
- Other: Address: 208 Spindlewood Blvd, Dundee, FL 33838; Status: Active; Last modified: 2026-05-22
- Financial info: List price $299,990
Exterior
- Parking: 2 total parking spaces; 2-car garage
- Home design: Single-family plan (Fishtail)
- Exterior features: Living area of 1525 (plan)
Interior
- Bedrooms: 3 bedrooms
- Bathrooms: 2 bathrooms (full)
- Interior features: Plan is labeled 'Fishtail' (new construction plan)
Neighborhood map
What this means for you Summary
Snapshot
- This is a 3-bed/2.0-bath single-family listed at $292k.
Deal economics
- At list price, monthly cash flow is $-329 ($-4k/yr) — negative.
- To cash-flow at today's rent, offer at most $244k (16.3% below list).
- To meet the 1% rule (rent ≥ 1% of price), the offer needs to be $214k (26.8% below list).
- Recommended offer: $214k (26.8% below list) — sets the bar for 1% rule.
Location & tenants
- Location reads 65/100 on livability (#638 in FL) — a middle-class / working-renter tenant base. Strengths: cost of living A+, housing A+, crime B+; Watch: employment D+, schools D, amenities F.
- Polk (suburban): math 39% / reading 43% proficiency, ranked #62 of 73 in FL (top 85%) — families likely to look elsewhere, expect single-tenant / working-renter base with shorter leases.
- Market conditions: 149 active listings in the ZIP; 3 comparable units currently listed for rent nearby; rentals leasing fast (median 4d on market — plan ~1-2 weeks tenant-placement turnaround); 10,384 units permitted in Polk County in 2024 (1,716 in 5+ unit buildings).
Forward outlook
- In year one you build about $31k of equity ($2k loan paydown + $29k appreciation (10.0% local appreciation)).
- Polk County population projected at +33% by 2050 — long-run rental-demand tailwind backs the buy-and-hold thesis.
- By year 2, paydown + projected appreciation supports a ~$50k cash-out refi (75% LTV) — recoverable capital for the next deal without selling this one.
Negotiation context
- It's been on market 134 days — a 12% lower offer ($257k) is reasonable based on typical stale-listing flexibility.
Risks & watch-outs
- Climate carrying-cost: severe wind risk, 99% chance of damaging wind over 30y; moderate wildfire risk; extreme-heat days projected 7→25/yr by 2055 (HVAC capex compounding) — expect insurance premiums to compound above CPI over the hold.
Questions for the listing agent
- What do current leases actually rent for vs. the listed asking? Can we see a recent rent roll and the last 12 months of T-12 income?
- It's been on market 134 days. Have you received any prior offers? Is the seller open to a 27% concession, seller financing, or rate buy-down credit?
- Why hasn't it sold? Are there any deal-killer items the seller is aware of (foundation, flood, title, zoning, code violations)?
- Is there a deadline driving the sale (1031 exchange, divorce, estate, relocation)? That informs how much negotiation room exists.
- Schools are D-rated, which usually means shorter tenancies and higher turnover. Who's the typical renter profile here, and what's been the actual vacancy rate?
- The area grade is low — what's the realistic commute time and amenity access for the typical tenant pool here? Any planned neighborhood developments (good or bad) we should know about?
- What's the average days-on-market for RENTAL listings here right now (not sales)? A rising rental-DOM trend means longer vacancies and softer asking-rent achievability than the comps imply.
- What's the recent tenant-quality profile in this submarket — average credit score on applications, eviction rate, late-payment / NSF rate, and stable-employment percentage? A property-management company in the area should have these aggregated.
- How much new for-sale + rental construction is in the pipeline within 1–3 miles? Heavy new supply typically softens prices + rents 12–24 months out; constrained supply supports both.
Investment metrics
- 1% rule
- 0.73% ✗
- Cap rate
- 4.94%
- Cash-on-cash
- -4.84%
- DSCR
- 0.78
- GRM
- 11.4
CMA / ARV
No comps found within radius.
Projected returns pro-forma
10.0% appreciation · 3.0% rent growth · sell at horizon
- IRR
- 20.9%
- Equity multiple
- 2.69×
- Total profit
- $138,076
- Equity at exit
- $263,048
- IRR
- 18.9%
- Equity multiple
- 6.18×
- Total profit
- $423,176
- Equity at exit
- $567,272
Cash invested: $81,757 (down + closing). Projections, not guarantees.
Landlord ↔ Tenant lean methodology
- Overall (STATE)
- 87 Strongly Landlord-Friendly
- State Florida
- 87 Strongly Landlord-Friendly · R+3
- County
- — inherits STATE
- City
- — inherits STATE
ZIP-level market 33838
- Home prices YoY
- 17.6%
- Active inventory
- 149
- Price-to-rent
- 11.4×
Monthly cashflow live
- Estimated rent
- $2,137 medium interval (Pro) →
- Mortgage (P&I)
- −$1,531
- Tax est. 1.5%
- −$365 /mo · $4,380/yr
- Insurance
- −$122
- HOA
- −$0
- Vacancy / Maint / Mgmt
- −$449
- Net cashflow
- $-329
Break-even live
UW: 25.0% down · 7.5% · 30yr · 1.5% tax · 5.0% vac · 8.0% maint · 8.0% mgmt
Financing live
Cash to close
- Down payment
- $72,998
- Closing costs
- $8,760
- Reserves months
- —
- Total cash needed
- —
Loan-product check · same deal, 3 products live
Conventional
25% down · 7.5% · 30yr
- Down + closing
- —
- Monthly P&I
- —
- Monthly cashflow
- —
- DSCR
- —
- Eligible?
- —
Personal DTI + credit; lowest rate.
DSCR
20% down · 8.5% · 30yr
- Down + closing
- —
- Monthly P&I
- —
- Monthly cashflow
- —
- DSCR
- —
- Eligible?
- —
No personal income docs; deal must DSCR.
Hard money
10% down · 12.0% · 12mo
- Down + closing
- —
- Monthly P&I
- —
- Monthly cashflow
- —
- DSCR
- —
- Eligible?
- —
Short-term bridge; refi at stabilization.
Rent comps 3 comps
| Address | Beds | Baths | Sqft | Rent | $/sqft | DOM | Units | Dist |
|---|---|---|---|---|---|---|---|---|
| 2163 Mandarin Loop Dundee, FL | 3.0 | 2.0 | 1688 | $2,049 | $1.21 | 3d | 1 | 1.08mi |
| 1709 Hill Top Dr Dundee, FL | 4.0 | 3.0 | 2072 | $2,160 | $1.04 | 3d | 1 | 1.35mi |
| 1804 Vista View Dr Dundee, FL | 4.0 | 3.0 | 2066 | $2,250 | $1.09 | 23d | 1 | 1.35mi |
Listing history 13 events
-
2026-06-18days on market $291,990 Active 134 DOM
-
2026-06-17days on market $291,990 Active 133 DOM
-
2026-06-16days on market $291,990 Active 132 DOM
-
2026-06-15days on market $291,990 Active 131 DOM
-
2026-06-13days on market $291,990 Active 129 DOM
-
2026-06-10days on market $291,990 Active 126 DOM
-
2026-06-09days on market $291,990 Active 125 DOM
-
2026-06-08days on market $291,990 Active 124 DOM
-
2026-06-07days on market $291,990 Active 123 DOM
-
2026-06-05pricedays on market $291,990 Active 120 DOM
-
2026-06-03days on market $287,990 Active 118 DOM
-
2026-06-01days on market $287,990 Active 117 DOM
-
2026-05-31days on market $287,990 Active 116 DOM
ⓘ Source: listings_history table (triggers on properties + properties_extension) + one-shot
backfill from property_details.listing_events for pre-trigger history.
Climate risk First Street
- Flood 1/10 Low FEMA zone X (unshaded) · 0% chance over 30 yrs
- Wildfire 5/10 Major
- Heat 9/10 Extreme 7 d/yr ≥108°F today · 25 d/yr by 30 yrs out
- Wind 10/10 Extreme 99% chance of damaging wind over 30 yrs
- Air quality 1/10 Low 0 unhealthy d/yr today · 0 by 30 yrs out
Nearby sold comps map
Loading sold comps map…
Walkable amenities ~0.75 mi
Loading nearby amenities…
Taxation est. · year 1
- Rental income
- $25,647
- − Mortgage interest
- −$16,356
- − Property taxes
- −$4,380
- − Insurance
- −$1,460
- − Repairs & maintenance
- −$2,052
- − Management
- −$2,052
- − Depreciation
- −$8,494
- Taxable loss
- −$9,146
- Est. tax savings @ 24.0%
- +$2,195
- After-tax cash flow
- $-1,758/yr
For passive investors: Depreciation is non-cash, so a rental often shows a tax loss while cash-flowing — sheltering income. Rental losses are passive: they offset passive income freely, and up to $25,000/yr can offset ordinary (W-2) income if you actively participate and your MAGI is under $100k (phasing out to $0 by $150k); unused losses carry forward. On sale, claimed depreciation is recaptured at up to 25%, and gains may owe capital-gains tax (a 1031 exchange can defer both). Figures are a year-1 estimate at your 24.0% rate — not tax advice; consult a CPA.
Schools (NCES district)
- District
- Polk
- NCES district ID
- 1201590
- Math proficiency
- 39% ▼ -11.00%
- Reading proficiency
- 43% ▼ -4.00%
- Median HH income
- $43,979
- Composite
- 34.74/100
- National rank
- #5132
- State rank
- #62 of 73 in FL
Livability — Dundee
- Score
- 65/100
- State rank
- #638
- US rank
- #12542
Category grades
Schools grade is shown separately in the Schools card above.
Census & demographics
- Census place
- Dundee, FL
- City population
- 5,431
- Population (ZIP)
- 5,431
Population outlook (Polk County) Hauer SSP2
- Today (2025)
- 752,975 people
- By 2030
- 804,621 · +6.9%
- By 2040
- 906,117 · +20.3%
- By 2050
- 1,000,476 · +32.9%
- By 2075
- 1,197,520 · +59.0%
- By 2100
- 1,271,518 · +68.9%
Race, ethnicity, and origin ACS 2023
- Neighborhood character
- Diverse neighborhood (Simpson 0.63)
- Race & ethnicity
- Hispanic / Latino 50% White 30% Black 14% Two or more races 7% Asian 3%
- Hispanic origin (detail)
- Mexican 14% Puerto Rican 19% Dominican 6%
- Common ancestry
- Portuguese 1%
- Foreign-born
- 18% · Canada, Guatemala
- Languages at home
- 53% English-only · Spanish 47%
Political lean MEDSL · Polk
- 2024 margin
- Strong R (+20.7) · D 39.2% · R 59.9%
- 2008→2024 swing
- -14.6pp toward R · 2008: -6.1pp · 2024: -20.7pp
- All cycles
- 2024: R+20.7 2020: R+14.4 2016: R+14.1 2012: R+6.8 2008: R+6.1
Not yet ingested
- Civics
- —
Market trends
- HPI YoY
- ▲ 54.34%
- Current HPI
- 363.9764
- Rent YoY
- —
- Metro
- —
- State GDP YoY
- ▲ 3.28%
- F500 in state
- 36
Industry mix (Fortune 500 HQ in FL)
| Industry | F500 HQs | Revenue |
|---|---|---|
| Industrial Technology | 2 | $29B |
|
||
| Insurance | 2 | $17B |
|
||
| Retail | 1 | $60B |
|
||
| Technology Distribution | 1 | $58B |
|
||
| Homebuilding | 1 | $35B |
|
||
| Technology Manufacturing | 1 | $35B |
|
||
Cash-flow waterfall
monthlySold comps — $/sqft
last 12 mo · ≤1 miLoading sold comps…