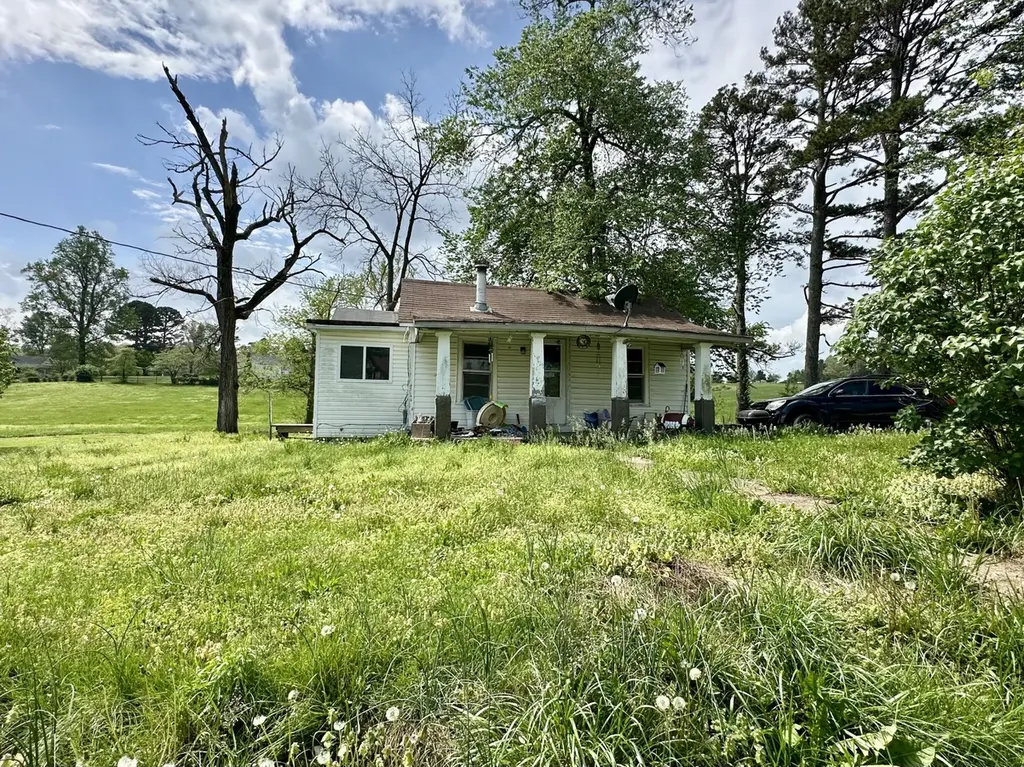
308 Pine Grove Rd · Willow Springs, MO
Flood risk No data
- FEMA flood zone
- —
- Chance of flooding over 30 yrs
- —
- Est. flood insurance / yr
- —
Fire risk No data
- Est. fire insurance / yr
- —
Heat risk No data
- Hot days now (above threshold)
- —
- Hot days in 30 yrs
- —
Wind risk No data
- Chance of severe wind over 30 yrs
- —
Air-quality risk No data
- Unhealthy air days now
- —
- Unhealthy air days in 30 yrs
- —
Risk factors via First Street. Map © Google.
Why this score? — see what drove the B- grade
The composite is a weighted blend of 9 inputs, each scored 0–100. Each bar is that input's sub-score; the figure is the points it added to the 100-point composite (weight × sub-score).
- Cash flow +30.0/30.0
- 1% rule +10.0/10.0
- DSCR +10.0/10.0
- ARV discount +7.5/15.0
- Schools +3.4/10.0
- Livability +3.1/5.0
- Rent growth +2.5/5.0
- Condition / age +2.2/5.0
- Appreciation +0.7/10.0
$45,900
🖨 Deal sheet 📄 Offer letter ✓ Due diligence
Listing remarks
Great location with a large lot and plenty of potential. This investor special would make an excellent rental property, flip opportunity, or affordable home project. Home also includes basement/storm shelter. Conveniently located with room to add value and make it your own.
Key facts
- Large lot
- 0.86 acre lot
- Built 1925
Tags
Property features AI
Exterior
- Utilities: Public sewer; Other water source
- Home design: Single-family residence; One story
- Construction: Above-grade finished area reported; Total reported living area available
- Exterior features: Property has a view; Lot about 0.86 acres
Interior
- Bathrooms: 1 full bathroom
- Heating & cooling: Has heating; Wood heating via fireplace; No central cooling
- Interior features: Wood-burning fireplace
Neighborhood map
What this means for you Summary
Snapshot
- This is a 3-bed/1.0-bath single-family listed at $46k. Condition is rated fair.
Deal economics
- At list price, monthly cash flow is $529 ($6k/yr) — positive.
- The deal already cash-flows at list — no discount required.
- Meets the 1% rule at list price ($1k rent vs $46k).
- Recommended offer: $45k (3.0% below list) — sets the bar for market timing.
- Cap rate 20.1% vs local median 3.7% in Willow Springs — top-decile yield for the area; either an underpriced asset or a hidden risk that comps aren't pricing in. Stress-test before assuming the spread holds.
Location & tenants
- Location reads 62/100 on livability (#386 in MO) — a middle-class / working-renter tenant base. Strengths: crime A+, cost of living A+; Watch: amenities F, commute F, employment F.
- Willow Springs R-IV (rural): math 34% / reading 50% proficiency, ranked #140 of 324 in MO (top 43%) — families likely to look elsewhere, expect single-tenant / working-renter base with shorter leases.
- Zoned schools: Willow Springs Elem. (math 37% / reading 42%, grade F, #537 of 1,115 statewide, top 53%, 525 students, 72% FRL); Willow Springs Middle (math 34% / reading 51%, grade D-, #140 of 391 statewide, top 38%, 369 students, 66% FRL); Willow Springs High (math 32% / reading 62%, grade D-, #155 of 521 statewide, top 32%, 387 students, 52% FRL).
- Market conditions: 80 active listings in the ZIP; 53 units permitted in Howell County in 2024 (0 in 5+ unit buildings).
Forward outlook
- Local home prices are declining (-3.0%/yr); year-one equity from $317 of loan paydown is wiped out by about $1k of value loss. Plan a longer hold.
- Howell County population projected at -18% by 2050 — secular population decline; favor cash flow + early exit over multi-decade hold.
- At projected returns (-3.0% appreciation + 3.0% rent growth), your $13k cash investment doubles in ~3 years — after that, you're playing with house money.
Negotiation context
- It's been on market 34 days — a 3% lower offer ($45k) is reasonable based on typical stale-listing flexibility.
Risks & watch-outs
- Watch-outs: built in 1925 — expect roof / HVAC / electrical / plumbing capex.
Questions for the listing agent
- It's been on market 34 days. Have you received any prior offers? Is the seller open to a 3% concession, seller financing, or rate buy-down credit?
- Have any recent inspections been done? Can we get a copy of the seller's disclosures and any deferred-maintenance estimates?
- Built in 1925 — when were the roof, HVAC, electrical panel, plumbing, and water heater last replaced?
- Is there a deadline driving the sale (1031 exchange, divorce, estate, relocation)? That informs how much negotiation room exists.
- Schools are F-rated, which usually means shorter tenancies and higher turnover. Who's the typical renter profile here, and what's been the actual vacancy rate?
- What's the average days-on-market for RENTAL listings here right now (not sales)? A rising rental-DOM trend means longer vacancies and softer asking-rent achievability than the comps imply.
- What's the recent tenant-quality profile in this submarket — average credit score on applications, eviction rate, late-payment / NSF rate, and stable-employment percentage? A property-management company in the area should have these aggregated.
- How much new for-sale + rental construction is in the pipeline within 1–3 miles? Heavy new supply typically softens prices + rents 12–24 months out; constrained supply supports both.
Investment metrics
- 1% rule
- 2.33% ✓
- Cap rate
- 20.13%
- Cash-on-cash
- 49.42%
- DSCR
- 3.20
- GRM
- 3.6
CMA / ARV
- ARV (median comp)
- $103,576
- List price
- $45,900
- Delta
- -55.68%
- Verdict
- UNDERPRICED
- Comps
- 20 within 1.0 mi
Show comp detail 6 sales within ~0.75 mi
| Address | Dist | Beds/Ba | Sqft | Sold | Price | $/sf | Match |
|---|---|---|---|---|---|---|---|
| 412 North Center St | 0.64mi | 3/1.0 | 1,260 (+5%) | 9mo | $69,900 | $55 | 54 |
| 405 S Hill St | 0.70mi | 2/1.0 (-1) | 1,119 (-6%) | 0mo | $65,000 | $58 | 52 |
| 701 N Center St | 0.73mi | 3/2.0 | 1,239 (+4%) | 14mo | $179,900 | $145 | 44 |
| 505 West 4th St | 0.37mi | 2/1.0 (-1) | 1,026 (-14%) | 16mo | $34,900 | $34 | 41 |
| 603 N Harris St | 0.74mi | 3/1.5 | 1,361 (+14%) | 22mo | $139,500 | $102 | 22 |
| 708 Corn Ave | 0.66mi | 2/2.0 (-1) | 1,045 (-13%) | 22mo | $29,000 | $28 | 21 |
Match score weights: distance 35% · size 25% · config 20% · recency 20%. Top-matched comps best support the ARV.
Projected returns pro-forma
-3.0% appreciation · 3.0% rent growth · sell at horizon
- IRR
- 47.1%
- Equity multiple
- 3.05×
- Total profit
- $26,286
- Equity at exit
- $6,844
- IRR
- 52.8%
- Equity multiple
- 6.16×
- Total profit
- $66,359
- Equity at exit
- $3,969
Cash invested: $12,852 (down + closing). Projections, not guarantees.
Landlord ↔ Tenant lean methodology
- Overall (STATE)
- 81 Strongly Landlord-Friendly
- State Missouri
- 81 Strongly Landlord-Friendly · R+10
- County
- — inherits STATE
- City
- — inherits STATE
ZIP-level market 65793
- Home prices YoY
- -3.8%
- Active inventory
- 80
- Price-to-rent
- 3.6×
Monthly cashflow live
- Estimated rent
- $1,071 medium interval (Pro) →
- Mortgage (P&I)
- −$241
- Tax est. 1.5%
- −$57 /mo · $688/yr
- Insurance
- −$19
- HOA
- −$0
- Vacancy / Maint / Mgmt
- −$225
- Net cashflow
- $529
Break-even live
UW: 25.0% down · 7.5% · 30yr · 1.5% tax · 5.0% vac · 8.0% maint · 8.0% mgmt
Financing live
Cash to close
- Down payment
- $11,475
- Closing costs
- $1,377
- Reserves months
- —
- Total cash needed
- —
Loan-product check · same deal, 3 products live
Conventional
25% down · 7.5% · 30yr
- Down + closing
- —
- Monthly P&I
- —
- Monthly cashflow
- —
- DSCR
- —
- Eligible?
- —
Personal DTI + credit; lowest rate.
DSCR
20% down · 8.5% · 30yr
- Down + closing
- —
- Monthly P&I
- —
- Monthly cashflow
- —
- DSCR
- —
- Eligible?
- —
No personal income docs; deal must DSCR.
Hard money
10% down · 12.0% · 12mo
- Down + closing
- —
- Monthly P&I
- —
- Monthly cashflow
- —
- DSCR
- —
- Eligible?
- —
Short-term bridge; refi at stabilization.
Listing history 15 events
-
2026-06-18days on market $45,900 Active 34 DOM
-
2026-06-17days on market $45,900 Active 33 DOM
-
2026-06-16days on market $45,900 Active 32 DOM
-
2026-06-15days on market $45,900 Active 31 DOM
-
2026-06-13days on market $45,900 Active 29 DOM
-
2026-06-12days on market $45,900 Active 28 DOM
-
2026-06-09days on market $45,900 Active 25 DOM
-
2026-06-08days on market $45,900 Active 24 DOM
-
2026-06-07days on market $45,900 Active 23 DOM
-
2026-06-07days on market $45,900 Active 22 DOM
-
2026-06-04days on market $45,900 Active 19 DOM
-
2026-06-02days on market $45,900 Active 18 DOM
-
2026-06-01days on market $45,900 Active 17 DOM
-
2026-05-31days on market $45,900 Active 16 DOM
-
2026-05-15$45,900 Active 274-char remark
ⓘ Source: listings_history table (triggers on properties + properties_extension) + one-shot
backfill from property_details.listing_events for pre-trigger history.
Nearby sold comps map
Loading sold comps map…
Walkable amenities ~0.75 mi
Loading nearby amenities…
Taxation est. · year 1
- Rental income
- $12,857
- − Mortgage interest
- −$2,571
- − Property taxes
- −$688
- − Insurance
- −$230
- − Repairs & maintenance
- −$1,029
- − Management
- −$1,029
- − Depreciation
- −$1,335
- Taxable income
- $5,976
- Est. tax owed @ 24.0%
- −$1,434
- After-tax cash flow
- $4,917/yr
For passive investors: Depreciation is non-cash, so a rental often shows a tax loss while cash-flowing — sheltering income. Rental losses are passive: they offset passive income freely, and up to $25,000/yr can offset ordinary (W-2) income if you actively participate and your MAGI is under $100k (phasing out to $0 by $150k); unused losses carry forward. On sale, claimed depreciation is recaptured at up to 25%, and gains may owe capital-gains tax (a 1031 exchange can defer both). Figures are a year-1 estimate at your 24.0% rate — not tax advice; consult a CPA.
Condition & rehab AI · 4 photos
The home requires moderate repairs and maintenance, including exterior siding repair, landscaping, and kitchen cleaning. Improvements in these areas can significantly increase its resale and rental value.
Repairs flagged
- Moderate exterior siding — The siding is weathered and in need of repair.
- Moderate landscaping — The overgrown grass and weeds need trimming and maintenance.
- Minor kitchen cleaning — The kitchen is cluttered and needs cleaning to improve appearance.
Value-add opportunities
- Both landscaping and exterior painting — Improving the landscaping and painting the exterior can enhance curb appeal and increase both resale and rental value.
- Resale kitchen cleaning and organization — A clean and organized kitchen can attract more buyers and increase the home's appeal for resale.
Renovation cost estimate screening
| Repair item | Severity | Est. cost |
|---|---|---|
| exterior siding · The siding is weathered and in need of repair. | Moderate | $3,000–15,000 |
| landscaping · The overgrown grass and weeds need trimming and maintenance. | Moderate | $3,000–15,000 |
| kitchen cleaning · The kitchen is cluttered and needs cleaning to improve appearance. | Minor | $500–3,000 |
| Total estimated repair cost · 3 items | $6,500–33,000 |
Value-add ROI direction
- Both landscaping and exterior painting — Improving the landscaping and painting the exterior can enhance curb appeal and increase both resale and rental value. ↑
- Resale kitchen cleaning and organization — A clean and organized kitchen can attract more buyers and increase the home's appeal for resale. ↑
ⓘ Cost ranges are severity-bucket heuristics (US national rule-of-thumb). Get contractor quotes + a written scope before underwriting a rehab budget.
Schools (NCES district)
- District
- Willow Springs R-IV
- NCES district ID
- 2932070
- Math proficiency
- 34% ▲ 2.00%
- Reading proficiency
- 50% ▲ 2.00%
- Median HH income
- $32,334
- Composite
- 34.4/100
- National rank
- #5207
- State rank
- #140 of 324 in MO
Livability — Willow Springs
- Score
- 62/100
- State rank
- #386
- US rank
- #16837
Category grades
Schools grade is shown separately in the Schools card above.
Census & demographics
- Census place
- Willow Springs, MO
- City population
- 5,679
- Population (ZIP)
- 5,679
Population outlook (Howell County) Hauer SSP2
- Today (2025)
- 38,462 people
- By 2030
- 37,240 · -3.2%
- By 2040
- 34,495 · -10.3%
- By 2050
- 31,450 · -18.2%
- By 2075
- 23,660 · -38.5%
- By 2100
- 16,373 · -57.4%
Race, ethnicity, and origin ACS 2023
- Neighborhood character
- Predominantly White (89%)
- Race & ethnicity
- White 89% Two or more races 8% Hispanic / Latino 4%
- Common ancestry
- Romanian 2% Serbian 2% Slovak 1%
- Foreign-born
- 2%
- Languages at home
- 97% English-only · French/Haitian/Cajun 1% Spanish 1%
Political lean MEDSL · Howell
- 2024 margin
- Solid R (+66.8) · D 16.2% · R 83.0%
- 2008→2024 swing
- -36.0pp toward R · 2008: -30.8pp · 2024: -66.8pp
- All cycles
- 2024: R+66.8 2020: R+64.2 2016: R+63.2 2012: R+43.8 2008: R+30.8
Not yet ingested
- Civics
- —
Market trends
- HPI YoY
- ▼ -8.63%
- Current HPI
- 220.7596
- Rent YoY
- —
- Metro
- —
- State GDP YoY
- ▲ 1.84%
- F500 in state
- 20
Industry mix (Fortune 500 HQ in MO)
| Industry | F500 HQs | Revenue |
|---|---|---|
| Healthcare | 1 | $163B |
|
||
| Insurance | 1 | $21B |
|
||
| Industrial Technology | 1 | $17B |
|
||
| Retail | 1 | $16B |
|
||
| Industrial Distribution | 1 | $10B |
|
||
| Utilities | 1 | $9B |
|
||
Price history
1 event — show timeline
- 2026-05-15 Listed $45,900 SOMO
Cash-flow waterfall
monthlySold comps — $/sqft
last 12 mo · ≤1 miLoading sold comps…