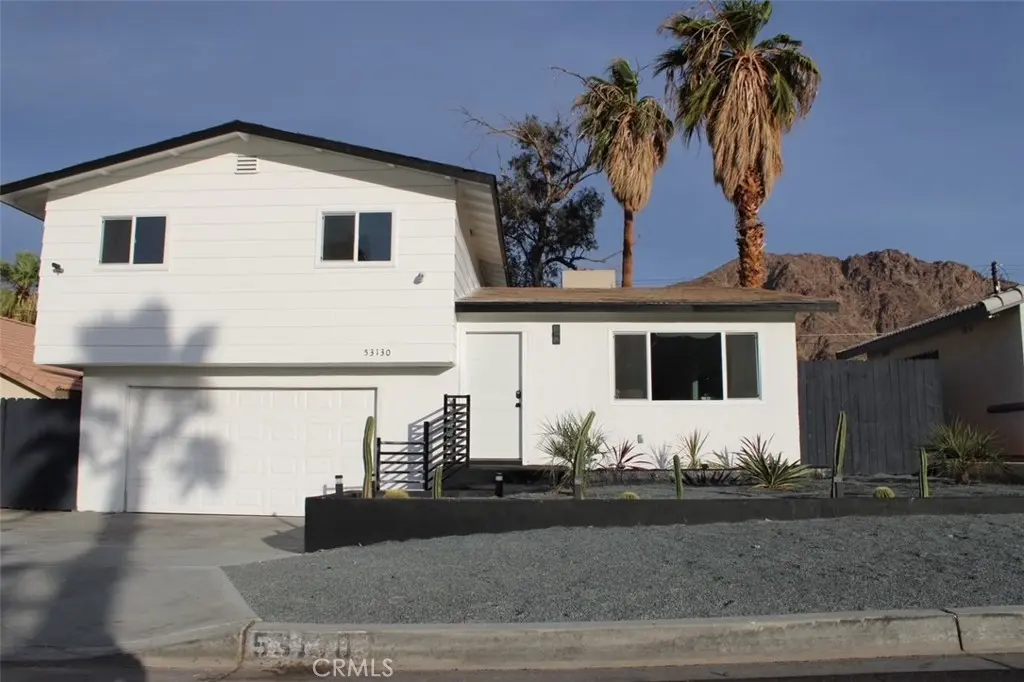
53130 Avenida Mendoza · La Quinta, CA
Flood risk 1/10 · Minimal
- FEMA flood zone
- X
- Chance of flooding over 30 yrs
- 0.0%
- Est. flood insurance / yr
- $507 – $1,088
Fire risk 6/10 · Moderate
- Est. fire insurance / yr
- $659 – $1,223
Heat risk 10/10 · Severe
- Hot days now (above 114°F)
- 7 days/yr
- Hot days in 30 yrs
- 20 days/yr
Wind risk 1/10 · Minimal
- Chance of severe wind over 30 yrs
- —
Air-quality risk 4/10 · Minor
- Unhealthy air days now
- 4 days/yr
- Unhealthy air days in 30 yrs
- 5 days/yr
Risk factors via First Street. Map © Google.
Why this score? — see what drove the D grade
The composite is a weighted blend of 9 inputs, each scored 0–100. Each bar is that input's sub-score; the figure is the points it added to the 100-point composite (weight × sub-score).
- Cash flow +12.5/30.0
- ARV discount +9.8/15.0
- Rent growth +4.1/5.0
- Schools +3.8/10.0
- DSCR +3.7/10.0
- 1% rule +3.1/10.0
- Livability +2.9/5.0
- Condition / age +2.5/5.0
- Appreciation +0.0/10.0
$519,999
🖨 Deal sheet (PDF) 📄 Offer letter ✓ Due diligence
Listing remarks MLS
Stunning Mountain View home! This home has everything you could possibly want for a vacation home or primary home. The residence is located in La Quinta Mid Cove, 3BR/3BA 1,768 square feet incredible mountain views Master bedroom with its own privet bathroom. This Home is fully remodeled from top to bottom with top-of-the-line Stainless steel appliances and an Amazing Gazebo to entertain all of your guest. The residence is Conveniently located within driving distance to the Empire Polo Club, Indian Wells Tennis Garden, Coachella Festival and spectacular hiking trails surrounded by preserved natural beauty.
Key facts
- Fully remodeled
- Amazing gazebo
- Private bathroom
Tags
Neighborhood map
What this means for you Summary
Snapshot
- This is a 3-bed/2.5-bath single-family listed at $520k.
Deal economics
- At list price, monthly cash flow is $-74 ($-887/yr) — negative.
- To cash-flow at today's rent, offer at most $507k (2.5% below list).
- To meet the 1% rule (rent ≥ 1% of price), the offer needs to be $421k (19.1% below list).
- Recommended offer: $421k (19.1% below list) — sets the bar for 1% rule.
- Cap rate 6.1% vs local median 3.3% in La Quinta — top-decile yield for the area; either an underpriced asset or a hidden risk that comps aren't pricing in. Stress-test before assuming the spread holds.
Location & tenants
- Location reads 58/100 on livability (#694 in CA) — a working-class tenant base; expect higher turnover. Strengths: commute A-, employment B+, housing B+; Watch: amenities F, cost of living F, health & safety F.
- Desert Sands Unified (suburban): math 31% / reading 56% proficiency, ranked #199 of 517 in CA (top 38%) — families likely to look elsewhere, expect single-tenant / working-renter base with shorter leases.
- Zoned schools: La Quinta Middle (math 24% / reading 24%, grade F, #277 of 498 statewide, top 73%, 754 students, 83% FRL); La Quinta High (math 31% / reading 65%, grade D, #380 of 1,170 statewide, top 33%, 2,500 students, 74% FRL) — zoned schools average 78% FRL vs 56% district-wide (22 pts higher); higher-poverty schools than district average — tighter screening recommended.
- Market conditions: Rents rising fast (+6.5%/yr); 660 active listings in the ZIP; 40 comparable units currently listed for rent nearby; rentals lingering (median 46d on market — plan ~5-8 weeks vacancy on turnover, expect pricing pressure); 60% of comp listings sitting > 30 days — soft ceiling on asking rent; solid renter incomes; 9,195 units permitted in Riverside County in 2024 (1,512 in 5+ unit buildings).
- At $4,208/mo this rent would consume 51% of the median local household income ($99k/yr) (locally 1078% of renters already pay >50% of income on rent) — very limited rent-growth headroom before tenants either downsize or default.
Forward outlook
- Local home prices are declining (-3.0%/yr); year-one equity from $4k of loan paydown is wiped out by about $16k of value loss. Plan a longer hold.
- Riverside County population projected at +22% by 2050 — long-run rental-demand tailwind backs the buy-and-hold thesis.
Negotiation context
- It's been on market 206 days — a 12% lower offer ($458k) is reasonable based on typical stale-listing flexibility.
- 9 sale attempts since 24y ago with the ask held roughly flat each time — persistent listings suggest the price (not the market) is what's stuck; bring a comps-based counter.
- Current owner paid $380k; 37% above their basis — modest negotiation headroom, anchor on the comps not their cost.
Risks & watch-outs
- Climate carrying-cost: major wildfire risk; extreme-heat days projected 7→20/yr by 2055 (HVAC capex compounding) — expect insurance premiums to compound above CPI over the hold.
Questions for the listing agent
- What do current leases actually rent for vs. the listed asking? Can we see a recent rent roll and the last 12 months of T-12 income?
- It's been on market 206 days. Have you received any prior offers? Is the seller open to a 19% concession, seller financing, or rate buy-down credit?
- Built in 1973 — when were the roof, HVAC, electrical panel, plumbing, and water heater last replaced?
- Why hasn't it sold? Are there any deal-killer items the seller is aware of (foundation, flood, title, zoning, code violations)?
- Is there a deadline driving the sale (1031 exchange, divorce, estate, relocation)? That informs how much negotiation room exists.
- Schools are D-rated, which usually means shorter tenancies and higher turnover. Who's the typical renter profile here, and what's been the actual vacancy rate?
- The area grade is low — what's the realistic commute time and amenity access for the typical tenant pool here? Any planned neighborhood developments (good or bad) we should know about?
- What's the average days-on-market for RENTAL listings here right now (not sales)? A rising rental-DOM trend means longer vacancies and softer asking-rent achievability than the comps imply.
- What's the recent tenant-quality profile in this submarket — average credit score on applications, eviction rate, late-payment / NSF rate, and stable-employment percentage? A property-management company in the area should have these aggregated.
- How much new for-sale + rental construction is in the pipeline within 1–3 miles? Heavy new supply typically softens prices + rents 12–24 months out; constrained supply supports both.
Investment metrics
- 1% rule
- 0.81% ✗
- Cap rate
- 6.12%
- Cash-on-cash
- -0.61%
- DSCR
- 0.97
- GRM
- 10.3
CMA / ARV
- ARV (median comp)
- $548,279
- List price
- $519,999
- Delta
- -5.16%
- Verdict
- FAIR
- Comps
- 20 within 1.0 mi
Show comp detail 12 sales within ~0.75 mi
| Address | Dist | Beds/Ba | Sqft | Sold | Price | $/sf | Match |
|---|---|---|---|---|---|---|---|
| 53060 Avenida Juarez | 0.60mi | 3/2.0 | 1,760 (-0%) | 2mo | $830,000 | $472 | 68 |
| 53600 Avenida Diaz | 0.59mi | 3/2.0 | 1,704 (-4%) | 2mo | $567,500 | $333 | 63 |
| 54065 Avenida Vallejo | 0.54mi | 3/2.5 | 1,647 (-7%) | 1mo | $589,000 | $358 | 62 |
| 52525 Avenida Bermudas | 0.34mi | 3/2.0 | 1,961 (+11%) | 2mo | $560,000 | $286 | 62 |
| 52085 Avenida Herrera | 0.59mi | 3/2.0 | 1,654 (-6%) | 0mo | $580,000 | $351 | 60 |
| 77405 Calle Sonora | 0.63mi | 3/2.0 | 1,652 (-7%) | 1mo | $660,000 | $400 | 57 |
| 53210 Avenida Madero | 0.64mi | 3/2.0 | 1,665 (-6%) | 2mo | $565,000 | $339 | 57 |
| 51885 Avenida Bermudas | 0.65mi | 3/2.0 | 1,656 (-6%) | 2mo | $535,000 | $323 | 56 |
| 53770 Avenida Obregon | 0.52mi | 4/3.0 (+1) | 1,622 (-8%) | 1mo | $640,000 | $395 | 54 |
| 52740 Avenida Alvarado | 0.49mi | 3/2.0 | 1,514 (-14%) | 2mo | $335,000 | $221 | 50 |
| 52725 Avenue Alvarado | 0.52mi | 3/2.0 | 1,529 (-14%) | 3mo | $499,000 | $326 | 49 |
| 53840 Avenida Carranza | 0.51mi | 4/3.0 (+1) | 2,000 (+13%) | 0mo | $659,000 | $330 | 47 |
Match score weights: distance 35% · size 25% · config 20% · recency 20%. Top-matched comps best support the ARV.
Projected returns pro-forma
-3.0% appreciation · 6.45% rent growth · sell at horizon
- IRR
- -13.7%
- Equity multiple
- 0.49×
- Total profit
- $-73,913
- Equity at exit
- $77,534
- IRR
- -0.4%
- Equity multiple
- 0.97×
- Total profit
- $-4,072
- Equity at exit
- $44,960
Cash invested: $145,600 (down + closing). Projections, not guarantees.
Landlord ↔ Tenant lean methodology
- Overall (STATE)
- 18 Strongly Tenant-Friendly
- State California
- 18 Strongly Tenant-Friendly · D+13
- County
- — inherits STATE
- City
- — inherits STATE
ZIP-level market 92253
- Rents YoY
- 6.5%
- Active inventory
- 660
- Price-to-rent
- 10.3×
Monthly cashflow live
- Estimated rent
- $4,208 high interval (Pro) →
- Mortgage (P&I)
- −$2,727
- Tax from tax record
- −$455 /mo · $5,458/yr
- Insurance
- −$217
- HOA
- −$0
- Vacancy / Maint / Mgmt
- −$884
- Net cashflow
- $-74
Break-even live
Sensitivity live
| Price | -10% $220 | -5% $73 | +0% $-74 | +5% $-221 | +10% $-368 |
|---|---|---|---|---|---|
| Rent | -10% $-406 | -5% $-240 | +0% $-74 | +5% $92 | +10% $259 |
| Rate | -1.0pp $188 | -0.5pp $58 | base $-74 | +0.5pp $-209 | +1.0pp $-346 |
UW: 25.0% down · 7.5% · 30yr · 1.5% tax · 5.0% vac · 8.0% maint · 8.0% mgmt
Financing live
Cash to close
- Down payment
- $130,000
- Closing costs
- $15,600
- Reserves months
- —
- Total cash needed
- —
Loan-product check · same deal, 3 products live
Conventional
25% down · 7.5% · 30yr
- Down + closing
- —
- Monthly P&I
- —
- Monthly cashflow
- —
- DSCR
- —
- Eligible?
- —
Personal DTI + credit; lowest rate.
DSCR
20% down · 8.5% · 30yr
- Down + closing
- —
- Monthly P&I
- —
- Monthly cashflow
- —
- DSCR
- —
- Eligible?
- —
No personal income docs; deal must DSCR.
Hard money
10% down · 12.0% · 12mo
- Down + closing
- —
- Monthly P&I
- —
- Monthly cashflow
- —
- DSCR
- —
- Eligible?
- —
Short-term bridge; refi at stabilization.
Rent comps 40 comps
| Address | Beds | Baths | Sqft | Rent | $/sqft | DOM | Units | Dist |
|---|---|---|---|---|---|---|---|---|
| 53385 Avenida Mendoza La Quinta, CA | 3.0 | 2.5 | 1942 | $3,900 | $2.01 | 45d | 1 | 0.10mi |
| 53220 Avenida Navarro La Quinta, CA | 3.0 | 2.0 | 1808 | $5,250 | $2.90 | 45d | 1 | 0.10mi |
| 53440 Avenida Villa La Quinta, CA | 3.0 | 2.0 | 2045 | $3,500 | $1.71 | 45d | 1 | 0.14mi |
| 53390 Avenida Navarro La Quinta, CA | 3.0 | 2.0 | 1701 | $4,500 | $2.65 | 7d | 1 | 0.14mi |
| 53390 Avenida Navarro La Quinta, CA | 3.0 | 2.0 | 1701 | $4,500 | $2.65 | 45d | 1 | 0.14mi |
| 53445 Eisenhower Dr La Quinta, CA | 3.0 | 2.0 | 1797 | $3,900 | $2.17 | 45d | 1 | 0.19mi |
| 53420 Avenida Velasco La Quinta, CA | 3.0 | 2.0 | 1532 | $4,000 | $2.61 | 45d | 1 | 0.19mi |
| 52637 Avenida Villa La Quinta, CA | 4.0 | 2.0 | 1410 | $6,000 | $4.26 | 45d | 1 | 0.28mi |
| 53740 Avenida Navarro La Quinta, CA | 3.0 | 3.0 | 1664 | $3,350 | $2.01 | 26d | 1 | 0.28mi |
| 53805 Avenida Martinez La Quinta, CA | 3.0 | 2.0 | 1412 | $2,495 | $1.77 | 7d | 1 | 0.32mi |
| 53805 Avenida Martinez La Quinta, CA | 3.0 | 2.0 | 1412 | $2,495 | $1.77 | 24d | 1 | 0.32mi |
| 53665 Avenida Vallejo La Quinta, CA | 3.0 | 2.0 | 1248 | $2,600 | $2.08 | 26d | 1 | 0.37mi |
| 53980 Avenida Mendoza La Quinta, CA | 3.0 | 2.0 | 1650 | $4,800 | $2.91 | 45d | 1 | 0.39mi |
| 53980 Avenida Mendoza La Quinta, CA | 3.0 | 2.0 | 1404 | $3,500 | $2.49 | 1d | 1 | 0.39mi |
| 53655 Avenida Ramirez La Quinta, CA | 3.0 | 2.0 | 1378 | $3,500 | $2.54 | 45d | 1 | 0.40mi |
| 54052 Avenida Martinez La Quinta, CA | 3.0 | 2.0 | 1849 | $3,600 | $1.95 | 7d | 1 | 0.43mi |
| 52955 Avenida Obregon La Quinta, CA | 4.0 | 2.5 | 1883 | $3,600 | $1.91 | 45d | 1 | 0.45mi |
| 53860 Avenida Ramirez La Quinta, CA | 4.0 | 5.0 | 1779 | $5,500 | $3.09 | 45d | 1 | 0.46mi |
| 54195 Avenida Martinez La Quinta, CA | 3.0 | 2.0 | 1714 | $3,150 | $1.84 | 45d | 1 | 0.49mi |
| 52221 Avenida Villa La Quinta, CA | 4.0 | 4.0 | 1676 | $2,850 | $1.70 | 26d | 1 | 0.50mi |
| 53170 Avenida Diaz La Quinta, CA | 3.0 | 2.0 | 1724 | $3,500 | $2.03 | 3d | 1 | 0.55mi |
| 52395 Avenida Carranza La Quinta, CA | 3.0 | 2.0 | 1272 | $2,500 | $1.97 | 45d | 1 | 0.57mi |
| 53167 Avenida Diaz La Quinta, CA | 3.0 | 2.0 | 1920 | $6,000 | $3.12 | 45d | 1 | 0.58mi |
| 53360 Avenida Juarez La Quinta, CA | 3.0 | 2.0 | 1621 | $2,900 | $1.79 | 7d | 1 | 0.60mi |
| 53875 Avenida Rubio La Quinta, CA | 3.0 | 2.5 | 1962 | $6,000 | $3.06 | 45d | 1 | 0.64mi |
| 52225 Avenida Obregon La Quinta, CA | 3.0 | 2.0 | 1611 | $5,200 | $3.23 | 45d | 1 | 0.64mi |
| 52228 Avenida Obregon La Quinta, CA | 2.0 | 2.0 | 1350 | $3,350 | $2.48 | 45d | 1 | 0.65mi |
| 53755 Avenida Diaz La Quinta, CA | 3.0 | 2.0 | 1325 | $3,085 | $2.33 | 26d | 1 | 0.65mi |
| 52680 Avenida Juarez La Quinta, CA | 3.0 | 2.0 | 1440 | $3,500 | $2.43 | 45d | 1 | 0.65mi |
| 77755 Calle Temecula La Quinta, CA | 3.0 | 2.0 | 2304 | $5,000 | $2.17 | 45d | 1 | 0.67mi |
| 53720 Avenida Madero La Quinta, CA | 3.0 | 2.5 | 1725 | $9,000 | $5.22 | 45d | 1 | 0.70mi |
| 54270 Avenida Alvarado La Quinta, CA | 2.0 | 2.0 | 1454 | $5,000 | $3.44 | 45d | 1 | 0.70mi |
| 52420 Avenida Juarez La Quinta, CA | 3.0 | 2.0 | 1424 | $3,700 | $2.60 | 26d | 1 | 0.71mi |
| 51850 Avenida Vallejo La Quinta, CA | 3.0 | 2.0 | 1233 | $2,895 | $2.35 | 21d | 1 | 0.72mi |
| 54605 Avenida Vallejo La Quinta, CA | 3.0 | 2.0 | 1771 | $6,500 | $3.67 | 7d | 1 | 0.76mi |
| 54605 Avenida Vallejo La Quinta, CA | 3.0 | 2.0 | 1771 | $6,500 | $3.67 | 45d | 1 | 0.76mi |
| 54560 Avenida Carranza La Quinta, CA | 3.0 | 2.0 | 1517 | $2,625 | $1.73 | 20d | 1 | 0.77mi |
| 52123 Avenida Diaz La Quinta, CA | 3.0 | 3.0 | 1761 | $5,500 | $3.12 | 45d | 1 | 0.79mi |
| 54277 Avenida Diaz La Quinta, CA | 3.0 | 2.0 | 1861 | $3,500 | $1.88 | 45d | 1 | 0.80mi |
| 51685 Avenida Herrera La Quinta, CA | 3.0 | 2.0 | 1320 | $2,875 | $2.18 | 26d | 1 | 0.80mi |
Listing history 48 events
-
2026-06-21days on market $519,999 Active 206 DOM
-
2026-06-18days on market $519,999 Active 203 DOM
-
2026-06-17days on market $519,999 Active 202 DOM
-
2026-06-16days on market $519,999 Active 201 DOM
-
2026-06-15days on market $519,999 Active 200 DOM
-
2026-06-13days on market $519,999 Active 198 DOM
-
2026-06-09days on market $519,999 Active 194 DOM
-
2026-06-08days on market $519,999 Active 193 DOM
-
2026-06-07days on market $519,999 Active 192 DOM
-
2026-06-04days on market $519,999 Active 189 DOM
-
2026-06-03days on market $519,999 Active 188 DOM
-
2026-06-02days on market $519,999 Active 187 DOM
-
2026-06-01days on market $519,999 Active 186 DOM
-
2026-05-31days on market $519,999 Active 185 DOM
-
2026-05-07status Active 613-char remark
Show marketing remark (613 chars)
Stunning Mountain View home! This home has everything you could possibly want for a vacation home or primary home. The residence is located in La Quinta Mid Cove, 3BR/3BA 1,768 square feet incredible mountain views Master bedroom with its own privet bathroom. This Home is fully remodeled from top to bottom with top-of-the-line Stainless steel appliances and an Amazing Gazebo to entertain all of your guest. The residence is Conveniently located within driving distance to the Empire Polo Club, Indian Wells Tennis Garden, Coachella Festival and spectacular hiking trails surrounded by preserved natural beauty.
-
2026-04-30historical 613-char remark
Show marketing remark (613 chars)
Stunning Mountain View home! This home has everything you could possibly want for a vacation home or primary home. The residence is located in La Quinta Mid Cove, 3BR/3BA 1,768 square feet incredible mountain views Master bedroom with its own privet bathroom. This Home is fully remodeled from top to bottom with top-of-the-line Stainless steel appliances and an Amazing Gazebo to entertain all of your guest. The residence is Conveniently located within driving distance to the Empire Polo Club, Indian Wells Tennis Garden, Coachella Festival and spectacular hiking trails surrounded by preserved natural beauty.
-
2025-11-21$519,999 Active 613-char remark
Show marketing remark (613 chars)
Stunning Mountain View home! This home has everything you could possibly want for a vacation home or primary home. The residence is located in La Quinta Mid Cove, 3BR/3BA 1,768 square feet incredible mountain views Master bedroom with its own privet bathroom. This Home is fully remodeled from top to bottom with top-of-the-line Stainless steel appliances and an Amazing Gazebo to entertain all of your guest. The residence is Conveniently located within driving distance to the Empire Polo Club, Indian Wells Tennis Garden, Coachella Festival and spectacular hiking trails surrounded by preserved natural beauty.
-
2025-05-01historical
-
2025-03-21price $568,900
-
2025-02-28price $579,900
-
2025-02-13$599,900 Active
-
2024-10-01soldstatus $380,000 Closed
-
2024-09-30soldstatus $380,000
-
2024-08-29status Pending
-
2024-06-18$395,000 Active
-
2021-10-20soldstatus $13,819,091
-
2013-09-30soldstatus $184,900 Closed
-
2013-09-30soldstatus $185,000
-
2013-09-05status Backup Offers Accepted
-
2013-08-30price $184,900
-
2013-07-25price $199,900
-
2013-07-04$205,000 Active
-
2010-03-19soldstatus $115,000 Closed
-
2010-01-25historical
-
2010-01-11price $109,900
-
2009-12-14$120,000 Active
-
2005-08-19soldstatus $346,000
-
2004-08-04soldstatus $209,000
-
2004-03-10soldstatus $178,500
-
2003-08-31historical
-
2003-08-02$254,500
-
2003-03-19soldstatus $185,000
-
2002-09-12historical
-
2002-09-10$220,500
-
2002-03-25soldstatus $115,000
-
2002-03-11historical
-
2002-02-04$118,000
-
1991-04-22soldstatus $88,500
ⓘ Source: listings_history table (triggers on properties + properties_extension) + one-shot
backfill from property_details.listing_events for pre-trigger history.
Tax reassessment forecast CA · Resets to sale price
- Current annual tax
- $5,458 · $455/mo
- Projected year-2 tax
- $5,458 · $455/mo
- Expected delta
- $0/yr ($0/mo · 0.0%)
ⓘ Screening estimate from a state-policy table — verify with the county assessor before closing.
Climate risk First Street
- Flood 1/10 Low FEMA zone X · 0% chance over 30 yrs
- Wildfire 6/10 Major
- Heat 10/10 Extreme 7 d/yr ≥114°F today · 20 d/yr by 30 yrs out
- Wind 1/10 Low
- Air quality 4/10 Moderate 4 unhealthy d/yr today · 5 by 30 yrs out
Nearby sold comps map
Loading sold comps map…
Walkable amenities ~0.75 mi
Loading nearby amenities…
Taxation est. · year 1
- Rental income
- $50,499
- − Mortgage interest
- −$29,128
- − Property taxes
- −$5,458
- − Insurance
- −$2,600
- − Repairs & maintenance
- −$4,040
- − Management
- −$4,040
- − Depreciation
- −$15,127
- Taxable loss
- −$9,894
- Est. tax savings @ 24.0%
- +$2,375
- After-tax cash flow
- $1,488/yr
For passive investors: Depreciation is non-cash, so a rental often shows a tax loss while cash-flowing — sheltering income. Rental losses are passive: they offset passive income freely, and up to $25,000/yr can offset ordinary (W-2) income if you actively participate and your MAGI is under $100k (phasing out to $0 by $150k); unused losses carry forward. On sale, claimed depreciation is recaptured at up to 25%, and gains may owe capital-gains tax (a 1031 exchange can defer both). Figures are a year-1 estimate at your 24.0% rate — not tax advice; consult a CPA.
Schools (NCES district)
- District
- Desert Sands Unified
- NCES district ID
- 0611110
- Math proficiency
- 31% ▼ -4.00%
- Reading proficiency
- 56% ▲ 7.00%
- Median HH income
- $54,957
- Composite
- 37.77/100
- National rank
- #4346
- State rank
- #199 of 517 in CA
Livability — La Quinta
- Score
- 58/100
- State rank
- #694
- US rank
- #21080
Category grades
Schools grade is shown separately in the Schools card above.
Census & demographics
- Census place
- La Quinta, CA
- County
- Riverside County · 2,287,001 people
- City population
- 38,666
- Metro
- Riverside-San Bernardino-Ontario, CA
- Population (ZIP)
- 38,666
- Household income
- $99,277
- Rent vs Own
- Severe rent burden
- 1078.0
Population outlook (Riverside County) Hauer SSP2
- Today (2025)
- 2,664,475 people
- By 2030
- 2,802,692 · +5.2%
- By 2040
- 3,050,904 · +14.5%
- By 2050
- 3,256,783 · +22.2%
- By 2075
- 3,655,058 · +37.2%
- By 2100
- 3,766,594 · +41.4%
Race, ethnicity, and origin ACS 2023
- Neighborhood character
- Diverse neighborhood (Simpson 0.57)
- Race & ethnicity
- White 54% Hispanic / Latino 37% Two or more races 19% Asian 4% Native American 1% Black 1%
- Hispanic origin (detail)
- Mexican 34%
- Common ancestry
- Romanian 2% Lithuanian 2% Slovak 1%
- Foreign-born
- 15% · Canada, China, Vietnam
- Languages at home
- 71% English-only · Spanish 24% Tagalog/Filipino 1% Chinese 1%
Political lean MEDSL · Riverside
- 2024 margin
- Toss-up / Even · D 48.0% · R 49.3% · Other 2.6%
- 2008→2024 swing
- -3.6pp toward R · 2008: 2.3pp · 2024: -1.3pp
- All cycles
- 2024: R+1.3 2020: D+8.0 2016: D+4.3 2012: R+0.4 2008: D+2.3
Not yet ingested
- Civics
- —
Market trends
- HPI YoY
- ▼ -263.65%
- Current HPI
- 281.8665
- Rent YoY
- ▲ 6.45%
- Metro
- Riverside-San Bernardino-Ontario, CA
- State GDP YoY
- ▲ 3.21%
- F500 in state
- 116
Industry mix (Fortune 500 HQ in CA)
| Industry | F500 HQs | Revenue |
|---|---|---|
| Technology | 27 | $1,492B |
|
||
| Financial Services | 3 | $174B |
|
||
| Retail | 3 | $44B |
|
||
| Insurance | 3 | $26B |
|
||
| Media / Entertainment | 2 | $115B |
|
||
| Pharmaceuticals / Biotech | 2 | $62B |
|
||
Price history
+487.6% since first listed34 events — show timeline
- 2026-05-07 Relisted — CRMLS
- 2026-04-30 Listing Removed — CRMLS
- 2025-11-21 Listed $519,999 CRMLS
- 2025-05-01 Listing Removed — CRMLS
- 2025-03-21 Price Changed $568,900 CRMLS
- 2025-02-28 Price Changed $579,900 CRMLS
- 2025-02-13 Listed $599,900 CRMLS
- 2024-10-01 Sold (MLS) $380,000 GPSMLS
- 2024-09-30 Sold (Public Records) $380,000 Public Records
- 2024-08-29 Pending — GPSMLS
- 2024-06-18 Listed $395,000 GPSMLS
- 2021-10-20 Sold (Public Records) $13,819,091 Public Records
- 2013-09-30 Sold (Public Records) $185,000 Public Records
- 2013-09-30 Sold (MLS) $184,900 GPSMLS
- 2013-09-05 Pending — GPSMLS
- 2013-08-30 Price Changed $184,900 GPSMLS
- 2013-07-25 Price Changed $199,900 GPSMLS
- 2013-07-04 Listed $205,000 GPSMLS
- 2010-03-19 Sold (MLS) $115,000 GPSMLS
- 2010-01-25 Listing Removed — GPSMLS
- 2010-01-11 Price Changed $109,900 GPSMLS
- 2009-12-14 Listed $120,000 GPSMLS
- 2005-08-19 Sold (Public Records) $346,000 Public Records
- 2004-08-04 Sold (Public Records) $209,000 Public Records
- 2004-03-10 Sold (Public Records) $178,500 Public Records
- 2003-08-31 Listing Removed — GPSMLS
- 2003-08-02 Listed $254,500 GPSMLS
- 2003-03-19 Sold (Public Records) $185,000 Public Records
- 2002-09-12 Listing Removed — GPSMLS
- 2002-09-10 Listed $220,500 GPSMLS
- 2002-03-25 Sold (Public Records) $115,000 Public Records
- 2002-03-11 Listing Removed — GPSMLS
- 2002-02-04 Listed $118,000 GPSMLS
- 1991-04-22 Sold (Public Records) $88,500 Public Records
Property tax history
+2.9%/yrLatest (2025): $5,458 · +10.1% YoY. Source: county tax records.
Cash-flow waterfall
monthlySold comps — $/sqft
last 12 mo · ≤1 miLoading sold comps…