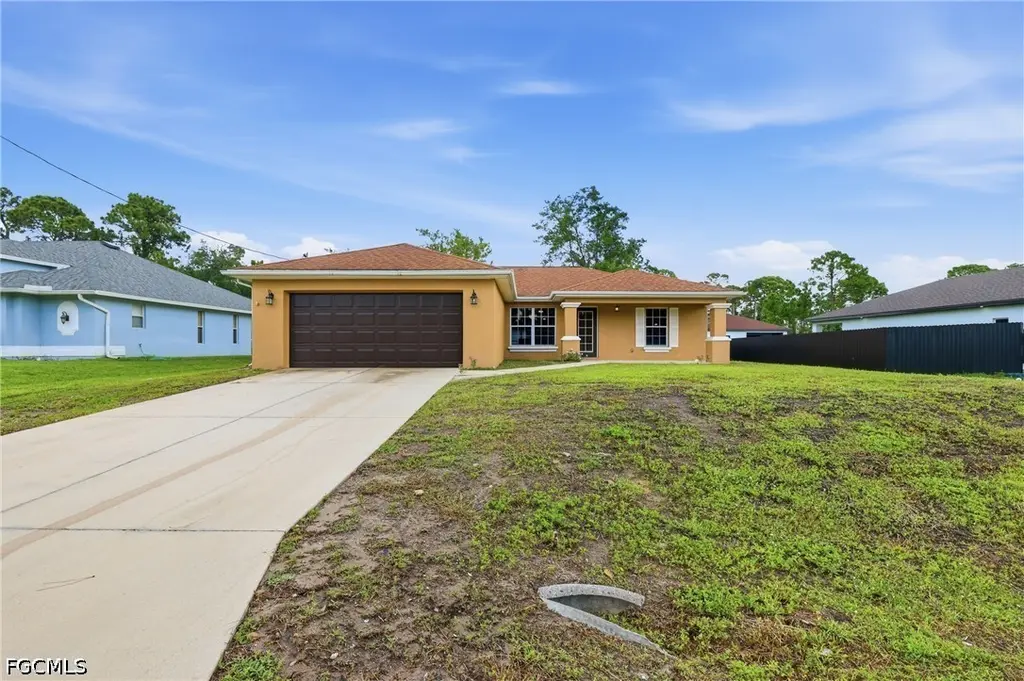
919 Winters St E · Lehigh Acres, FL
Flood risk 1/10 · Minimal
- FEMA flood zone
- X (unshaded)
- Chance of flooding over 30 yrs
- 0.0%
- Est. flood insurance / yr
- $507 – $1,088
Fire risk 4/10 · Minor
- Est. fire insurance / yr
- $947 – $1,759
Heat risk 9/10 · Severe
- Hot days now (above 109°F)
- 7 days/yr
- Hot days in 30 yrs
- 27 days/yr
Wind risk 10/10 · Severe
- Chance of severe wind over 30 yrs
- 99.0%
Air-quality risk 2/10 · Minimal
- Unhealthy air days now
- 1 days/yr
- Unhealthy air days in 30 yrs
- 2 days/yr
Risk factors via First Street. Map © Google.
Why this score? — see what drove the D- grade
The composite is a weighted blend of 9 inputs, each scored 0–100. Each bar is that input's sub-score; the figure is the points it added to the 100-point composite (weight × sub-score).
- Appreciation +10.0/10.0
- Cash flow +8.0/30.0
- ARV discount +5.1/15.0
- Schools +4.1/10.0
- Livability +3.0/5.0
- Condition / age +2.5/5.0
- DSCR +2.0/10.0
- Rent growth +1.3/5.0
- 1% rule +1.2/10.0
$320,000
🖨 Deal sheet 📄 Offer letter ✓ Due diligence
Listing remarks
Welcome to this great home in the heart of Lehigh Acres. Sitting on a nice lot in a quiet, established neighborhood, this property offers comfort, space, and so much potential to make it your own. Inside, you'll find a functional layout featuring 3 bedrooms 2 bathrooms, with a bright open feel throughout. The home offers tile flooring throughout, making it both stylish and low maintenance. Step outside and enjoy the screened-in covered lanai, perfect for relaxing evenings, morning coffee, or entertaining without the bugs. The outdoor space gives you plenty of room to add your personal touch and truly make it your own. Conveniently located near SR-82, shopping, dinning, schools, and major ro
Key facts
- Tile flooring
- 0.23 acre lot
- 2 garage spots
Tags
Property features AI
Finance
- Financial info: Pets allowed
- HOA & community: Non-gated community; No association fee
Exterior
- Parking: Attached 2-car garage; Covered parking for 2
- Utilities: Septic tank; Well water; Cable available; High-speed internet available
- Home design: Single-story home; Entry at level 1; Faces south; Resale property
- Construction: Block, concrete and stucco construction; Shingle roof; Rectangular lot; North exposure
- Exterior features: Patio; Lanai; Screened porch; Porch
Interior
- Kitchen: Electric cooktop; Microwave; Refrigerator; Freezer; Breakfast bar
- Bedrooms: Guest quarters
- Flooring: Tile
- Bathrooms: 2 full bathrooms
- Heating & cooling: Central heating (electric); Central air conditioning (electric); Ceiling fan(s)
- Interior features: Breakfast bar; Combined family and dining room; Combined living and dining room; Tub with shower; Walk-in closet(s); Split bedroom layout; Single-hung windows; Unfurnished; Tile flooring
- Laundry & utility: Inside laundry; Washer; Dryer
Neighborhood map
What this means for you Summary
Snapshot
- This is a 3-bed/2.0-bath single-family listed at $320k.
Deal economics
- At list price, monthly cash flow is $-332 ($-4k/yr) — negative.
- To cash-flow at today's rent, offer at most $261k (18.3% below list).
- To meet the 1% rule (rent ≥ 1% of price), the offer needs to be $199k (37.9% below list).
- Recommended offer: $199k (37.9% below list) — sets the bar for 1% rule.
Location & tenants
- Location reads 59/100 on livability (#826 in FL) — a working-class tenant base; expect higher turnover. Strengths: cost of living A+, housing A+; Watch: crime C-, employment D+, schools D-.
- Lee (suburban): math 47% / reading 50% proficiency, ranked #42 of 73 in FL (top 58%) — families likely to look elsewhere, expect single-tenant / working-renter base with shorter leases.
- Market conditions: Rents falling (-4.7%/yr); 2460 active listings in the ZIP; 40 comparable units currently listed for rent nearby; rentals at typical pace (median 22d on market — plan ~3-4 weeks tenant-placement turnaround); 15,411 units permitted in Lee County in 2024 (4,686 in 5+ unit buildings).
- This rent runs 33% of the median local income ($72k/yr) — at the standard rent-burdened threshold; future hikes will face affordability resistance.
Forward outlook
- In year one you build about $34k of equity ($2k loan paydown + $32k appreciation (10.0% local appreciation)).
- Lee County population projected at +44% by 2050 — long-run rental-demand tailwind backs the buy-and-hold thesis.
- By year 2, paydown + projected appreciation supports a ~$55k cash-out refi (75% LTV) — recoverable capital for the next deal without selling this one.
Negotiation context
- It's been on market 22 days — a 2% lower offer ($315k) is reasonable based on typical stale-listing flexibility.
- Current owner paid $150k; list at $320k implies a 113% gain — meaningful room to come down on a strong offer.
Risks & watch-outs
- Climate carrying-cost: severe wind risk, 99% chance of damaging wind over 30y; extreme-heat days projected 7→27/yr by 2055 (HVAC capex compounding) — expect insurance premiums to compound above CPI over the hold.
Questions for the listing agent
- What do current leases actually rent for vs. the listed asking? Can we see a recent rent roll and the last 12 months of T-12 income?
- Is there a deadline driving the sale (1031 exchange, divorce, estate, relocation)? That informs how much negotiation room exists.
- Schools are D-rated, which usually means shorter tenancies and higher turnover. Who's the typical renter profile here, and what's been the actual vacancy rate?
- The area grade is low — what's the realistic commute time and amenity access for the typical tenant pool here? Any planned neighborhood developments (good or bad) we should know about?
- What's the average days-on-market for RENTAL listings here right now (not sales)? A rising rental-DOM trend means longer vacancies and softer asking-rent achievability than the comps imply.
- What's the recent tenant-quality profile in this submarket — average credit score on applications, eviction rate, late-payment / NSF rate, and stable-employment percentage? A property-management company in the area should have these aggregated.
- How much new for-sale + rental construction is in the pipeline within 1–3 miles? Heavy new supply typically softens prices + rents 12–24 months out; constrained supply supports both.
Investment metrics
- 1% rule
- 0.62% ✗
- Cap rate
- 5.05%
- Cash-on-cash
- -4.44%
- DSCR
- 0.80
- GRM
- 13.4
CMA / ARV
- ARV (on-the-fly)
- $304,017
- Comps found
- 8
Show comp detail 8 sales within ~0.75 mi
| Address | Dist | Beds/Ba | Sqft | Sold | Price | $/sf | Match |
|---|---|---|---|---|---|---|---|
| 628 Locust Ave S | 0.13mi | 3/2.0 | 1,500 (+7%) | 3mo | $325,000 | $217 | 80 |
| 925 Winters St E | 0.05mi | 3/2.0 | 1,270 (-9%) | 7mo | $280,000 | $220 | 76 |
| 555 Mcarthur Blvd | 0.31mi | 3/2.0 | 1,401 (0%) | 15mo | $265,000 | $189 | 73 |
| 823 Hoosier St E | 0.57mi | 3/2.0 | 1,478 (+6%) | 4mo | $325,000 | $220 | 61 |
| 718 Bedford Point Ave | 0.41mi | 4/3.0 (+1) | 1,580 (+13%) | 0mo | $314,900 | $199 | 50 |
| 734 Fleming Ave S | 0.69mi | 3/2.0 | 1,477 (+5%) | 12mo | $289,990 | $196 | 49 |
| 819 Frederick Reid St E | 0.67mi | 3/2.0 | 1,601 (+14%) | 2mo | $299,000 | $187 | 43 |
| 809 Bently St E | 0.69mi | 3/2.0 | 1,291 (-8%) | 21mo | $315,000 | $244 | 37 |
Match score weights: distance 35% · size 25% · config 20% · recency 20%. Top-matched comps best support the ARV.
Projected returns pro-forma
10.0% appreciation · 0.0% rent growth · sell at horizon
- IRR
- 20.4%
- Equity multiple
- 2.64×
- Total profit
- $147,177
- Equity at exit
- $288,281
- IRR
- 18.1%
- Equity multiple
- 5.90×
- Total profit
- $439,267
- Equity at exit
- $621,690
Cash invested: $89,600 (down + closing). Projections, not guarantees.
Landlord ↔ Tenant lean methodology
- Overall (STATE)
- 87 Strongly Landlord-Friendly
- State Florida
- 87 Strongly Landlord-Friendly · R+3
- County
- — inherits STATE
- City
- — inherits STATE
ZIP-level market 33974
- Home prices YoY
- 5.8%
- Rents YoY
- -4.7%
- Active inventory
- 2460
- Price-to-rent
- 13.4×
Monthly cashflow live
- Estimated rent
- $1,988 high interval (Pro) →
- Mortgage (P&I)
- −$1,678
- Tax from tax record
- −$91 /mo · $1,089/yr
- Insurance
- −$133
- HOA
- −$0
- Vacancy / Maint / Mgmt
- −$418
- Net cashflow
- $-332
Break-even live
Sensitivity live
| Price | -10% $-150 | -5% $-241 | +0% $-332 | +5% $-422 | +10% $-513 |
|---|---|---|---|---|---|
| Rent | -10% $-489 | -5% $-410 | +0% $-332 | +5% $-253 | +10% $-175 |
| Rate | -1.0pp $-170 | -0.5pp $-250 | base $-332 | +0.5pp $-414 | +1.0pp $-499 |
UW: 25.0% down · 7.5% · 30yr · 1.5% tax · 5.0% vac · 8.0% maint · 8.0% mgmt
Financing live
Cash to close
- Down payment
- $80,000
- Closing costs
- $9,600
- Reserves months
- —
- Total cash needed
- —
Loan-product check · same deal, 3 products live
Conventional
25% down · 7.5% · 30yr
- Down + closing
- —
- Monthly P&I
- —
- Monthly cashflow
- —
- DSCR
- —
- Eligible?
- —
Personal DTI + credit; lowest rate.
DSCR
20% down · 8.5% · 30yr
- Down + closing
- —
- Monthly P&I
- —
- Monthly cashflow
- —
- DSCR
- —
- Eligible?
- —
No personal income docs; deal must DSCR.
Hard money
10% down · 12.0% · 12mo
- Down + closing
- —
- Monthly P&I
- —
- Monthly cashflow
- —
- DSCR
- —
- Eligible?
- —
Short-term bridge; refi at stabilization.
Rent comps 40 comps
| Address | Beds | Baths | Sqft | Rent | $/sqft | DOM | Units | Dist |
|---|---|---|---|---|---|---|---|---|
| 908 Winters St E Lehigh Acres, FL | 3.0 | 2.0 | 1639 | $2,200 | $1.34 | 11d | 1 | 0.07mi |
| 928 Milwaukee Blvd Lehigh Acres, FL | 4.0 | 2.0 | 1719 | $1,990 | $1.16 | 24d | 1 | 0.15mi |
| 635 Hawthorne Ave S Lehigh Acres, FL | 3.0 | 2.0 | 1029 | $1,300 | $1.26 | 24d | 1 | 0.20mi |
| 635 Hawthorne Ave S Lehigh Acres, FL | 3.0 | 2.0 | 1029 | $1,300 | $1.26 | 21d | 1 | 0.20mi |
| 886 Milwaukee Blvd Lehigh Acres, FL | 3.0 | 2.0 | 1205 | $1,900 | $1.58 | 24d | 1 | 0.27mi |
| 874 Apartment St Lehigh Acres, FL | 3.0 | 2.0 | 1200 | $1,750 | $1.46 | 24d | 1 | 0.28mi |
| 862 Charles Sise St E Lehigh Acres, FL | 3.0 | 2.0 | 1582 | $2,664 | $1.68 | 24d | 1 | 0.33mi |
| 954 Pilgrim St E Lehigh Acres, FL | 3.0 | 2.0 | 1246 | $1,625 | $1.30 | 2d | 1 | 0.37mi |
| 541 Hawthorne Ave S Lehigh Acres, FL | 3.0 | 2.0 | 1634 | $1,921 | $1.18 | 3d | 1 | 0.46mi |
| 708 Godwid Ave S Lehigh Acres, FL | 3.0 | 2.0 | 1758 | $2,150 | $1.22 | 21d | 1 | 0.51mi |
| 710 Godwid Ave S Lehigh Acres, FL | 3.0 | 2.0 | 1758 | $2,150 | $1.22 | 3d | 1 | 0.52mi |
| 710 Godwid Ave S Lehigh Acres, FL | 3.0 | 2.0 | 1758 | $2,150 | $1.22 | 3d | 1 | 0.52mi |
| 710 Godwid Ave S Lehigh Acres, FL | 3.0 | 2.0 | 1758 | $2,150 | $1.22 | 21d | 1 | 0.52mi |
| 730 Holmes Ave Unit 728 Lehigh Acres, FL | 3.0 | 2.0 | 1080 | $1,500 | $1.39 | 11d | 1 | 0.58mi |
| 538 Flamingo Ave S Lehigh Acres, FL | 3.0 | 2.0 | 1272 | $1,791 | $1.41 | 3d | 1 | 0.59mi |
| 538 Cypress Ave S Lehigh Acres, FL | 3.0 | 2.0 | 1055 | $1,699 | $1.61 | 3d | 1 | 0.65mi |
| 684 Thomas Sherwin Ave S Lehigh Acres, FL | 3.0 | 2.0 | 1288 | $1,695 | $1.32 | 3d | 1 | 0.69mi |
| 756 Holmes Ave Lehigh Acres, FL | 3.0 | 2.0 | 1100 | $1,450 | $1.32 | 11d | 1 | 0.70mi |
| 940 Sterling St E Lehigh Acres, FL | 4.0 | 2.0 | 1389 | $1,750 | $1.26 | 3d | 1 | 0.70mi |
| 604 Thomas Sherwin Ave S Lehigh Acres, FL | 4.0 | 2.0 | 1493 | $2,200 | $1.47 | 3d | 1 | 0.74mi |
| 761 Kirkman Ave S Lehigh Acres, FL | 3.0 | 2.0 | 1188 | $1,900 | $1.60 | 24d | 1 | 0.78mi |
| 930 Ainsworth St W Lehigh Acres, FL | 3.0 | 2.0 | 1165 | $1,395 | $1.20 | 16d | 1 | 0.79mi |
| 762 Gallo Ave S #764 Lehigh Acres, FL | 3.0 | 2.0 | 1127 | $1,195 | $1.06 | 21d | 1 | 0.80mi |
| 970 Lakeside Dr Lehigh Acres, FL | 3.0 | 2.0 | 1325 | $1,800 | $1.36 | 20d | 1 | 0.84mi |
| 925 Chenault St Lehigh Acres, FL | 3.0 | 2.0 | 1132 | $1,700 | $1.50 | 24d | 1 | 0.88mi |
| 927 Chenault St Lehigh Acres, FL | 3.0 | 2.0 | 1132 | $1,700 | $1.50 | 24d | 1 | 0.88mi |
| 907 Chenault St Lehigh Acres, FL | 2.0 | 4.0 | 1200 | $1,250 | $1.04 | 15d | 1 | 0.90mi |
| 573 Bell Blvd S Lehigh Acres, FL | 3.0 | 2.0 | 1218 | $1,900 | $1.56 | 15d | 1 | 0.90mi |
| 708 Genoa Ave S Lehigh Acres, FL | 3.0 | 2.0 | 1055 | $1,650 | $1.56 | 3d | 1 | 0.91mi |
| 556 Sherwood Ave S Lehigh Acres, FL | 3.0 | 2.0 | 1582 | $2,175 | $1.37 | 24d | 1 | 0.92mi |
| 459 Lockport Ave S Lehigh Acres, FL | 3.0 | 2.0 | 1650 | $2,000 | $1.21 | 24d | 1 | 0.92mi |
| 760 Festival Ave S Lehigh Acres, FL | 3.0 | 2.0 | 1650 | $2,000 | $1.21 | 24d | 1 | 0.94mi |
| 819 Eisenhower Blvd Unit 819 Lehigh Acres, FL | 3.0 | 2.0 | 1390 | $1,650 | $1.19 | 24d | 1 | 0.98mi |
| 827 Eisenhower Blvd Lehigh Acres, FL | 3.0 | 2.5 | 1640 | $1,780 | $1.09 | 12d | 1 | 1.02mi |
| 1018 Kent St E Lehigh Acres, FL | 3.0 | 2.0 | 1600 | $2,000 | $1.25 | 16d | 1 | 1.05mi |
| 715 Bering Ave S Lehigh Acres, FL | 3.0 | 2.0 | 1835 | $1,895 | $1.03 | 21d | 1 | 1.09mi |
| 508 Bell Blvd S Lehigh Acres, FL | 3.0 | 2.0 | 1200 | $1,800 | $1.50 | 24d | 1 | 1.15mi |
| 382 McArthur Blvd Lehigh Acres, FL | 3.0 | 2.0 | 1055 | $2,200 | $2.09 | 24d | 1 | 1.17mi |
| 947 Grant Blvd Lehigh Acres, FL | 4.0 | 2.0 | 1650 | $2,145 | $1.30 | 24d | 1 | 1.20mi |
| 814 Crystal Ave S Lehigh Acres, FL | 3.0 | 2.0 | 1865 | $1,815 | $0.97 | 24d | 1 | 1.23mi |
Listing history 18 events
-
2026-06-17days on market $320,000 Active 22 DOM
-
2026-06-16days on market $320,000 Active 21 DOM
-
2026-06-15days on market $320,000 Active 20 DOM
-
2026-06-13days on market $320,000 Active 18 DOM
-
2026-06-10days on market $320,000 Active 15 DOM
-
2026-06-09days on market $320,000 Active 14 DOM
-
2026-06-08days on market $320,000 Active 13 DOM
-
2026-06-07days on market $320,000 Active 12 DOM
-
2026-06-03days on market $320,000 Active 8 DOM
-
2026-06-02days on market $320,000 Active 7 DOM
-
2026-06-01days on market $320,000 Active 6 DOM
-
2026-05-31days on market $320,000 Active 5 DOM
-
2026-05-26$320,000 Active
-
2025-05-16soldstatus $150,000
-
2006-01-06soldstatus $91,900
-
2005-08-08soldstatus $139,410,000
-
2005-06-07soldstatus $37,000
-
2004-02-06soldstatus $12,900
ⓘ Source: listings_history table (triggers on properties + properties_extension) + one-shot
backfill from property_details.listing_events for pre-trigger history.
Tax reassessment forecast FL · Resets to sale price
- Current annual tax
- $1,089 · $91/mo
- Projected year-2 tax
- $2,656 · $221/mo
- Expected delta
- +$1,567/yr (+$131/mo · 144.0%)
ⓘ Screening estimate from a state-policy table — verify with the county assessor before closing.
Climate risk First Street
- Flood 1/10 Low FEMA zone X (unshaded) · 0% chance over 30 yrs
- Wildfire 4/10 Moderate
- Heat 9/10 Extreme 7 d/yr ≥109°F today · 27 d/yr by 30 yrs out
- Wind 10/10 Extreme 99% chance of damaging wind over 30 yrs
- Air quality 2/10 Low 1 unhealthy d/yr today · 2 by 30 yrs out
Nearby sold comps map
Loading sold comps map…
Walkable amenities ~0.75 mi
Loading nearby amenities…
Taxation est. · year 1
- Rental income
- $23,857
- − Mortgage interest
- −$17,925
- − Property taxes
- −$1,089
- − Insurance
- −$1,600
- − Repairs & maintenance
- −$1,909
- − Management
- −$1,909
- − Depreciation
- −$9,309
- Taxable loss
- −$9,883
- Est. tax savings @ 24.0%
- +$2,372
- After-tax cash flow
- $-1,607/yr
For passive investors: Depreciation is non-cash, so a rental often shows a tax loss while cash-flowing — sheltering income. Rental losses are passive: they offset passive income freely, and up to $25,000/yr can offset ordinary (W-2) income if you actively participate and your MAGI is under $100k (phasing out to $0 by $150k); unused losses carry forward. On sale, claimed depreciation is recaptured at up to 25%, and gains may owe capital-gains tax (a 1031 exchange can defer both). Figures are a year-1 estimate at your 24.0% rate — not tax advice; consult a CPA.
Schools (NCES district)
- District
- Lee
- NCES district ID
- 1201080
- Math proficiency
- 47% ▼ -11.00%
- Reading proficiency
- 50% ▼ -4.00%
- Median HH income
- $49,518
- Composite
- 41.49/100
- National rank
- #3458
- State rank
- #42 of 73 in FL
Livability — Lehigh Acres
- Score
- 59/100
- State rank
- #826
- US rank
- #20055
Category grades
Schools grade is shown separately in the Schools card above.
Census & demographics
- Census place
- Lehigh Acres, FL
- County
- Lee County · 788,662 people
- City population
- 130,638
- Metro
- Cape Coral-Fort Myers, FL
- Population (ZIP)
- 19,927
- Household income
- $72,192
- Rent vs Own
- Severe rent burden
- 434.0
Population outlook (Lee County) Hauer SSP2
- Today (2025)
- 871,946 people
- By 2030
- 955,468 · +9.6%
- By 2040
- 1,113,587 · +27.7%
- By 2050
- 1,256,891 · +44.1%
- By 2075
- 1,560,270 · +78.9%
- By 2100
- 1,726,848 · +98.0%
Race, ethnicity, and origin ACS 2023
- Neighborhood character
- Diverse neighborhood (Simpson 0.64)
- Race & ethnicity
- Hispanic / Latino 52% Two or more races 31% White 26% Black 18%
- Hispanic origin (detail)
- Mexican 12% Puerto Rican 7% Cuban 20% Dominican 4%
- Common ancestry
- Hispanic 7% Italian 1% Portuguese 1%
- Foreign-born
- 32% · Canada, Jamaica
- Languages at home
- 48% English-only · Spanish 43% French/Haitian/Cajun 7% Other Indo-European 1%
Political lean MEDSL · Lee
- 2024 margin
- Strong R (+28.4) · D 35.5% · R 63.9%
- 2008→2024 swing
- -18.0pp toward R · 2008: -10.4pp · 2024: -28.4pp
- All cycles
- 2024: R+28.4 2020: R+19.2 2016: R+20.4 2012: R+16.6 2008: R+10.4
Not yet ingested
- Civics
- —
Market trends
- HPI YoY
- ▲ 16.53%
- Current HPI
- 303.3399
- Rent YoY
- ▼ -4.68%
- Metro
- Cape Coral-Fort Myers, FL
- State GDP YoY
- ▲ 3.28%
- F500 in state
- 36
Industry mix (Fortune 500 HQ in FL)
| Industry | F500 HQs | Revenue |
|---|---|---|
| Industrial Technology | 2 | $29B |
|
||
| Insurance | 2 | $17B |
|
||
| Retail | 1 | $60B |
|
||
| Technology Distribution | 1 | $58B |
|
||
| Homebuilding | 1 | $35B |
|
||
| Technology Manufacturing | 1 | $35B |
|
||
Price history
+2380.6% since first listed6 events — show timeline
- 2026-05-26 Listed $320,000 FORTMLS
- 2025-05-16 Sold (Public Records) $150,000 Public Records
- 2006-01-06 Sold (Public Records) $91,900 Public Records
- 2005-08-08 Sold (Public Records) $139,410,000 Public Records
- 2005-06-07 Sold (Public Records) $37,000 Public Records
- 2004-02-06 Sold (Public Records) $12,900 Public Records
Property tax history
+8.6%/yrLatest (2025): $1,089 · +6.4% YoY. Source: county tax records.
Cash-flow waterfall
monthlySold comps — $/sqft
last 12 mo · ≤1 miLoading sold comps…