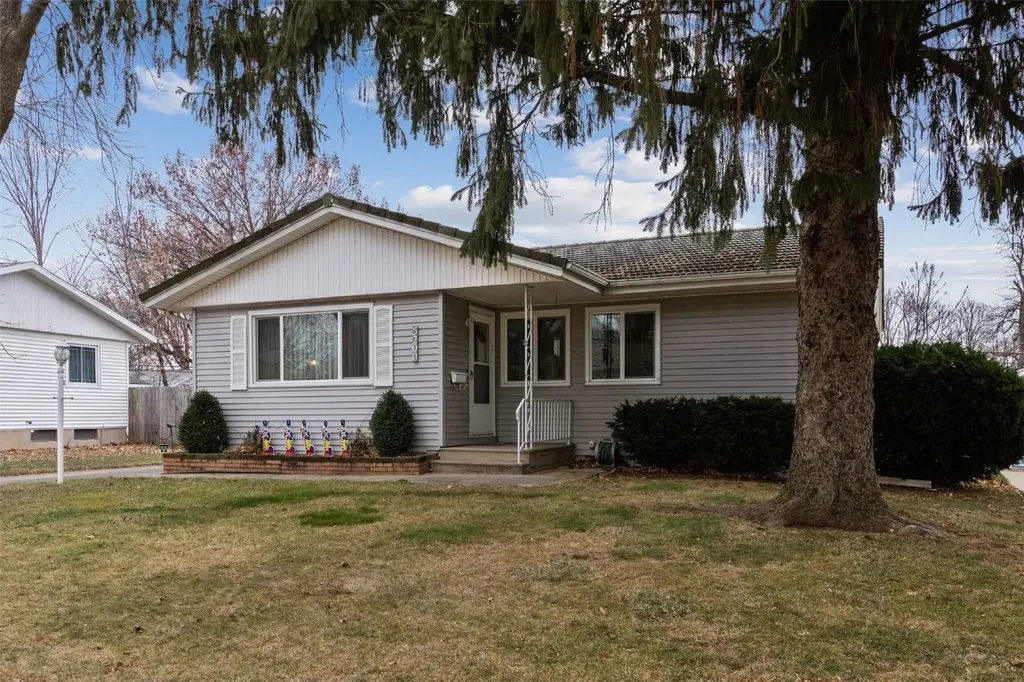
5200 Holly Ave · Cedar Rapids, IA
Flood risk 1/10 · Minimal
- FEMA flood zone
- X (unshaded)
- Chance of flooding over 30 yrs
- 0.0%
- Est. flood insurance / yr
- $473 – $860
Fire risk 3/10 · Minor
- Est. fire insurance / yr
- $902 – $1,676
Heat risk 3/10 · Minor
- Hot days now (above 103°F)
- 7 days/yr
- Hot days in 30 yrs
- 15 days/yr
Wind risk 2/10 · Minimal
- Chance of severe wind over 30 yrs
- —
Air-quality risk 2/10 · Minimal
- Unhealthy air days now
- 0 days/yr
- Unhealthy air days in 30 yrs
- 1 days/yr
Risk factors via First Street. Map © Google.
Why this score? — see what drove the C- grade
The composite is a weighted blend of 9 inputs, each scored 0–100. Each bar is that input's sub-score; the figure is the points it added to the 100-point composite (weight × sub-score).
- ARV discount +15.0/15.0
- Cash flow +12.6/30.0
- Rent growth +5.0/5.0
- Schools +4.7/10.0
- Livability +3.9/5.0
- 1% rule +3.8/10.0
- DSCR +3.8/10.0
- Condition / age +2.5/5.0
- Appreciation +0.0/10.0
$180,000
🖨 Deal sheet (PDF) 📄 Offer letter ✓ Due diligence
Listing remarks MLS
Beautifully maintained home located in an established NW neighborhood! Inviting, spacious living room with newer carpet & large picture window allowing much natural light. Open kitchen/dining area. All new windows! Updated bath on the main floor! Pristine, original hardwood floors in all 3 bedrooms. Fresh paint thru-out. Lower level offers comfy family room & bar area for entertaining. Also 3/4 bath and 4th (non-conforming) bedroom. This one owner home has been well cared for. Tree-lined front yard, large deck overlooking the back yard. Located near schools, quick access to shopping, yet nestled in this Cedar Hills, family friendly neighborhood.
Key facts
- Finished basement
- Fully fenced yard
- Spacious layout
Tags
Property features AI
Finance
- Other: Pets allowed
Exterior
- Parking: Detached garage; Garage door opener; Off-street parking; 1 garage space
- Utilities: Public water; Public sewer
- Home design: Single-family residence; Residential property
- Construction: Frame construction with vinyl siding
- Exterior features: Deck; Fenced yard; Public-maintained road
Interior
- Kitchen: Range; Range hood; Disposal
- Bedrooms: 5 rooms total
- Bathrooms: 2 full bathrooms
- Heating & cooling: Natural gas forced-air heating; Central air conditioning
- Interior features: Eat-in kitchen; Full concrete basement
- Laundry & utility: Washer; Dryer; Gas water heater
Neighborhood map
What this means for you Summary
Snapshot
- This is a 3-bed/2.0-bath single-family listed at $180k.
Deal economics
- At list price, monthly cash flow is $-23 ($-280/yr) — negative.
- To cash-flow at today's rent, offer at most $176k (2.3% below list).
- To meet the 1% rule (rent ≥ 1% of price), the offer needs to be $158k (12.0% below list).
- Recommended offer: $158k (12.0% below list) — sets the bar for 1% rule.
- Cap rate 6.1% vs local median 3.5% in Cedar Rapids — top-decile yield for the area; either an underpriced asset or a hidden risk that comps aren't pricing in. Stress-test before assuming the spread holds.
Location & tenants
- Location reads 78/100 on livability (#134 in IA, #2,474 nationally) — a middle-class / working-renter tenant base. Strengths: cost of living A+, housing A+, health & safety A+; Watch: crime C-, commute F.
- Cedar Rapids Community School District (urban): math 50% / reading 59% proficiency, ranked #265 of 289 in IA (top 92%) — acceptable for families but not a draw, mixed tenant base, ~2y average lease.
- Zoned schools: Maple Grove Elementary (math 67% / reading 67%, grade B+, #273 of 616 statewide, top 51%, 529 students, 35% FRL); Taft Middle School (math 60% / reading 63%, grade B+, #179 of 246 statewide, top 73%, 578 students, 38% FRL); Thomas Jefferson High School (math 41% / reading 62%, grade D+, #307 of 336 statewide, top 91%, 1,543 students, 56% FRL) — zoned schools at 43% FRL track the district average.
- Market conditions: Rents rising fast (+12.4%/yr); 149 active listings in the ZIP; 3 comparable units currently listed for rent nearby; rentals at typical pace (median 15d on market — plan ~3-4 weeks tenant-placement turnaround); 1,023 units permitted in Linn County in 2024 (456 in 5+ unit buildings).
Forward outlook
- Local home prices are declining (-3.0%/yr); year-one equity from $1k of loan paydown is wiped out by about $5k of value loss. Plan a longer hold.
- Linn County population projected at +16% by 2050 — long-run rental-demand tailwind backs the buy-and-hold thesis.
Negotiation context
- It's been on market 20 days — a 2% lower offer ($177k) is reasonable based on typical stale-listing flexibility.
- 2 sale attempts since 7y ago with the ask held roughly flat each time — persistent listings suggest the price (not the market) is what's stuck; bring a comps-based counter.
- Current owner paid $137k; 31% above their basis — modest negotiation headroom, anchor on the comps not their cost.
Risks & watch-outs
- Watch-outs: built in 1958 — expect roof / HVAC / electrical / plumbing capex.
Questions for the listing agent
- What do current leases actually rent for vs. the listed asking? Can we see a recent rent roll and the last 12 months of T-12 income?
- Built in 1958 — when were the roof, HVAC, electrical panel, plumbing, and water heater last replaced?
- Is there a deadline driving the sale (1031 exchange, divorce, estate, relocation)? That informs how much negotiation room exists.
- Schools are B-rated — typically a magnet for longer-tenancy family renters. What's the average tenant stay here, and is there a school-zone premium baked into asking?
- What's the average days-on-market for RENTAL listings here right now (not sales)? A rising rental-DOM trend means longer vacancies and softer asking-rent achievability than the comps imply.
- What's the recent tenant-quality profile in this submarket — average credit score on applications, eviction rate, late-payment / NSF rate, and stable-employment percentage? A property-management company in the area should have these aggregated.
- How much new for-sale + rental construction is in the pipeline within 1–3 miles? Heavy new supply typically softens prices + rents 12–24 months out; constrained supply supports both.
Investment metrics
- 1% rule
- 0.88% ✗
- Cap rate
- 6.14%
- Cash-on-cash
- -0.55%
- DSCR
- 0.98
- GRM
- 9.5
CMA / ARV
- ARV (on-the-fly)
- $226,920
- Comps found
- 12
Show comp detail 12 sales within ~0.75 mi
| Address | Dist | Beds/Ba | Sqft | Sold | Price | $/sf | Match |
|---|---|---|---|---|---|---|---|
| 441 Day St NW | 0.35mi | 3/2.0 | 1,450 (-1%) | 2mo | $215,000 | $148 | 81 |
| 5434 Gordon Ave NW | 0.18mi | 3/1.0 | 1,410 (-4%) | 1mo | $219,000 | $155 | 81 |
| 332 Carter St NW | 0.26mi | 3/1.5 | 1,509 (+3%) | 3mo | $192,000 | $127 | 78 |
| 5517 D Ave NW | 0.39mi | 3/1.0 | 1,433 (-2%) | 2mo | $198,000 | $138 | 73 |
| 448 Day St St NW | 0.37mi | 3/1.5 | 1,397 (-5%) | 2mo | $222,000 | $159 | 71 |
| 142 Harbet Ave NW | 0.24mi | 3/2.0 | 1,654 (+13%) | 1mo | $260,000 | $157 | 67 |
| 146 Eastview Dr NW | 0.41mi | 3/1.5 | 1,337 (-9%) | 2mo | $224,900 | $168 | 63 |
| 6008 Eastview Ave SW | 0.60mi | 4/2.0 (+1) | 1,504 (+3%) | 3mo | $238,500 | $159 | 60 |
| 650 Olive Dr NW | 0.60mi | 3/1.5 | 1,368 (-7%) | 2mo | $240,000 | $175 | 57 |
| 416 Hanover Rd SW | 0.60mi | 4/1.0 (+1) | 1,422 (-3%) | 3mo | $199,000 | $140 | 56 |
| 135 Eastview Dr NW | 0.40mi | 3/1.5 | 1,272 (-13%) | 2mo | $185,000 | $145 | 55 |
| 4324 Midway Dr NW | 0.53mi | 4/1.5 (+1) | 1,659 (+13%) | 1mo | $221,000 | $133 | 45 |
Match score weights: distance 35% · size 25% · config 20% · recency 20%. Top-matched comps best support the ARV.
Projected returns pro-forma
-3.0% appreciation · 8.0% rent growth · sell at horizon
- IRR
- -11.6%
- Equity multiple
- 0.56×
- Total profit
- $-22,239
- Equity at exit
- $26,839
- IRR
- 3.8%
- Equity multiple
- 1.34×
- Total profit
- $16,991
- Equity at exit
- $15,563
Cash invested: $50,400 (down + closing). Projections, not guarantees.
Landlord ↔ Tenant lean methodology
- Overall (STATE)
- 83 Strongly Landlord-Friendly
- State Iowa
- 83 Strongly Landlord-Friendly · R+6
- County
- — inherits STATE
- City
- — inherits STATE
ZIP-level market 52405
- Rents YoY
- 12.4%
- Active inventory
- 149
- Price-to-rent
- 9.5×
Monthly cashflow live
- Estimated rent
- $1,584 medium interval (Pro) →
- Mortgage (P&I)
- −$944
- Tax from tax record
- −$256 /mo · $3,066/yr
- Insurance
- −$75
- HOA
- −$0
- Vacancy / Maint / Mgmt
- −$333
- Net cashflow
- $-23
Break-even live
Sensitivity live
| Price | -10% $79 | -5% $28 | +0% $-23 | +5% $-74 | +10% $-125 |
|---|---|---|---|---|---|
| Rent | -10% $-148 | -5% $-86 | +0% $-23 | +5% $39 | +10% $102 |
| Rate | -1.0pp $67 | -0.5pp $22 | base $-23 | +0.5pp $-70 | +1.0pp $-117 |
UW: 25.0% down · 7.5% · 30yr · 1.5% tax · 5.0% vac · 8.0% maint · 8.0% mgmt
Financing live
Cash to close
- Down payment
- $45,000
- Closing costs
- $5,400
- Reserves months
- —
- Total cash needed
- —
Loan-product check · same deal, 3 products live
Conventional
25% down · 7.5% · 30yr
- Down + closing
- —
- Monthly P&I
- —
- Monthly cashflow
- —
- DSCR
- —
- Eligible?
- —
Personal DTI + credit; lowest rate.
DSCR
20% down · 8.5% · 30yr
- Down + closing
- —
- Monthly P&I
- —
- Monthly cashflow
- —
- DSCR
- —
- Eligible?
- —
No personal income docs; deal must DSCR.
Hard money
10% down · 12.0% · 12mo
- Down + closing
- —
- Monthly P&I
- —
- Monthly cashflow
- —
- DSCR
- —
- Eligible?
- —
Short-term bridge; refi at stabilization.
Rent comps 3 comps
| Address | Beds | Baths | Sqft | Rent | $/sqft | DOM | Units | Dist |
|---|---|---|---|---|---|---|---|---|
| 5006 Spencer Dr SW Cedar Rapids, IA | 3.0 | 2.5 | 1498 | $1,700 | $1.13 | 15d | 1 | 0.39mi |
| 5830 Greenbriar Ln SW Cedar Rapids, IA | 1.0–2.0 | 1.0 | 832 | $1,400 | $1.68 | 15d | 2 | 0.78mi |
| 1834 Gretchen Dr SW Cedar Rapids, IA | 3.0 | 2.0 | 1568 | $1,589 | $1.01 | 15d | 1 | 1.04mi |
Listing history 16 events
-
2026-06-21days on market $180,000 Active 20 DOM
-
2026-06-19days on market $180,000 Active 18 DOM
-
2026-06-18days on market $180,000 Active 17 DOM
-
2026-06-17days on market $180,000 Active 16 DOM
-
2026-06-16days on market $180,000 Active 15 DOM
-
2026-06-15days on market $180,000 Active 14 DOM
-
2026-06-14days on market $180,000 Active 12 DOM
-
2026-06-13days on market $180,000 Active 11 DOM
-
2026-06-10days on market $180,000 Active 9 DOM
-
2026-06-09days on market $180,000 Active 8 DOM
-
2026-06-08days on market $180,000 Active 7 DOM
-
2026-06-07days on market $180,000 Active 6 DOM
-
2026-06-05days on market $180,000 Active 3 DOM
-
2026-06-03days on market $180,000 Active 2 DOM
-
2026-06-02remarks 472-char remark
-
2026-06-02$180,000 Active 1 DOM
ⓘ Source: listings_history table (triggers on properties + properties_extension) + one-shot
backfill from property_details.listing_events for pre-trigger history.
Tax reassessment forecast IA · Partial reset (capped growth)
- Current annual tax
- $3,066 · $256/mo
- Projected year-2 tax
- $3,066 · $256/mo
- Expected delta
- $0/yr ($0/mo · 0.0%)
ⓘ Screening estimate from a state-policy table — verify with the county assessor before closing.
Climate risk First Street
- Flood 1/10 Low FEMA zone X (unshaded) · 0% chance over 30 yrs
- Wildfire 3/10 Moderate
- Heat 3/10 Moderate 7 d/yr ≥103°F today · 15 d/yr by 30 yrs out
- Wind 2/10 Low
- Air quality 2/10 Low 0 unhealthy d/yr today · 1 by 30 yrs out
Nearby sold comps map
Loading sold comps map…
Walkable amenities ~0.75 mi
Loading nearby amenities…
Taxation est. · year 1
- Rental income
- $19,005
- − Mortgage interest
- −$10,083
- − Property taxes
- −$3,066
- − Insurance
- −$900
- − Repairs & maintenance
- −$1,520
- − Management
- −$1,520
- − Depreciation
- −$5,236
- Taxable loss
- −$3,321
- Est. tax savings @ 24.0%
- +$797
- After-tax cash flow
- $518/yr
For passive investors: Depreciation is non-cash, so a rental often shows a tax loss while cash-flowing — sheltering income. Rental losses are passive: they offset passive income freely, and up to $25,000/yr can offset ordinary (W-2) income if you actively participate and your MAGI is under $100k (phasing out to $0 by $150k); unused losses carry forward. On sale, claimed depreciation is recaptured at up to 25%, and gains may owe capital-gains tax (a 1031 exchange can defer both). Figures are a year-1 estimate at your 24.0% rate — not tax advice; consult a CPA.
Schools (NCES district)
- District
- Cedar Rapids Community School District
- NCES district ID
- 1906540
- Math proficiency
- 50% ▼ -12.00%
- Reading proficiency
- 59% ▼ -6.00%
- Median HH income
- $53,568
- Composite
- 46.82/100
- National rank
- #2378
- State rank
- #265 of 289 in IA
Livability — Cedar Rapids
- Score
- 78/100
- State rank
- #134
- US rank
- #2474
Category grades
Schools grade is shown separately in the Schools card above.
Census & demographics
- Census place
- Cedar Rapids, IA
- County
- Linn County · 179,860 people
- City population
- 137,154
- Metro
- Cedar Rapids, IA
- Population (ZIP)
- 26,526
- Household income
- $70,123
- Rent vs Own
- Severe rent burden
- 715.0
Population outlook (Linn County) Hauer SSP2
- Today (2025)
- 239,589 people
- By 2030
- 248,587 · +3.8%
- By 2040
- 264,817 · +10.5%
- By 2050
- 278,685 · +16.3%
- By 2075
- 311,754 · +30.1%
- By 2100
- 336,773 · +40.6%
Race, ethnicity, and origin ACS 2023
- Neighborhood character
- Predominantly White (79%)
- Race & ethnicity
- White 79% Black 9% Two or more races 7% Hispanic / Latino 5% Asian 2%
- Common ancestry
- Portuguese 4% Lithuanian 2% Iranian 1%
- Foreign-born
- 6% · Canada, China
- Languages at home
- 92% English-only · Spanish 3% French/Haitian/Cajun 1% Other Asian/Pacific 1%
Political lean MEDSL · Linn
- 2024 margin
- Lean D (+9.9) · D 54.2% · R 44.3% · Other 1.4%
- 2008→2024 swing
- -11.6pp toward R · 2008: 21.5pp · 2024: 9.9pp
- All cycles
- 2024: D+9.9 2020: D+13.7 2016: D+9.0 2012: D+17.6 2008: D+21.5
Not yet ingested
- Civics
- —
Market trends
- HPI YoY
- ▼ -137.56%
- Current HPI
- 201.6053
- Rent YoY
- ▲ 12.37%
- Metro
- Cedar Rapids, IA
- State GDP YoY
- ▲ 2.48%
- F500 in state
- 4
Industry mix (Fortune 500 HQ in IA)
| Industry | F500 HQs | Revenue |
|---|---|---|
| Financial Services | 1 | $16B |
|
||
| Retail / Convenience | 1 | $15B |
|
||
Price history
+29.5% since first listed5 events — show timeline
- 2026-06-01 Listed $180,000 CRAAR, CDRMLS
- 2019-03-26 Sold (Public Records) $137,000 Public Records
- 2019-03-26 Sold (Public Records) $137,000 Public Records
- 2019-03-22 Sold (MLS) $137,000 CRAAR, CDRMLS
- 2019-01-15 Listed $139,000 CRAAR, CDRMLS
Property tax history
+2.9%/yrLatest (2025): $3,066 · +8.6% YoY. Source: county tax records.
Cash-flow waterfall
monthlySold comps — $/sqft
last 12 mo · ≤1 miLoading sold comps…