 🌊 Lakefront
22163 County Road 288 · Hermitage, MO
Flood risk 1/10 · Minimal
- FEMA flood zone
- —
- Chance of flooding over 30 yrs
- 0.0%
- Est. flood insurance / yr
- —
Fire risk 4/10 · Minor
- Est. fire insurance / yr
- $1,054 – $1,958
Heat risk 4/10 · Minor
- Hot days now (above 107°F)
- 7 days/yr
- Hot days in 30 yrs
- 18 days/yr
Wind risk 2/10 · Minimal
- Chance of severe wind over 30 yrs
- 0.0%
Air-quality risk 1/10 · Minimal
- Unhealthy air days now
- 0 days/yr
- Unhealthy air days in 30 yrs
- 0 days/yr
Risk factors via First Street. Map © Google.
Why this score? — see what drove the A grade
The composite is a weighted blend of 9 inputs, each scored 0–100. Each bar is that input's sub-score; the figure is the points it added to the 100-point composite (weight × sub-score).
- Cash flow +30.0/30.0
- ARV discount +15.0/15.0
- DSCR +10.0/10.0
- Appreciation +10.0/10.0
- 1% rule +8.5/10.0
- Schools +4.1/10.0
- Livability +2.7/5.0
- Rent growth +2.5/5.0
- Condition / age +2.5/5.0
$62,500
🖨 Deal sheet 📄 Offer letter ✓ Due diligence
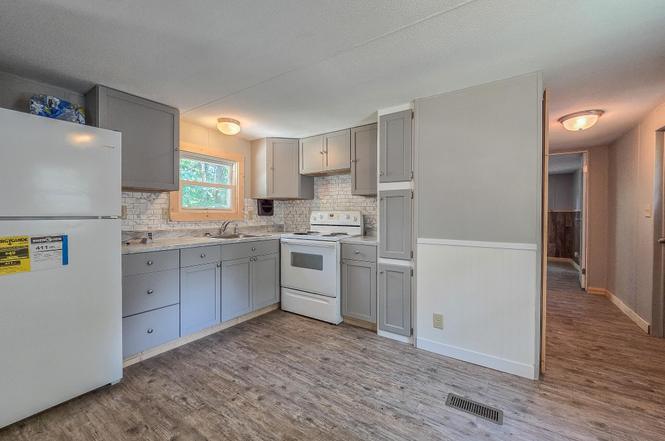
Listing remarks
Here's your chance to slow down and actually live the lake life -- without the lakefront price tag. This freshly updated 2-bedroom, 1-bath home sits on a manageable . 2-acre lot right off the main road leading straight to the boat ramp. Imagine tossing your fishing poles in the truck and being on the water within minutes -- that's the kind of easy living this place offers. Step inside and you'll love the fresh updates -- crisp wainscoting, warm under-cabinet lighting, and a brand-new refrigerator ready for your weekend catch. The remodel was done with care, giving the space a bright, comfortable feel that makes you want to kick off your shoes and stay awhile. This home is perfect whether yo
Key facts
- Low-maintenance
- Move-in condition
- Fresh updates
Tags
Neighborhood map
What this means for you Summary
Snapshot
- This is a 2-bed/1.0-bath manufactured listed at $62k.
Deal economics
- At list price, monthly cash flow is $234 ($3k/yr) — positive.
- The deal already cash-flows at list — no discount required.
- Meets the 1% rule at list price ($843 rent vs $62k).
- Recommended offer: $55k (12.0% below list) — sets the bar for market timing.
- Cap rate 10.8% vs local median 3.3% in Hermitage — top-decile yield for the area; either an underpriced asset or a hidden risk that comps aren't pricing in. Stress-test before assuming the spread holds.
Location & tenants
- Location reads 54/100 on livability (#788 in MO) — a working-class tenant base; expect higher turnover. Strengths: cost of living A+, housing B; Watch: crime F, amenities F, commute F.
- Hermitage R-IV (rural): math 45% / reading 50% proficiency, ranked #185 of 535 in MO (top 35%) — families likely to look elsewhere, expect single-tenant / working-renter base with shorter leases.
- Zoned schools: Hermitage Elem. (math 47% / reading 47%, grade D-, #347 of 1,115 statewide, top 35%, 138 students, 58% FRL); Hermitage Middle (math 24% / reading 44%, grade F, #243 of 391 statewide, top 65%, 50 students, 44% FRL); Hermitage High (math 10% / reading 50%, grade F, #377 of 521 statewide, top 73%, 81 students, 51% FRL).
- Market conditions: 45 active listings in the ZIP.
Forward outlook
- In year one you build about $7k of equity ($432 loan paydown + $6k appreciation (10.0% local appreciation)).
- Hickory County population projected at -26% by 2050 — secular population decline; favor cash flow + early exit over multi-decade hold.
- At projected returns (10.0% appreciation + 3.0% rent growth), your $18k cash investment doubles in ~2 years — after that, you're playing with house money.
- By year 5, paydown + projected appreciation supports a ~$31k cash-out refi (75% LTV) — recoverable capital for the next deal without selling this one.
Negotiation context
- It's been on market 191 days — a 12% lower offer ($55k) is reasonable based on typical stale-listing flexibility.
- 4 sale attempts with the ask held roughly flat each time — persistent listings suggest the price (not the market) is what's stuck; bring a comps-based counter.
Questions for the listing agent
- It's been on market 191 days. Have you received any prior offers? Is the seller open to a 12% concession, seller financing, or rate buy-down credit?
- Why hasn't it sold? Are there any deal-killer items the seller is aware of (foundation, flood, title, zoning, code violations)?
- Is there a deadline driving the sale (1031 exchange, divorce, estate, relocation)? That informs how much negotiation room exists.
- Schools are D-rated, which usually means shorter tenancies and higher turnover. Who's the typical renter profile here, and what's been the actual vacancy rate?
- Crime grade is F in this area — have there been break-ins, vandalism, or insurance claims at this property in the last 3 years? What carrier currently insures it and at what premium?
- This sits on a lake — are riparian / water-frontage rights deeded with the parcel? Any dock permits, shoreline easements, or HOA water-use restrictions?
- What's the documented flood / surge / shoreline-erosion history here (FEMA AND non-FEMA — e.g., storm surge, creek backup, septic-field saturation)?
- Any water-quality or seasonal algae-bloom issues that affect tenant satisfaction or short-term-rental demand?
- What's the average days-on-market for RENTAL listings here right now (not sales)? A rising rental-DOM trend means longer vacancies and softer asking-rent achievability than the comps imply.
- What's the recent tenant-quality profile in this submarket — average credit score on applications, eviction rate, late-payment / NSF rate, and stable-employment percentage? A property-management company in the area should have these aggregated.
- How much new for-sale + rental construction is in the pipeline within 1–3 miles? Heavy new supply typically softens prices + rents 12–24 months out; constrained supply supports both.
Investment metrics
- 1% rule
- 1.35% ✓
- Cap rate
- 10.79%
- Cash-on-cash
- 16.07%
- DSCR
- 1.71
- GRM
- 6.2
CMA / ARV
- ARV (on-the-fly)
- $112,112
- Comps found
- 3
Show comp detail 3 sales within ~0.75 mi
| Address | Dist | Beds/Ba | Sqft | Sold | Price | $/sf | Match |
|---|---|---|---|---|---|---|---|
| 22163 County Road 288 | 0.00mi | 2/1.0 | 784 (0%) | 1mo | $62,500 | $80 | 99 |
| 21960 County Road 288 | 0.24mi | 2/1.0 | 689 (-12%) | 0mo | $120,000 | $174 | 68 |
| 22441 Maple St | 0.48mi | 2/1.0 | 840 (+7%) | 5mo | $119,900 | $143 | 61 |
Match score weights: distance 35% · size 25% · config 20% · recency 20%. Top-matched comps best support the ARV.
Projected returns pro-forma
10.0% appreciation · 3.0% rent growth · sell at horizon
- IRR
- 36.2%
- Equity multiple
- 3.80×
- Total profit
- $48,974
- Equity at exit
- $56,305
- IRR
- 31.2%
- Equity multiple
- 8.57×
- Total profit
- $132,510
- Equity at exit
- $121,424
Cash invested: $17,500 (down + closing). Projections, not guarantees.
Landlord ↔ Tenant lean methodology
- Overall (STATE)
- 81 Strongly Landlord-Friendly
- State Missouri
- 81 Strongly Landlord-Friendly · R+10
- County
- — inherits STATE
- City
- — inherits STATE
ZIP-level market 65724
- Home prices YoY
- 5.4%
- Active inventory
- 45
- Price-to-rent
- 6.2×
Monthly cashflow live
- Estimated rent
- $843 medium interval (Pro) →
- Mortgage (P&I)
- −$328
- Tax est. 1.5%
- −$78 /mo · $938/yr
- Insurance
- −$26
- HOA
- −$0
- Vacancy / Maint / Mgmt
- −$177
- Net cashflow
- $234
Break-even live
UW: 25.0% down · 7.5% · 30yr · 1.5% tax · 5.0% vac · 8.0% maint · 8.0% mgmt
Financing live
Cash to close
- Down payment
- $15,625
- Closing costs
- $1,875
- Reserves months
- —
- Total cash needed
- —
Loan-product check · same deal, 3 products live
Conventional
25% down · 7.5% · 30yr
- Down + closing
- —
- Monthly P&I
- —
- Monthly cashflow
- —
- DSCR
- —
- Eligible?
- —
Personal DTI + credit; lowest rate.
DSCR
20% down · 8.5% · 30yr
- Down + closing
- —
- Monthly P&I
- —
- Monthly cashflow
- —
- DSCR
- —
- Eligible?
- —
No personal income docs; deal must DSCR.
Hard money
10% down · 12.0% · 12mo
- Down + closing
- —
- Monthly P&I
- —
- Monthly cashflow
- —
- DSCR
- —
- Eligible?
- —
Short-term bridge; refi at stabilization.
Listing history 9 events
-
2026-04-21status Pending
-
2025-12-06status Active
-
2025-10-08$62,500 Active
-
2025-07-25$72,500 Active
-
2025-07-03price $75,000
-
2025-05-22price $84,900
-
2025-04-10$89,900 Active
-
2024-10-31soldstatus
-
2024-10-10soldstatus
ⓘ Source: listings_history table (triggers on properties + properties_extension) + one-shot
backfill from property_details.listing_events for pre-trigger history.
Climate risk First Street
- Flood 1/10 Low 0% chance over 30 yrs
- Wildfire 4/10 Moderate
- Heat 4/10 Moderate 7 d/yr ≥107°F today · 18 d/yr by 30 yrs out
- Wind 2/10 Low 0% chance of damaging wind over 30 yrs
- Air quality 1/10 Low 0 unhealthy d/yr today · 0 by 30 yrs out
Nearby sold comps map
Loading sold comps map…
Walkable amenities ~0.75 mi
Loading nearby amenities…
Taxation est. · year 1
- Rental income
- $10,120
- − Mortgage interest
- −$3,501
- − Property taxes
- −$938
- − Insurance
- −$312
- − Repairs & maintenance
- −$810
- − Management
- −$810
- − Depreciation
- −$1,818
- Taxable income
- $1,931
- Est. tax owed @ 24.0%
- −$464
- After-tax cash flow
- $2,348/yr
For passive investors: Depreciation is non-cash, so a rental often shows a tax loss while cash-flowing — sheltering income. Rental losses are passive: they offset passive income freely, and up to $25,000/yr can offset ordinary (W-2) income if you actively participate and your MAGI is under $100k (phasing out to $0 by $150k); unused losses carry forward. On sale, claimed depreciation is recaptured at up to 25%, and gains may owe capital-gains tax (a 1031 exchange can defer both). Figures are a year-1 estimate at your 24.0% rate — not tax advice; consult a CPA.
Schools (NCES district)
- District
- Hermitage R-IV
- NCES district ID
- 2914310
- Math proficiency
- 45% ▬ 0.00%
- Reading proficiency
- 50% ▲ 5.00%
- Median HH income
- $30,066
- Composite
- 40.92/100
- National rank
- #7513
- State rank
- #185 of 535 in MO
Livability — Hermitage
- Score
- 54/100
- State rank
- #788
- US rank
- #23974
Category grades
Schools grade is shown separately in the Schools card above.
Census & demographics
- Population (ZIP)
- 1,728
Population outlook (Hickory County) Hauer SSP2
- Today (2025)
- 8,206 people
- By 2030
- 7,690 · -6.3%
- By 2040
- 6,780 · -17.4%
- By 2050
- 6,076 · -26.0%
- By 2075
- 5,088 · -38.0%
- By 2100
- 4,489 · -45.3%
Race, ethnicity, and origin ACS 2023
- Neighborhood character
- Predominantly White (98%)
- Race & ethnicity
- White 98%
- Common ancestry
- Italian 17% Lithuanian 4% Iranian 1%
- Languages at home
- 97% English-only · German/W. Germanic 3%
Political lean MEDSL · Hickory
- 2024 margin
- Solid R (+61.1) · D 19.1% · R 80.2%
- 2008→2024 swing
- -47.9pp toward R · 2008: -13.3pp · 2024: -61.1pp
- All cycles
- 2024: R+61.1 2020: R+57.3 2016: R+53.5 2012: R+23.6 2008: R+13.3
Not yet ingested
- Civics
- —
Market trends
- HPI YoY
- ▲ 11.14%
- Current HPI
- 216.4684
- Rent YoY
- —
- Metro
- —
- State GDP YoY
- ▲ 1.84%
- F500 in state
- 20
Industry mix (Fortune 500 HQ in MO)
| Industry | F500 HQs | Revenue |
|---|---|---|
| Healthcare | 1 | $163B |
|
||
| Insurance | 1 | $21B |
|
||
| Industrial Technology | 1 | $17B |
|
||
| Retail | 1 | $16B |
|
||
| Industrial Distribution | 1 | $10B |
|
||
| Utilities | 1 | $9B |
|
||
Price history
-30.5% since first listed9 events — show timeline
- 2026-04-21 Pending — SOMO
- 2025-12-06 Relisted — SOMO
- 2025-10-08 Listed $62,500 SOMO
- 2025-07-25 Listed $72,500 SOMO
- 2025-07-03 Price Changed $75,000 SOMO
- 2025-05-22 Price Changed $84,900 SOMO
- 2025-04-10 Listed $89,900 SOMO
- 2024-10-31 Sold (Public Records) — Public Records
- 2024-10-10 Sold (Public Records) — Public Records
Property tax history
+0.8%/yrLatest (2025): $85 · +0.6% YoY. Source: county tax records.
Cash-flow waterfall
monthlySold comps — $/sqft
last 12 mo · ≤1 miLoading sold comps…