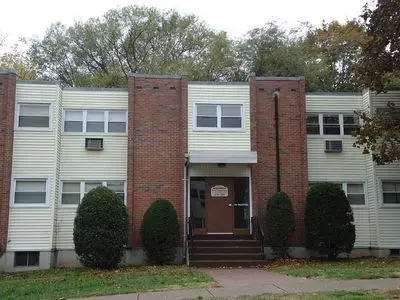
9 Thompson Rd · Manchester, CT
Flood risk 1/10 · Minimal
- FEMA flood zone
- X (unshaded)
- Chance of flooding over 30 yrs
- 0.0%
- Est. flood insurance / yr
- $473 – $860
Fire risk 1/10 · Minimal
- Est. fire insurance / yr
- $829 – $1,539
Heat risk 5/10 · Moderate
- Hot days now (above 95°F)
- 7 days/yr
- Hot days in 30 yrs
- 16 days/yr
Wind risk 6/10 · Moderate
- Chance of severe wind over 30 yrs
- 27.0%
Air-quality risk 3/10 · Minor
- Unhealthy air days now
- 3 days/yr
- Unhealthy air days in 30 yrs
- 4 days/yr
Risk factors via First Street. Map © Google.
Why this score? — see what drove the C- grade
The composite is a weighted blend of 9 inputs, each scored 0–100. Each bar is that input's sub-score; the figure is the points it added to the 100-point composite (weight × sub-score).
- Cash flow +22.5/30.0
- ARV discount +7.5/15.0
- DSCR +7.2/10.0
- 1% rule +5.9/10.0
- Livability +3.8/5.0
- Rent growth +3.0/5.0
- Schools +2.5/10.0
- Condition / age +2.2/5.0
- Appreciation +0.0/10.0
$126,000
🖨 Deal sheet (PDF) 📄 Offer letter ✓ Due diligence
Listing remarks
One bedroom one bath. First floor Heat and hot water included with HOA. Walk to bus line.
Key facts
- Listed 15 days
Neighborhood map
What this means for you Summary
Snapshot
- This is a 1-bed/100.0-bath other listed at $126k. Condition is rated fair.
Deal economics
- At list price, monthly cash flow is $213 ($3k/yr) — positive.
- The deal already cash-flows at list — no discount required.
- Meets the 1% rule at list price ($1k rent vs $126k).
- Recommended offer: $124k (1.5% below list) — sets the bar for market timing.
- Cap rate 8.3% vs local median 3.7% in Manchester — top-decile yield for the area; either an underpriced asset or a hidden risk that comps aren't pricing in. Stress-test before assuming the spread holds.
Location & tenants
- Location reads 76/100 on livability (#59 in CT, #3,580 nationally) — a middle-class / working-renter tenant base. Strengths: housing A+, health & safety A+, cost of living A-; Watch: amenities D, commute F.
- Manchester School District (suburban): math 21% / reading 32% proficiency, ranked #130 of 153 in CT (top 85%) — low school quality limits family demand, transient renter base, plan for 1-2y turnover.
- Zoned schools: Verplanck School (math 22% / reading 17%, grade F, #447 of 553 statewide, top 82%, 457 students, 64% FRL); Illing Middle School (math 18% / reading 35%, grade F, #151 of 175 statewide, top 87%, 846 students, 58% FRL); Manchester High School (math 26% / reading 47%, grade F, #118 of 194 statewide, top 61%, 1,673 students, 52% FRL).
- Market conditions: Rents rising (+2.0%/yr); 107 active listings in the ZIP; 10 comparable units currently listed for rent nearby; rentals lingering (median 45d on market — plan ~5-8 weeks vacancy on turnover, expect pricing pressure); 50% of comp listings sitting > 30 days — soft ceiling on asking rent; solid renter incomes; 1,867 units permitted in Capitol Planning Region in 2024 (1,399 in 5+ unit buildings).
Forward outlook
- Local home prices are declining (-3.0%/yr); year-one equity from $871 of loan paydown is wiped out by about $4k of value loss. Plan a longer hold.
Negotiation context
- It's been on market 15 days — a 2% lower offer ($124k) is reasonable based on typical stale-listing flexibility.
Risks & watch-outs
- Climate carrying-cost: major wind risk, 27% chance of damaging wind over 30y; extreme-heat days projected 7→16/yr by 2055 (HVAC capex compounding) — expect insurance premiums to compound above CPI over the hold.
Questions for the listing agent
- Have any recent inspections been done? Can we get a copy of the seller's disclosures and any deferred-maintenance estimates?
- Is there a deadline driving the sale (1031 exchange, divorce, estate, relocation)? That informs how much negotiation room exists.
- Schools are B-rated — typically a magnet for longer-tenancy family renters. What's the average tenant stay here, and is there a school-zone premium baked into asking?
- What's the average days-on-market for RENTAL listings here right now (not sales)? A rising rental-DOM trend means longer vacancies and softer asking-rent achievability than the comps imply.
- What's the recent tenant-quality profile in this submarket — average credit score on applications, eviction rate, late-payment / NSF rate, and stable-employment percentage? A property-management company in the area should have these aggregated.
- How much new for-sale + rental construction is in the pipeline within 1–3 miles? Heavy new supply typically softens prices + rents 12–24 months out; constrained supply supports both.
Investment metrics
- 1% rule
- 1.09% ✓
- Cap rate
- 8.32%
- Cash-on-cash
- 7.23%
- DSCR
- 1.32
- GRM
- 7.7
CMA / ARV
No comps found within radius.
Projected returns pro-forma
-3.0% appreciation · 1.97% rent growth · sell at horizon
- IRR
- -6.4%
- Equity multiple
- 0.77×
- Total profit
- $-8,262
- Equity at exit
- $18,787
- IRR
- 1.9%
- Equity multiple
- 1.13×
- Total profit
- $4,672
- Equity at exit
- $10,894
Cash invested: $35,280 (down + closing). Projections, not guarantees.
Landlord ↔ Tenant lean methodology
- Overall (STATE)
- 27 Tenant-Leaning
- State Connecticut
- 27 Tenant-Leaning · D+7
- County
- — inherits STATE
- City
- — inherits STATE
ZIP-level market 06040
- Rents YoY
- 2.0%
- Active inventory
- 107
- Price-to-rent
- 7.7×
Monthly cashflow live
- Estimated rent
- $1,371 high interval (Pro) →
- Mortgage (P&I)
- −$661
- Tax est. 1.5%
- −$158 /mo · $1,890/yr
- Insurance
- −$52
- HOA
- −$0
- Vacancy / Maint / Mgmt
- −$288
- Net cashflow
- $213
Break-even live
Sensitivity live
| Price | -10% $300 | -5% $256 | +0% $213 | +5% $169 | +10% $126 |
|---|---|---|---|---|---|
| Rent | -10% $104 | -5% $158 | +0% $213 | +5% $267 | +10% $321 |
| Rate | -1.0pp $276 | -0.5pp $245 | base $213 | +0.5pp $180 | +1.0pp $147 |
UW: 25.0% down · 7.5% · 30yr · 1.5% tax · 5.0% vac · 8.0% maint · 8.0% mgmt
Financing live
Cash to close
- Down payment
- $31,500
- Closing costs
- $3,780
- Reserves months
- —
- Total cash needed
- —
Loan-product check · same deal, 3 products live
Conventional
25% down · 7.5% · 30yr
- Down + closing
- —
- Monthly P&I
- —
- Monthly cashflow
- —
- DSCR
- —
- Eligible?
- —
Personal DTI + credit; lowest rate.
DSCR
20% down · 8.5% · 30yr
- Down + closing
- —
- Monthly P&I
- —
- Monthly cashflow
- —
- DSCR
- —
- Eligible?
- —
No personal income docs; deal must DSCR.
Hard money
10% down · 12.0% · 12mo
- Down + closing
- —
- Monthly P&I
- —
- Monthly cashflow
- —
- DSCR
- —
- Eligible?
- —
Short-term bridge; refi at stabilization.
Rent comps 10 comps
| Address | Beds | Baths | Sqft | Rent | $/sqft | DOM | Units | Dist |
|---|---|---|---|---|---|---|---|---|
| 603 Center St Manchester, CT | 1.0 | 1.0 | 390 | $1,150 | $2.95 | 5d | 1 | 0.13mi |
| 40 Olcott St Manchester, CT | 1.0 | 1.0 | 700 | $1,250 | $1.79 | 45d | 3 | 0.15mi |
| 619 Hartford Rd Manchester, CT | 1.0 | 1.0 | 675 | $1,160 | $1.72 | 5d | 1 | 0.48mi |
| 426 Middle Tpke W #52 Manchester, CT | 1.0 | 1.0 | 750 | $1,550 | $2.07 | 45d | 1 | 0.50mi |
| 448 Middle Tpke W Unit 11U Manchester, CT | 1.0 | 1.0 | 750 | $1,600 | $2.13 | 45d | 1 | 0.53mi |
| 448 Middle Tpke W Unit 11U Manchester, CT | 1.0 | 1.0 | 750 | $1,600 | $2.13 | 25d | 1 | 0.53mi |
| 424 Middle Tpke W Manchester, CT | 1.0–2.0 | 1.0–1.5 | 997 | $1,615 | $1.62 | 3d | 7 | 0.54mi |
| 9 Chestnut St Apt 4 Manchester, CT | 1.0 | 1.0 | 600 | $1,500 | $2.50 | 45d | 1 | 1.15mi |
| 52 Pearl St Manchester, CT | 2.0 | 1.0 | 714 | $1,849 | $2.59 | 45d | 1 | 1.40mi |
| 109 Foster St Unit A-3 Manchester, CT | 2.0 | 1.0 | 600 | $1,050 | $1.75 | 16d | 1 | 1.49mi |
Listing history 10 events
-
2026-06-16statusdays on market $126,000 Under Contract 15 DOM
-
2026-06-15days on market $126,000 Active 14 DOM
-
2026-06-13days on market $126,000 Active 12 DOM
-
2026-06-10days on market $126,000 Active 9 DOM
-
2026-06-09days on market $126,000 Active 8 DOM
-
2026-06-08days on market $126,000 Active 7 DOM
-
2026-06-07days on market $126,000 Active 6 DOM
-
2026-06-03days on market $126,000 Active 2 DOM
-
2026-06-02remarks 91-char remark
-
2026-06-02$126,000 Active 1 DOM
ⓘ Source: listings_history table (triggers on properties + properties_extension) + one-shot
backfill from property_details.listing_events for pre-trigger history.
Climate risk First Street
- Flood 1/10 Low FEMA zone X (unshaded) · 0% chance over 30 yrs
- Wildfire 1/10 Low
- Heat 5/10 Major 7 d/yr ≥95°F today · 16 d/yr by 30 yrs out
- Wind 6/10 Major 27% chance of damaging wind over 30 yrs
- Air quality 3/10 Moderate 3 unhealthy d/yr today · 4 by 30 yrs out
Nearby sold comps map
Loading sold comps map…
Walkable amenities ~0.75 mi
Loading nearby amenities…
Taxation est. · year 1
- Rental income
- $16,456
- − Mortgage interest
- −$7,058
- − Property taxes
- −$1,890
- − Insurance
- −$630
- − Repairs & maintenance
- −$1,317
- − Management
- −$1,317
- − Depreciation
- −$3,665
- Taxable income
- $580
- Est. tax owed @ 24.0%
- −$139
- After-tax cash flow
- $2,412/yr
For passive investors: Depreciation is non-cash, so a rental often shows a tax loss while cash-flowing — sheltering income. Rental losses are passive: they offset passive income freely, and up to $25,000/yr can offset ordinary (W-2) income if you actively participate and your MAGI is under $100k (phasing out to $0 by $150k); unused losses carry forward. On sale, claimed depreciation is recaptured at up to 25%, and gains may owe capital-gains tax (a 1031 exchange can defer both). Figures are a year-1 estimate at your 24.0% rate — not tax advice; consult a CPA.
Condition & rehab AI · 1 photo
A moderate rehab is needed to address exterior paint and landscaping, which can significantly improve the home's curb appeal and rental value.
Repairs flagged
- Minor exterior paint — Brick facade appears weathered
- Minor landscaping — Some overgrown shrubs
Value-add opportunities
- Resale paint exterior — Fresh paint can enhance curb appeal
- Rental trim shrubs — Well-maintained landscaping can attract tenants
Renovation cost estimate screening
| Repair item | Severity | Est. cost |
|---|---|---|
| exterior paint · Brick facade appears weathered | Minor | $500–3,000 |
| landscaping · Some overgrown shrubs | Minor | $500–3,000 |
| Total estimated repair cost · 2 items | $1,000–6,000 |
Value-add ROI direction
- Resale paint exterior — Fresh paint can enhance curb appeal ↑
- Rental trim shrubs — Well-maintained landscaping can attract tenants ↑
ⓘ Cost ranges are severity-bucket heuristics (US national rule-of-thumb). Get contractor quotes + a written scope before underwriting a rehab budget.
Schools (NCES district)
- District
- Manchester School District
- NCES district ID
- 0902310
- Math proficiency
- 21% ▼ -8.00%
- Reading proficiency
- 32% ▼ -5.00%
- Median HH income
- $63,391
- Composite
- 24.54/100
- National rank
- #7643
- State rank
- #130 of 153 in CT
Livability — Manchester
- Score
- 76/100
- State rank
- #59
- US rank
- #3580
Category grades
Schools grade is shown separately in the Schools card above.
Census & demographics
- Census place
- Manchester, CT
- County
- Hartford County · 754,208 people
- City population
- 59,635
- Metro
- Hartford-East Hartford-Middletown, CT
- Population (ZIP)
- 35,813
- Household income
- $83,422
- Rent vs Own
- Severe rent burden
- 1839.0
Population outlook (Capitol County) Hauer SSP2
- By 2040
- 1,063,519
Race, ethnicity, and origin ACS 2023
- Neighborhood character
- Diverse neighborhood (Simpson 0.65)
- Race & ethnicity
- White 53% Hispanic / Latino 18% Black 15% Asian 9% Two or more races 8%
- Hispanic origin (detail)
- Puerto Rican 14%
- Common ancestry
- Romanian 5% Lithuanian 4% Slovak 1%
- Foreign-born
- 15% · Canada, Jamaica, China
- Languages at home
- 81% English-only · Spanish 8% Other Indo-European 5% Other Asian/Pacific 2%
Political lean MEDSL · Capitol
- 2024 margin
- Strong D (+21.9) · D 60.1% · R 38.2% · Other 1.7%
- All cycles
- 2024: D+21.9
Not yet ingested
- Civics
- —
Market trends
- HPI YoY
- ▼ -197.69%
- Current HPI
- 190.4204
- Rent YoY
- ▲ 1.97%
- Metro
- Hartford-East Hartford-Middletown, CT
- State GDP YoY
- ▲ 1.06%
- F500 in state
- 38
Industry mix (Fortune 500 HQ in CT)
| Industry | F500 HQs | Revenue |
|---|---|---|
| Industrial Machinery | 4 | $38B |
|
||
| Insurance | 3 | $71B |
|
||
| Financial Services | 2 | $25B |
|
||
| Transportation / Logistics | 2 | $18B |
|
||
| Healthcare | 1 | $247B |
|
||
| Telecommunications | 1 | $55B |
|
||
Price history
1 event — show timeline
- 2026-06-02 Listed $126,000 FSBO.com
Cash-flow waterfall
monthlySold comps — $/sqft
last 12 mo · ≤1 miLoading sold comps…