 Multi-family
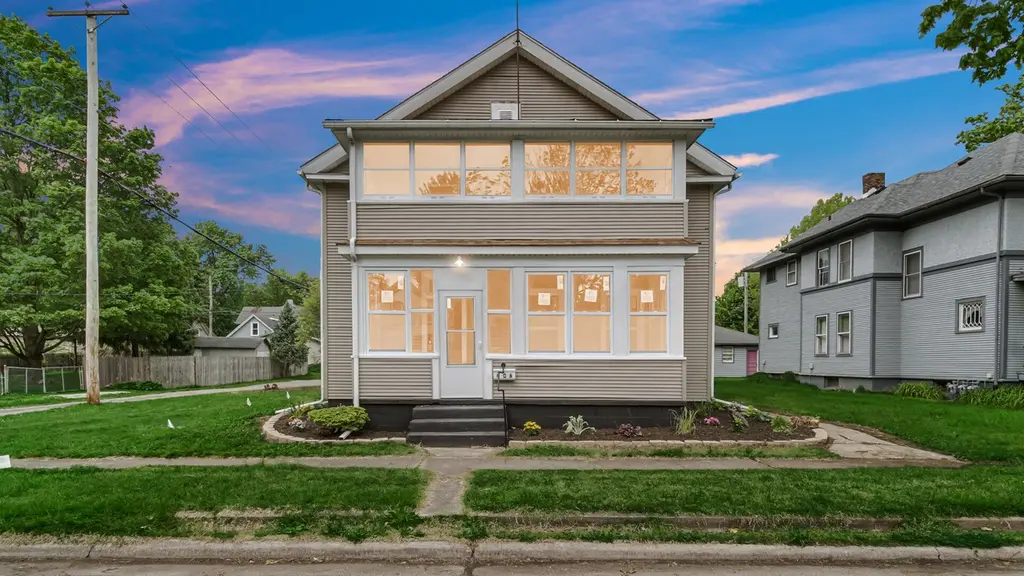
406 D St · La Porte, IN
Flood risk 1/10 · Minimal
- FEMA flood zone
- X (unshaded)
- Chance of flooding over 30 yrs
- 0.0%
- Est. flood insurance / yr
- $473 – $860
Fire risk 1/10 · Minimal
- Est. fire insurance / yr
- $717 – $1,331
Heat risk 2/10 · Minimal
- Hot days now (above 99°F)
- 7 days/yr
- Hot days in 30 yrs
- 15 days/yr
Wind risk 2/10 · Minimal
- Chance of severe wind over 30 yrs
- —
Air-quality risk 2/10 · Minimal
- Unhealthy air days now
- 2 days/yr
- Unhealthy air days in 30 yrs
- 2 days/yr
Risk factors via First Street. Map © Google.
Why this score? — see what drove the F grade
The composite is a weighted blend of 9 inputs, each scored 0–100. Each bar is that input's sub-score; the figure is the points it added to the 100-point composite (weight × sub-score).
- Cash flow +6.1/30.0
- Livability +3.7/5.0
- Schools +3.5/10.0
- Rent growth +2.5/5.0
- Condition / age +2.5/5.0
- DSCR +0.5/10.0
- 1% rule +0.3/10.0
- ARV discount +0.0/15.0
- Appreciation +0.0/10.0
$299,000
🖨 Deal sheet 📄 Offer letter ✓ Due diligence
Multi-family units
County records classify this as Multi-Family (2-4 Unit). Listing-text estimate: 1 unit. estimate disagrees with records
Listing remarks MLS
Spacious one family home awaits your TLC and imagination. Sold as is. Cash only. 10% Earnest money and proof of funds sufficient to close required by seller. Qualified buyer eligible for Seller's incentive of 3.5% if closed by April 30, 2010.
Key facts
- Updated bathrooms
- Walk-in shower
- Chef's kitchen
Tags
Property features AI
Exterior
- Parking: Driveway; Alley access; 2-car garage
- Utilities: Public water; Public sewer; 200+ amp electric service
- Home design: Two-story home; Built in 1849
- Construction: Year built 1849
- Exterior features: City view; Neighborhood view
Interior
- Kitchen: Gas cooktop; Dishwasher; Refrigerator; Microwave
- Bedrooms: Primary bedroom; Bedroom 2; Bedroom 3; Bedroom 4; Bedroom 5
- Bathrooms: 1 full bathroom; 1 three-quarter bathroom
- Heating & cooling: Forced air heating; Central air conditioning
- Interior features: Open floorplan; Stone countertops; Unfinished basement
- Laundry & utility: Laundry on main level
Neighborhood map
What this means for you Summary
Snapshot
- This is a 4-bed/2.0-bath multifamily listed at $299k.
Deal economics
- At list price, monthly cash flow is $-553 ($-7k/yr) — negative.
- To cash-flow at today's rent, offer at most $201k (32.7% below list).
- To meet the 1% rule (rent ≥ 1% of price), the offer needs to be $160k (46.5% below list).
- Recommended offer: $160k (46.5% below list) — sets the bar for 1% rule.
Location & tenants
- Location reads 74/100 on livability (#81 in IN, #4,852 nationally) — a middle-class / working-renter tenant base. Strengths: amenities A+, cost of living A+, housing A+; Watch: schools C-, commute F, employment F.
- Laporte Community School Corporation (urban): math 37% / reading 44% proficiency, ranked #139 of 301 in IN (top 46%) — families likely to look elsewhere, expect single-tenant / working-renter base with shorter leases.
- Market conditions: 260 active listings in the ZIP; 216 units permitted in LaPorte County in 2024 (75 in 5+ unit buildings).
Forward outlook
- Local home prices are declining (-3.0%/yr); year-one equity from $2k of loan paydown is wiped out by about $9k of value loss. Plan a longer hold.
- LaPorte County population projected to shrink 7% by 2050 — rents likely to lag national; underwrite the cash flow, not the appreciation.
Negotiation context
- It's been on market 30 days — a 2% lower offer ($295k) is reasonable based on typical stale-listing flexibility.
- 2 sale attempts since 16y ago with the ask held roughly flat each time — persistent listings suggest the price (not the market) is what's stuck; bring a comps-based counter.
- Current owner paid $25k; list at $299k implies a 1096% gain — meaningful room to come down on a strong offer.
Risks & watch-outs
- Watch-outs: built in 1849 — expect roof / HVAC / electrical / plumbing capex.
Questions for the listing agent
- What do current leases actually rent for vs. the listed asking? Can we see a recent rent roll and the last 12 months of T-12 income?
- Built in 1849 — when were the roof, HVAC, electrical panel, plumbing, and water heater last replaced?
- Is there a deadline driving the sale (1031 exchange, divorce, estate, relocation)? That informs how much negotiation room exists.
- The area grade is low — what's the realistic commute time and amenity access for the typical tenant pool here? Any planned neighborhood developments (good or bad) we should know about?
- What's the average days-on-market for RENTAL listings here right now (not sales)? A rising rental-DOM trend means longer vacancies and softer asking-rent achievability than the comps imply.
- What's the recent tenant-quality profile in this submarket — average credit score on applications, eviction rate, late-payment / NSF rate, and stable-employment percentage? A property-management company in the area should have these aggregated.
- How much new apartment / multifamily construction is in the pipeline within 1–3 miles? Heavy new supply (>2% of stock underway) typically softens rents 12–24 months out; light construction supports rent growth.
Investment metrics
- 1% rule
- 0.53% ✗
- Cap rate
- 4.07%
- Cash-on-cash
- -7.93%
- DSCR
- 0.65
- GRM
- 15.6
CMA / ARV
- ARV (on-the-fly)
- $216,720
- Comps found
- 2
Show comp detail 2 sales within ~0.75 mi
| Address | Dist | Beds/Ba | Sqft | Sold | Price | $/sf | Match |
|---|---|---|---|---|---|---|---|
| 508 Jefferson Ave | 0.61mi | 4/4.0 | 2,329 (-8%) | 2mo | $187,500 | $81 | 49 |
| 206 Maple Ave | 0.75mi | 4/2.0 | 2,300 (-9%) | 11mo | $197,500 | $86 | 42 |
Match score weights: distance 35% · size 25% · config 20% · recency 20%. Top-matched comps best support the ARV.
Projected returns pro-forma
-3.0% appreciation · 3.0% rent growth · sell at horizon
- IRR
- -30.3%
- Equity multiple
- -0.00×
- Total profit
- $-83,829
- Equity at exit
- $44,582
- IRR
- -32.5%
- Equity multiple
- -0.42×
- Total profit
- $-118,912
- Equity at exit
- $25,852
Cash invested: $83,720 (down + closing). Projections, not guarantees.
Landlord ↔ Tenant lean methodology
- Overall (STATE)
- 90 Strongly Landlord-Friendly
- State Indiana
- 90 Strongly Landlord-Friendly · R+11
- County
- — inherits STATE
- City
- — inherits STATE
ZIP-level market 46350
- Active inventory
- 260
- Price-to-rent
- 15.6×
Monthly cashflow live
- Estimated rent
- $1,598 medium interval (Pro) →
- Mortgage (P&I)
- −$1,568
- Tax from tax record
- −$123 /mo · $1,481/yr
- Insurance
- −$125
- HOA
- −$0
- Vacancy / Maint / Mgmt
- −$336
- Net cashflow
- $-553
Break-even live
UW: 25.0% down · 7.5% · 30yr · 1.5% tax · 5.0% vac · 8.0% maint · 8.0% mgmt
Financing live
Cash to close
- Down payment
- $74,750
- Closing costs
- $8,970
- Reserves months
- —
- Total cash needed
- —
Loan-product check · same deal, 3 products live
Conventional
25% down · 7.5% · 30yr
- Down + closing
- —
- Monthly P&I
- —
- Monthly cashflow
- —
- DSCR
- —
- Eligible?
- —
Personal DTI + credit; lowest rate.
DSCR
20% down · 8.5% · 30yr
- Down + closing
- —
- Monthly P&I
- —
- Monthly cashflow
- —
- DSCR
- —
- Eligible?
- —
No personal income docs; deal must DSCR.
Hard money
10% down · 12.0% · 12mo
- Down + closing
- —
- Monthly P&I
- —
- Monthly cashflow
- —
- DSCR
- —
- Eligible?
- —
Short-term bridge; refi at stabilization.
Listing history 19 events
-
2026-06-19days on market $299,000 Active 30 DOM
-
2026-06-18days on market $299,000 Active 29 DOM
-
2026-06-17days on market $299,000 Active 28 DOM
-
2026-06-16days on market $299,000 Active 27 DOM
-
2026-06-15days on market $299,000 Active 26 DOM
-
2026-06-14days on market $299,000 Active 24 DOM
-
2026-06-13days on market $299,000 Active 23 DOM
-
2026-06-10days on market $299,000 Active 21 DOM
-
2026-06-09days on market $299,000 Active 20 DOM
-
2026-06-08days on market $299,000 Active 19 DOM
-
2026-06-07days on market $299,000 Active 18 DOM
-
2026-06-05days on market $299,000 Active 15 DOM
-
2026-06-02days on market $299,000 Active 13 DOM
-
2026-06-01days on market $299,000 Active 12 DOM
-
2026-05-31days on market $299,000 Active 11 DOM
-
2026-05-30days on market $299,000 Active 10 DOM
-
2026-05-20$299,000 Active
-
2010-04-28soldstatus $25,000 242-char remark
Show marketing remark (242 chars)
Spacious one family home awaits your TLC and imagination. Sold as is. Cash only. 10% Earnest money and proof of funds sufficient to close required by seller. Qualified buyer eligible for Seller's incentive of 3.5% if closed by April 30, 2010.
-
2010-04-02$25,000 242-char remark
Show marketing remark (242 chars)
Spacious one family home awaits your TLC and imagination. Sold as is. Cash only. 10% Earnest money and proof of funds sufficient to close required by seller. Qualified buyer eligible for Seller's incentive of 3.5% if closed by April 30, 2010.
ⓘ Source: listings_history table (triggers on properties + properties_extension) + one-shot
backfill from property_details.listing_events for pre-trigger history.
Tax reassessment forecast IN · Partial reset (capped growth)
- Current annual tax
- $1,481 · $123/mo
- Projected year-2 tax
- $2,011 · $168/mo
- Expected delta
- +$530/yr (+$44/mo · 35.8%)
ⓘ Screening estimate from a state-policy table — verify with the county assessor before closing.
Climate risk First Street
- Flood 1/10 Low FEMA zone X (unshaded) · 0% chance over 30 yrs
- Wildfire 1/10 Low
- Heat 2/10 Low 7 d/yr ≥99°F today · 15 d/yr by 30 yrs out
- Wind 2/10 Low
- Air quality 2/10 Low 2 unhealthy d/yr today · 2 by 30 yrs out
Nearby sold comps map
Loading sold comps map…
Walkable amenities ~0.75 mi
Loading nearby amenities…
Taxation est. · year 1
- Rental income
- $19,178
- − Mortgage interest
- −$16,749
- − Property taxes
- −$1,481
- − Insurance
- −$1,495
- − Repairs & maintenance
- −$1,534
- − Management
- −$1,534
- − Depreciation
- −$8,698
- Taxable loss
- −$12,313
- Est. tax savings @ 24.0%
- +$2,955
- After-tax cash flow
- $-3,686/yr
For passive investors: Depreciation is non-cash, so a rental often shows a tax loss while cash-flowing — sheltering income. Rental losses are passive: they offset passive income freely, and up to $25,000/yr can offset ordinary (W-2) income if you actively participate and your MAGI is under $100k (phasing out to $0 by $150k); unused losses carry forward. On sale, claimed depreciation is recaptured at up to 25%, and gains may owe capital-gains tax (a 1031 exchange can defer both). Figures are a year-1 estimate at your 24.0% rate — not tax advice; consult a CPA.
Schools (NCES district)
- District
- Laporte Community School Corporation
- NCES district ID
- 1805580
- Math proficiency
- 37% ▼ -13.00%
- Reading proficiency
- 44% ▼ -11.00%
- Median HH income
- $46,761
- Composite
- 34.58/100
- National rank
- #5162
- State rank
- #139 of 301 in IN
Livability — La Porte
- Score
- 74/100
- State rank
- #81
- US rank
- #4852
Category grades
Schools grade is shown separately in the Schools card above.
Census & demographics
- Census place
- La Porte, IN
- County
- La Porte County · 88,580 people
- City population
- 44,763
- Metro
- Michigan City-La Porte, IN
- Population (ZIP)
- 44,763
- Household income
- $74,307
- Rent vs Own
- Severe rent burden
- 835.0
Population outlook (LaPorte County) Hauer SSP2
- Today (2025)
- 109,757 people
- By 2030
- 108,288 · -1.3%
- By 2040
- 105,070 · -4.3%
- By 2050
- 102,330 · -6.8%
- By 2075
- 97,009 · -11.6%
- By 2100
- 86,459 · -21.2%
Race, ethnicity, and origin ACS 2023
- Neighborhood character
- Predominantly White (82%)
- Race & ethnicity
- White 82% Two or more races 8% Hispanic / Latino 8% Black 3%
- Hispanic origin (detail)
- Mexican 6%
- Common ancestry
- Romanian 11% Iranian 3% Italian 2%
- Foreign-born
- 4% · Canada
- Languages at home
- 93% English-only · Spanish 4% Russian/Polish/Slavic 1% German/W. Germanic 1%
Political lean MEDSL · LaPorte
- 2024 margin
- R (+14.1) · D 42.1% · R 56.2% · Other 1.7%
- 2008→2024 swing
- -19.1pp toward R · 2008: 5.0pp · 2024: -14.1pp
- All cycles
- 2024: R+14.1 2020: R+7.2 2016: R+6.4 2012: D+12.6 2008: D+5.0
Not yet ingested
- Civics
- —
Market trends
- HPI YoY
- ▼ -142.94%
- Current HPI
- 209.2564
- Rent YoY
- —
- Metro
- Michigan City-La Porte, IN
- State GDP YoY
- ▲ 2.90%
- F500 in state
- 18
Industry mix (Fortune 500 HQ in IN)
| Industry | F500 HQs | Revenue |
|---|---|---|
| Industrial Machinery | 2 | $37B |
|
||
| Healthcare | 1 | $177B |
|
||
| Pharmaceuticals | 1 | $45B |
|
||
| Metals / Steel | 1 | $18B |
|
||
| Agriculture | 1 | $17B |
|
||
| Packaging | 1 | $12B |
|
||
Price history
+1096.0% since first listed3 events — show timeline
- 2026-05-20 Listed $299,000 NIRA MLS as Distributed by MLS Grid
- 2010-04-28 Sold (MLS) $25,000 NIRA MLS as Distributed by MLS Grid
- 2010-04-02 Listed $25,000 NIRA MLS as Distributed by MLS Grid
Property tax history
+2.2%/yrLatest (2024): $1,481 · +0.1% YoY. Source: county tax records.
Cash-flow waterfall
monthlySold comps — $/sqft
last 12 mo · ≤1 miLoading sold comps…