2405 S Cooper St · Wichita, KS
Flood risk 1/10 · Minimal
- FEMA flood zone
- X (unshaded)
- Chance of flooding over 30 yrs
- 0.0%
- Est. flood insurance / yr
- $473 – $860
Fire risk 6/10 · Moderate
- Est. fire insurance / yr
- $1,154 – $2,142
Heat risk 5/10 · Moderate
- Hot days now (above 105°F)
- 7 days/yr
- Hot days in 30 yrs
- 18 days/yr
Wind risk 2/10 · Minimal
- Chance of severe wind over 30 yrs
- —
Air-quality risk 2/10 · Minimal
- Unhealthy air days now
- 2 days/yr
- Unhealthy air days in 30 yrs
- 2 days/yr
Risk factors via First Street. Map © Google.
Why this score? — see what drove the C+ grade
The composite is a weighted blend of 9 inputs, each scored 0–100. Each bar is that input's sub-score; the figure is the points it added to the 100-point composite (weight × sub-score).
- Cash flow +20.9/30.0
- Appreciation +10.0/10.0
- ARV discount +7.5/15.0
- DSCR +6.6/10.0
- 1% rule +6.4/10.0
- Livability +3.6/5.0
- Schools +2.9/10.0
- Rent growth +2.5/5.0
- Condition / age +2.5/5.0
$125,000
🖨 Deal sheet 📄 Offer letter ✓ Due diligence
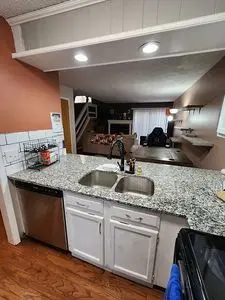
Key facts
- New water heater
- Updated paint
- Hoa covers pool
Tags
Neighborhood map
What this means for you Summary
Snapshot
- This is a 2-bed/2.0-bath single-family listed at $125k.
Deal economics
- At list price, monthly cash flow is $173 ($2k/yr) — positive.
- The deal already cash-flows at list — no discount required.
- Meets the 1% rule at list price ($1k rent vs $125k).
Location & tenants
- Location reads 72/100 on livability (#100 in KS) — a middle-class / working-renter tenant base. Strengths: amenities A+, cost of living A+, housing A+; Watch: employment D+, schools F, crime F.
- Derby (suburban): math 29% / reading 36% proficiency, ranked #66 of 169 in KS (top 39%) — families likely to look elsewhere, expect single-tenant / working-renter base with shorter leases.
- Market conditions: 44 active listings in the ZIP; 9 comparable units currently listed for rent nearby; rentals at typical pace (median 24d on market — plan ~3-4 weeks tenant-placement turnaround); 2,613 units permitted in Sedgwick County in 2024 (258 in 5+ unit buildings).
Forward outlook
- In year one you build about $13k of equity ($864 loan paydown + $12k appreciation (10.0% local appreciation)).
- Sedgwick County population projected at +5% by 2050 — modest demand growth; plan on rents tracking national, not racing it.
- At projected returns (10.0% appreciation + 3.0% rent growth), your $35k cash investment doubles in ~3 years — after that, you're playing with house money.
- By year 3, paydown + projected appreciation supports a ~$34k cash-out refi (75% LTV) — recoverable capital for the next deal without selling this one.
Negotiation context
- Only 10 days on market — expect competitive offers; lowballing is unlikely to land.
- 5 sale attempts since 25y ago with the ask held roughly flat each time — persistent listings suggest the price (not the market) is what's stuck; bring a comps-based counter.
Risks & watch-outs
- Climate carrying-cost: major wildfire risk; extreme-heat days projected 7→18/yr by 2055 (HVAC capex compounding) — expect insurance premiums to compound above CPI over the hold.
Questions for the listing agent
- Is there a deadline driving the sale (1031 exchange, divorce, estate, relocation)? That informs how much negotiation room exists.
- Schools are F-rated, which usually means shorter tenancies and higher turnover. Who's the typical renter profile here, and what's been the actual vacancy rate?
- Crime grade is F in this area — have there been break-ins, vandalism, or insurance claims at this property in the last 3 years? What carrier currently insures it and at what premium?
- What's the average days-on-market for RENTAL listings here right now (not sales)? A rising rental-DOM trend means longer vacancies and softer asking-rent achievability than the comps imply.
- What's the recent tenant-quality profile in this submarket — average credit score on applications, eviction rate, late-payment / NSF rate, and stable-employment percentage? A property-management company in the area should have these aggregated.
- How much new for-sale + rental construction is in the pipeline within 1–3 miles? Heavy new supply typically softens prices + rents 12–24 months out; constrained supply supports both.
Investment metrics
- 1% rule
- 1.14% ✓
- Cap rate
- 7.96%
- Cash-on-cash
- 5.94%
- DSCR
- 1.26
- GRM
- 7.3
CMA / ARV
No comps found within radius.
Projected returns pro-forma
10.0% appreciation · 3.0% rent growth · sell at horizon
- IRR
- 28.6%
- Equity multiple
- 3.26×
- Total profit
- $79,182
- Equity at exit
- $112,610
- IRR
- 24.9%
- Equity multiple
- 7.42×
- Total profit
- $224,654
- Equity at exit
- $242,848
Cash invested: $35,000 (down + closing). Projections, not guarantees.
Landlord ↔ Tenant lean methodology
- Overall (STATE)
- 83 Strongly Landlord-Friendly
- State Kansas
- 83 Strongly Landlord-Friendly · R+10
- County
- — inherits STATE
- City
- — inherits STATE
ZIP-level market 67210
- Home prices YoY
- 30.3%
- Active inventory
- 44
- Price-to-rent
- 7.3×
Monthly cashflow live
- Estimated rent
- $1,422 high interval (Pro) →
- Mortgage (P&I)
- −$656
- Tax from tax record
- −$243 /mo · $2,912/yr
- Insurance
- −$52
- HOA
- −$0
- Vacancy / Maint / Mgmt
- −$299
- Net cashflow
- $173
Break-even live
Sensitivity live
| Price | -10% $244 | -5% $209 | +0% $173 | +5% $138 | +10% $102 |
|---|---|---|---|---|---|
| Rent | -10% $61 | -5% $117 | +0% $173 | +5% $229 | +10% $286 |
| Rate | -1.0pp $236 | -0.5pp $205 | base $173 | +0.5pp $141 | +1.0pp $108 |
UW: 25.0% down · 7.5% · 30yr · 1.5% tax · 5.0% vac · 8.0% maint · 8.0% mgmt
Financing live
Cash to close
- Down payment
- $31,250
- Closing costs
- $3,750
- Reserves months
- —
- Total cash needed
- —
Loan-product check · same deal, 3 products live
Conventional
25% down · 7.5% · 30yr
- Down + closing
- —
- Monthly P&I
- —
- Monthly cashflow
- —
- DSCR
- —
- Eligible?
- —
Personal DTI + credit; lowest rate.
DSCR
20% down · 8.5% · 30yr
- Down + closing
- —
- Monthly P&I
- —
- Monthly cashflow
- —
- DSCR
- —
- Eligible?
- —
No personal income docs; deal must DSCR.
Hard money
10% down · 12.0% · 12mo
- Down + closing
- —
- Monthly P&I
- —
- Monthly cashflow
- —
- DSCR
- —
- Eligible?
- —
Short-term bridge; refi at stabilization.
Rent comps 9 comps
| Address | Beds | Baths | Sqft | Rent | $/sqft | DOM | Units | Dist |
|---|---|---|---|---|---|---|---|---|
| 9922 E Kinkaid Cir Wichita, KS | 3.0 | 2.0 | 1642 | $1,575 | $0.96 | 24d | 1 | 0.44mi |
| 9724 E Annabelle St Wichita, KS | 3.0 | 2.0 | 1300 | $1,750 | $1.35 | 24d | 1 | 0.50mi |
| 9602 E Annabelle Cir Wichita, KS | 3.0 | 2.0 | 1300 | $1,750 | $1.35 | 24d | 1 | 0.50mi |
| 2160 S Thatcher Ct Wichita, KS | 3.0 | 2.0 | 1250 | $1,395 | $1.12 | 24d | 1 | 0.51mi |
| 2303 S White Oak Dr Unit 1 Wichita, KS | 2.0 | 1.5 | 1200 | $1,100 | $0.92 | 24d | 1 | 0.54mi |
| 2200 S Rock Rd Wichita, KS | 1.0–2.0 | 1.0–2.0 | 942 | $1,170 | $1.24 | 14d | 20 | 0.79mi |
| 9211 E Harry St Wichita, KS | 1.0–2.0 | 1.0–2.0 | 817 | $935 | $1.14 | 21d | 1 | 0.98mi |
| 1770 S Rock Rd Wichita, KS | 1.0–2.0 | 1.0–1.5 | 785 | $1,095 | $1.39 | 14d | 9 | 1.08mi |
| 10010 E Boston St Wichita, KS | 2.0 | 1.0–1.5 | 888 | $1,060 | $1.19 | 14d | 8 | 1.23mi |
Listing history 7 events
-
2026-06-18days on market $125,000 Active 10 DOM
-
2026-06-17days on market $125,000 Active 9 DOM
-
2026-06-16days on market $125,000 Active 8 DOM
-
2026-06-15days on market $125,000 Active 7 DOM
-
2026-06-14days on market $125,000 Active 5 DOM
-
2026-06-10days on market $125,000 Active 2 DOM
-
2026-06-09$125,000 Active 1 DOM
ⓘ Source: listings_history table (triggers on properties + properties_extension) + one-shot
backfill from property_details.listing_events for pre-trigger history.
Tax reassessment forecast KS · Resets to sale price
- Current annual tax
- $2,912 · $243/mo
- Projected year-2 tax
- $2,912 · $243/mo
- Expected delta
- $0/yr ($0/mo · 0.0%)
ⓘ Screening estimate from a state-policy table — verify with the county assessor before closing.
Climate risk First Street
- Flood 1/10 Low FEMA zone X (unshaded) · 0% chance over 30 yrs
- Wildfire 6/10 Major
- Heat 5/10 Major 7 d/yr ≥105°F today · 18 d/yr by 30 yrs out
- Wind 2/10 Low
- Air quality 2/10 Low 2 unhealthy d/yr today · 2 by 30 yrs out
Nearby sold comps map
Loading sold comps map…
Walkable amenities ~0.75 mi
Loading nearby amenities…
Taxation est. · year 1
- Rental income
- $17,065
- − Mortgage interest
- −$7,002
- − Property taxes
- −$2,912
- − Insurance
- −$625
- − Repairs & maintenance
- −$1,365
- − Management
- −$1,365
- − Depreciation
- −$3,636
- Taxable income
- $159
- Est. tax owed @ 24.0%
- −$38
- After-tax cash flow
- $2,040/yr
For passive investors: Depreciation is non-cash, so a rental often shows a tax loss while cash-flowing — sheltering income. Rental losses are passive: they offset passive income freely, and up to $25,000/yr can offset ordinary (W-2) income if you actively participate and your MAGI is under $100k (phasing out to $0 by $150k); unused losses carry forward. On sale, claimed depreciation is recaptured at up to 25%, and gains may owe capital-gains tax (a 1031 exchange can defer both). Figures are a year-1 estimate at your 24.0% rate — not tax advice; consult a CPA.
Schools (NCES district)
- District
- Derby
- NCES district ID
- 2005460
- Math proficiency
- 29% ▼ -3.00%
- Reading proficiency
- 36% ▲ 1.00%
- Median HH income
- $60,460
- Composite
- 29.25/100
- National rank
- #6564
- State rank
- #66 of 169 in KS
Livability — Wichita
- Score
- 72/100
- State rank
- #100
- US rank
- #5730
Category grades
Schools grade is shown separately in the Schools card above.
Census & demographics
- Census place
- Wichita, KS
- City population
- 365,168
- Population (ZIP)
- 9,178
Population outlook (Sedgwick County) Hauer SSP2
- Today (2025)
- 537,014 people
- By 2030
- 546,984 · +1.9%
- By 2040
- 559,141 · +4.1%
- By 2050
- 562,027 · +4.7%
- By 2075
- 557,255 · +3.8%
- By 2100
- 513,383 · -4.4%
Race, ethnicity, and origin ACS 2023
- Neighborhood character
- Highly diverse neighborhood (Simpson 0.74)
- Race & ethnicity
- White 43% Hispanic / Latino 19% Asian 16% Two or more races 16% Black 12%
- Hispanic origin (detail)
- Mexican 17%
- Common ancestry
- Italian 2% Serbian 1% Portuguese 1%
- Foreign-born
- 18% · Vietnam, Canada, China
- Languages at home
- 76% English-only · Spanish 12% Vietnamese 6% Other Asian/Pacific 3%
Political lean MEDSL · Sedgwick
- 2024 margin
- R (+13.8) · D 42.3% · R 56.1% · Other 1.6%
- 2008→2024 swing
- -1.1pp toward R · 2008: -12.7pp · 2024: -13.8pp
- All cycles
- 2024: R+13.8 2020: R+12.6 2016: R+19.1 2012: R+19.7 2008: R+12.7
Not yet ingested
- Civics
- —
Market trends
- HPI YoY
- ▲ 77.21%
- Current HPI
- 331.68
- Rent YoY
- —
- Metro
- —
- State GDP YoY
- —
- F500 in state
- 0
Price history
-0.7% since first listed7 events — show timeline
- 2026-06-09 Listed $125,000 FSBO.com
- 2024-12-17 Rental Removed $975 RENTALBEAST
- 2024-12-07 Listed for Rent $995 RENTALBEAST
- 2024-11-17 Rental Removed $1,025 RENTALBEAST
- 2024-11-15 Listed for Rent $1,025 RENTALBEAST
- 2003-12-25 Listed $122,500 SCKMLS as Distributed by MLS Grid
- 2001-01-02 Listed $125,900 SCKMLS as Distributed by MLS Grid
Property tax history
+4.8%/yrLatest (2025): $2,912 · -1.3% YoY. Source: county tax records.
Cash-flow waterfall
monthlySold comps — $/sqft
last 12 mo · ≤1 miLoading sold comps…