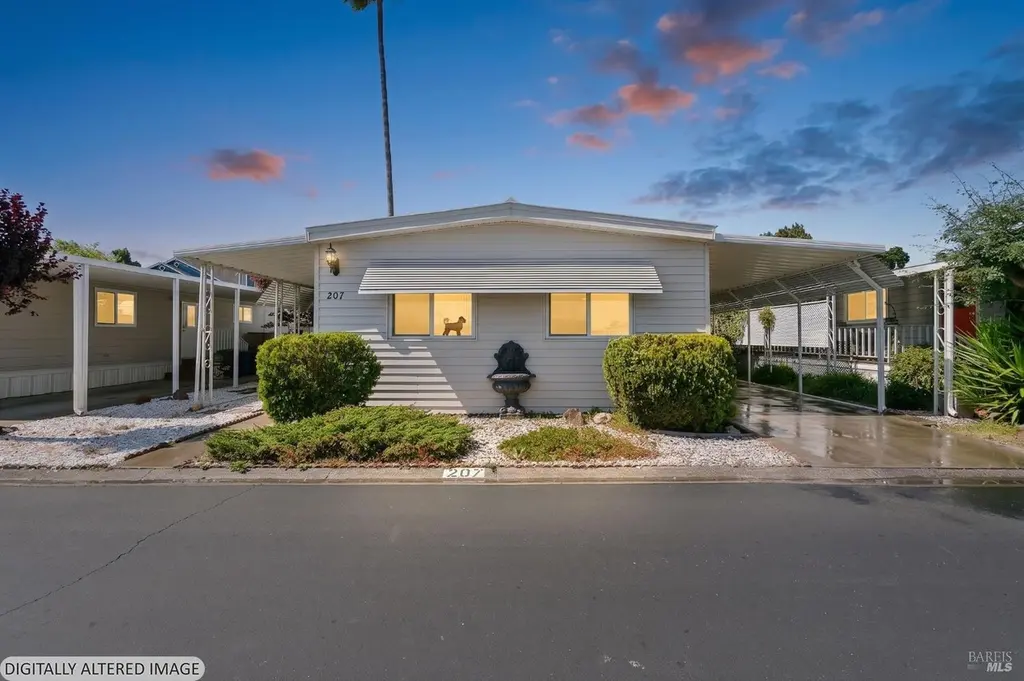
300 E H St #207 · Benicia, CA
Flood risk 7/10 · Major
- FEMA flood zone
- X (shaded)
- Chance of flooding over 30 yrs
- 0.96%
- Est. flood insurance / yr
- $507 – $1,088
Fire risk 1/10 · Minimal
- Est. fire insurance / yr
- $659 – $1,223
Heat risk 4/10 · Minor
- Hot days now (above 95°F)
- 7 days/yr
- Hot days in 30 yrs
- 15 days/yr
Wind risk 1/10 · Minimal
- Chance of severe wind over 30 yrs
- —
Air-quality risk 8/10 · Major
- Unhealthy air days now
- 13 days/yr
- Unhealthy air days in 30 yrs
- 13 days/yr
Risk factors via First Street. Map © Google.
Why this score? — see what drove the B+ grade
The composite is a weighted blend of 9 inputs, each scored 0–100. Each bar is that input's sub-score; the figure is the points it added to the 100-point composite (weight × sub-score).
- Cash flow +30.0/30.0
- ARV discount +10.7/15.0
- DSCR +10.0/10.0
- 1% rule +9.8/10.0
- Schools +6.7/10.0
- Livability +3.4/5.0
- Condition / age +2.5/5.0
- Rent growth +2.3/5.0
- Appreciation +0.0/10.0
$190,000
🖨 Deal sheet (PDF) 📄 Offer letter ✓ Due diligence
Listing remarks MLS
Well cared for home located in downtown Benicia Senior Mobile Home Park. Home offers Sun Porch and Enclosed Patio Room, Storage Shed, A/C & Updated Furnace, Wheelchair Lift and room for a Garden. Community pool and meeting room. Wonderful opportunity to be downtown, single level home, close to waterfront!
Key facts
- Gated community
- Clubhouse
- Pool
Tags
Property features AI
Finance
- Financial info: Land lease amount: $1,090
- HOA & community: No homeowners association; Located in a senior community; Located in Rancho Benicia park; Land lease required
Exterior
- Parking: Covered parking (1 space)
- Utilities: Individual gas meter; Public sewer
- Home design: Manufactured in-park; Double wide; Fixer / original condition
- Construction: Suncrest make; Manufactured by Fleetwood; Aluminum and vinyl skirting
- Exterior features: Carpeted patio/porch areas; Enclosed deck; Enclosed patio; Porch
Interior
- Kitchen: Free standing electric range; Range hood
- Bedrooms: 3 bedrooms
- Flooring: Carpet
- Bathrooms: 2 full bathrooms; Tub with shower over
- Heating & cooling: Central heating; Central cooling
- Interior features: Skylight(s); Carbon monoxide detector; Smoke detector
- Laundry & utility: Washer included; Dryer included
Neighborhood map
What this means for you Summary
Snapshot
- This is a 3-bed/2.0-bath manufactured listed at $190k.
Deal economics
- At list price, monthly cash flow is $835 ($10k/yr) — positive.
- The deal already cash-flows at list — no discount required.
- Meets the 1% rule at list price ($3k rent vs $190k).
- Cap rate 12.0% vs local median 2.6% in Benicia — top-decile yield for the area; either an underpriced asset or a hidden risk that comps aren't pricing in. Stress-test before assuming the spread holds.
Location & tenants
- Location reads 68/100 on livability (#269 in CA) — a middle-class / working-renter tenant base. Strengths: employment A+, crime A, housing A-; Watch: amenities F, cost of living F, health & safety F.
- Benicia Unified (suburban): math 75% / reading 75% proficiency, ranked #35 of 517 in CA (top 7%) — strong family-tenant draw, lease renewals of 3-5y typical; only 17% free/reduced lunch — higher-income household profile.
- Zoned schools: Mary Farmar Elementary (420 students, 25% FRL); Benicia Middle (986 students, 28% FRL); Benicia High (math 75% / reading 75%, grade A-, #66 of 1,170 statewide, top 6%, 1,432 students, 24% FRL).
- Market conditions: Rents soft (-0.8%/yr); 119 active listings in the ZIP; 11 comparable units currently listed for rent nearby; rentals at typical pace (median 15d on market — plan ~3-4 weeks tenant-placement turnaround); high-income renter base; 1,472 units permitted in Solano County in 2024 (131 in 5+ unit buildings).
Forward outlook
- Local home prices are declining (-3.0%/yr); year-one equity from $1k of loan paydown is wiped out by about $6k of value loss. Plan a longer hold.
- Solano County population projected at +15% by 2050 — modest demand growth; plan on rents tracking national, not racing it.
- At projected returns (-3.0% appreciation + 0.0% rent growth), your $53k cash investment doubles in ~9 years — after that, you're playing with house money.
Negotiation context
- Only 7 days on market — expect competitive offers; lowballing is unlikely to land.
- 4 sale attempts since 15y ago with the ask held roughly flat each time — persistent listings suggest the price (not the market) is what's stuck; bring a comps-based counter.
- Current owner paid $150k; 27% above their basis — modest negotiation headroom, anchor on the comps not their cost.
Risks & watch-outs
- Watch-outs: flood insurance adds $66/mo.
- Climate carrying-cost: major flood risk — expect insurance premiums to compound above CPI over the hold.
Questions for the listing agent
- Built in 1974 — when were the roof, HVAC, electrical panel, plumbing, and water heater last replaced?
- What's the actual annual flood-insurance premium (NFIP or private), and is the property in a SFHA with mandatory coverage?
- Is there a deadline driving the sale (1031 exchange, divorce, estate, relocation)? That informs how much negotiation room exists.
- Schools are B-rated — typically a magnet for longer-tenancy family renters. What's the average tenant stay here, and is there a school-zone premium baked into asking?
- What's the average days-on-market for RENTAL listings here right now (not sales)? A rising rental-DOM trend means longer vacancies and softer asking-rent achievability than the comps imply.
- What's the recent tenant-quality profile in this submarket — average credit score on applications, eviction rate, late-payment / NSF rate, and stable-employment percentage? A property-management company in the area should have these aggregated.
- How much new for-sale + rental construction is in the pipeline within 1–3 miles? Heavy new supply typically softens prices + rents 12–24 months out; constrained supply supports both.
Investment metrics
- 1% rule
- 1.48% ✓
- Cap rate
- 11.99%
- Cash-on-cash
- 20.33%
- DSCR
- 1.90
- GRM
- 5.6
CMA / ARV
- ARV (on-the-fly)
- $204,480
- Comps found
- 12
Show comp detail 12 sales within ~0.75 mi
| Address | Dist | Beds/Ba | Sqft | Sold | Price | $/sf | Match |
|---|---|---|---|---|---|---|---|
| 300 E H St #98 | 0.00mi | 2/2.0 (-1) | 1,440 (0%) | 0mo | $225,000 | $156 | 95 |
| 300 E H St #36 | 0.00mi | 2/2.0 (-1) | 1,440 (0%) | 2mo | $245,000 | $170 | 94 |
| 300 E H St #74 | 0.00mi | 2/2.0 (-1) | 1,440 (0%) | 2mo | $205,000 | $142 | 93 |
| 300 E H St #166 | 0.00mi | 3/2.0 | 1,440 (0%) | 14mo | $210,000 | $146 | 88 |
| 300 East H St #186 | 0.00mi | 3/2.0 | 1,440 (0%) | 18mo | $183,000 | $127 | 85 |
| 300 E H St #38 | 0.00mi | 3/2.0 | 1,400 (-3%) | 13mo | $170,000 | $121 | 84 |
| 300 E H St #163 | 0.00mi | 3/2.0 | 1,530 (+6%) | 15mo | $146,000 | $95 | 77 |
| 300 E H St #62 | 0.01mi | 3/2.0 | 1,344 (-7%) | 16mo | $138,000 | $103 | 75 |
| 300 E H St #150 | 0.01mi | 3/2.0 | 1,536 (+7%) | 18mo | $156,000 | $102 | 74 |
| 300 E H St #76 | 0.01mi | 3/2.0 | 1,280 (-11%) | 17mo | $277,500 | $217 | 67 |
| 300 E H St #51 | 0.00mi | 2/2.0 (-1) | 1,300 (-10%) | 15mo | $190,000 | $146 | 66 |
| 300 E East H St #173 | 0.11mi | 2/2.0 (-1) | 1,344 (-7%) | 16mo | $188,000 | $140 | 66 |
Match score weights: distance 35% · size 25% · config 20% · recency 20%. Top-matched comps best support the ARV.
Projected returns pro-forma
-3.0% appreciation · 0.0% rent growth · sell at horizon
- IRR
- 7.1%
- Equity multiple
- 1.27×
- Total profit
- $14,262
- Equity at exit
- $28,330
- IRR
- 13.5%
- Equity multiple
- 1.93×
- Total profit
- $49,490
- Equity at exit
- $16,428
Cash invested: $53,200 (down + closing). Projections, not guarantees.
Landlord ↔ Tenant lean methodology
- Overall (STATE)
- 18 Strongly Tenant-Friendly
- State California
- 18 Strongly Tenant-Friendly · D+13
- County
- — inherits STATE
- City
- — inherits STATE
ZIP-level market 94510
- Rents YoY
- -0.8%
- Active inventory
- 119
- Price-to-rent
- 5.6×
Monthly cashflow live
- Estimated rent
- $2,803 high interval (Pro) →
- Mortgage (P&I)
- −$996
- Tax est. 1.5%
- −$238 /mo · $2,850/yr
- Insurance
- −$79
- Flood insurance flood zone
- −$66 /mo · $798/yr
- HOA
- −$0
- Vacancy / Maint / Mgmt
- −$589
- Net cashflow
- $835
Break-even live
Sensitivity live
| Price | -10% $966 | -5% $901 | +0% $835 | +5% $769 | +10% $704 |
|---|---|---|---|---|---|
| Rent | -10% $614 | -5% $724 | +0% $835 | +5% $946 | +10% $1,056 |
| Rate | -1.0pp $931 | -0.5pp $883 | base $835 | +0.5pp $786 | +1.0pp $736 |
UW: 25.0% down · 7.5% · 30yr · 1.5% tax · 5.0% vac · 8.0% maint · 8.0% mgmt
Financing live
Cash to close
- Down payment
- $47,500
- Closing costs
- $5,700
- Reserves months
- —
- Total cash needed
- —
Loan-product check · same deal, 3 products live
Conventional
25% down · 7.5% · 30yr
- Down + closing
- —
- Monthly P&I
- —
- Monthly cashflow
- —
- DSCR
- —
- Eligible?
- —
Personal DTI + credit; lowest rate.
DSCR
20% down · 8.5% · 30yr
- Down + closing
- —
- Monthly P&I
- —
- Monthly cashflow
- —
- DSCR
- —
- Eligible?
- —
No personal income docs; deal must DSCR.
Hard money
10% down · 12.0% · 12mo
- Down + closing
- —
- Monthly P&I
- —
- Monthly cashflow
- —
- DSCR
- —
- Eligible?
- —
Short-term bridge; refi at stabilization.
Rent comps 11 comps
| Address | Beds | Baths | Sqft | Rent | $/sqft | DOM | Units | Dist |
|---|---|---|---|---|---|---|---|---|
| 125 W F St Benicia, CA | 2.0 | 1.0 | 1000 | $1,995 | $2.00 | 45d | 1 | 0.35mi |
| 671 Military E Benicia, CA | 2.0 | 1.5 | 1168 | $2,250 | $1.93 | 15d | 1 | 0.61mi |
| 652 E N St Unit East Benicia, CA | 2.0 | 1.5 | 930 | $2,635 | $2.83 | 45d | 1 | 0.63mi |
| 652 E N St Benicia, CA | 2.0 | 1.5 | 930 | $2,635 | $2.83 | 22d | 1 | 0.63mi |
| 802 Military E Benicia, CA | 3.0 | 2.5 | 1464 | $2,950 | $2.02 | 14d | 1 | 0.75mi |
| 522 1/2 W K St Benicia, CA | 1.0–3.0 | 1.0 | 696 | $2,898 | $4.16 | 0d | 4 | 0.89mi |
| 150 Rankin Way Benicia, CA | 2.0 | 2.0 | 1092 | $2,951 | $2.70 | 0d | 2 | 0.99mi |
| 1766 Valerie Ct Benicia, CA | 3.0 | 2.0 | 1312 | $3,895 | $2.97 | 45d | 1 | 1.06mi |
| 138 Warwick Dr #86 Benicia, CA | 2.0 | 1.5 | 1012 | $2,400 | $2.37 | 45d | 1 | 1.17mi |
| 117 Sunset Cir #27 Benicia, CA | 3.0 | 1.5 | 1197 | $2,895 | $2.42 | 6d | 1 | 1.31mi |
| 133 Braemer Ct Benicia, CA | 3.0 | 3.0 | 1762 | $3,795 | $2.15 | 9d | 1 | 1.40mi |
Listing history 14 events
-
2026-06-01status $190,000 Pending 7 DOM
-
2026-05-31days on market $190,000 Active 7 DOM
-
2026-05-30days on market $190,000 Active 6 DOM
-
2026-05-24$190,000 Active
-
2017-06-12soldstatus $150,000 Sold 310-char remark
Show marketing remark (310 chars)
Well cared for home located in downtown Benicia Senior Mobile Home Park. Home offers Sun Porch and Enclosed Patio Room, Storage Shed, A/C & Updated Furnace, Wheelchair Lift and room for a Garden. Community pool and meeting room. Wonderful opportunity to be downtown, single level home, close to waterfront!
-
2017-06-08status Pending 310-char remark
Show marketing remark (310 chars)
Well cared for home located in downtown Benicia Senior Mobile Home Park. Home offers Sun Porch and Enclosed Patio Room, Storage Shed, A/C & Updated Furnace, Wheelchair Lift and room for a Garden. Community pool and meeting room. Wonderful opportunity to be downtown, single level home, close to waterfront!
-
2017-05-16historical Contingent 310-char remark
Show marketing remark (310 chars)
Well cared for home located in downtown Benicia Senior Mobile Home Park. Home offers Sun Porch and Enclosed Patio Room, Storage Shed, A/C & Updated Furnace, Wheelchair Lift and room for a Garden. Community pool and meeting room. Wonderful opportunity to be downtown, single level home, close to waterfront!
-
2017-05-12$159,000 Active 310-char remark
Show marketing remark (310 chars)
Well cared for home located in downtown Benicia Senior Mobile Home Park. Home offers Sun Porch and Enclosed Patio Room, Storage Shed, A/C & Updated Furnace, Wheelchair Lift and room for a Garden. Community pool and meeting room. Wonderful opportunity to be downtown, single level home, close to waterfront!
-
2011-06-30soldstatus $52,000 Sold 137-char remark
Show marketing remark (137 chars)
VERY WELL CARED FOR! 3 BEDROOMS, BUT 1 BEDROOM CONVERTED TO OFFICE (VERY NEAT) SENIORS PARK ONLY. 2 BLKS FROM BEAUTIFUL DOWNTOWN BENICIA.
-
2011-06-28soldstatus $52,000 Sold
-
2011-06-22status Pending 137-char remark
Show marketing remark (137 chars)
VERY WELL CARED FOR! 3 BEDROOMS, BUT 1 BEDROOM CONVERTED TO OFFICE (VERY NEAT) SENIORS PARK ONLY. 2 BLKS FROM BEAUTIFUL DOWNTOWN BENICIA.
-
2011-06-22status Pending
Show marketing remark (137 chars)
VERY WELL CARED FOR! 3 BEDROOMS, BUT 1 BEDROOM CONVERTED TO OFFICE (VERY NEAT) SENIORS PARK ONLY. 2 BLKS FROM BEAUTIFUL DOWNTOWN BENICIA.
-
2011-05-04$54,900 Active
Show marketing remark (137 chars)
VERY WELL CARED FOR! 3 BEDROOMS, BUT 1 BEDROOM CONVERTED TO OFFICE (VERY NEAT) SENIORS PARK ONLY. 2 BLKS FROM BEAUTIFUL DOWNTOWN BENICIA.
-
2011-05-04$54,900 New 137-char remark
Show marketing remark (137 chars)
VERY WELL CARED FOR! 3 BEDROOMS, BUT 1 BEDROOM CONVERTED TO OFFICE (VERY NEAT) SENIORS PARK ONLY. 2 BLKS FROM BEAUTIFUL DOWNTOWN BENICIA.
ⓘ Source: listings_history table (triggers on properties + properties_extension) + one-shot
backfill from property_details.listing_events for pre-trigger history.
Climate risk First Street
- Flood 7/10 Severe FEMA zone X (shaded) · 96% chance over 30 yrs
- Wildfire 1/10 Low
- Heat 4/10 Moderate 7 d/yr ≥95°F today · 15 d/yr by 30 yrs out
- Wind 1/10 Low
- Air quality 8/10 Severe 13 unhealthy d/yr today · 13 by 30 yrs out
Nearby sold comps map
Loading sold comps map…
Walkable amenities ~0.75 mi
Loading nearby amenities…
Taxation est. · year 1
- Rental income
- $33,638
- − Mortgage interest
- −$10,643
- − Property taxes
- −$2,850
- − Insurance
- −$1,748
- − Repairs & maintenance
- −$2,691
- − Management
- −$2,691
- − Depreciation
- −$5,527
- Taxable income
- $7,488
- Est. tax owed @ 24.0%
- −$1,797
- After-tax cash flow
- $8,223/yr
For passive investors: Depreciation is non-cash, so a rental often shows a tax loss while cash-flowing — sheltering income. Rental losses are passive: they offset passive income freely, and up to $25,000/yr can offset ordinary (W-2) income if you actively participate and your MAGI is under $100k (phasing out to $0 by $150k); unused losses carry forward. On sale, claimed depreciation is recaptured at up to 25%, and gains may owe capital-gains tax (a 1031 exchange can defer both). Figures are a year-1 estimate at your 24.0% rate — not tax advice; consult a CPA.
Schools (NCES district)
- District
- Benicia Unified
- NCES district ID
- 0604620
- Math proficiency
- 75% ▲ 21.00%
- Reading proficiency
- 75% ▲ 17.00%
- Median HH income
- $88,573
- Composite
- 67.21/100
- National rank
- #387
- State rank
- #35 of 517 in CA
Livability — Benicia
- Score
- 68/100
- State rank
- #269
- US rank
- #9131
Category grades
Schools grade is shown separately in the Schools card above.
Census & demographics
- Census place
- Benicia, CA
- County
- Solano County · 433,239 people
- City population
- 26,749
- Metro
- Vallejo, CA
- Population (ZIP)
- 26,749
- Household income
- $121,204
- Rent vs Own
- Severe rent burden
- 1270.0
Population outlook (Solano County) Hauer SSP2
- Today (2025)
- 478,685 people
- By 2030
- 497,974 · +4.0%
- By 2040
- 528,515 · +10.4%
- By 2050
- 549,115 · +14.7%
- By 2075
- 587,229 · +22.7%
- By 2100
- 571,378 · +19.4%
Race, ethnicity, and origin ACS 2023
- Neighborhood character
- Diverse neighborhood (Simpson 0.61)
- Race & ethnicity
- White 60% Hispanic / Latino 15% Two or more races 15% Asian 12% Black 3%
- Hispanic origin (detail)
- Mexican 9%
- Common ancestry
- Lithuanian 3% Italian 2% Slovak 2%
- Foreign-born
- 14% · Canada, China, Vietnam
- Languages at home
- 82% English-only · Spanish 8% Tagalog/Filipino 3% Other Indo-European 3%
Political lean MEDSL · Solano
- 2024 margin
- Strong D (+23.0) · D 60.0% · R 37.1% · Other 2.9%
- 2008→2024 swing
- -5.6pp toward R · 2008: 28.6pp · 2024: 23.0pp
- All cycles
- 2024: D+23.0 2020: D+30.3 2016: D+30.5 2012: D+28.1 2008: D+28.6
Not yet ingested
- Civics
- —
Market trends
- HPI YoY
- ▼ -751.84%
- Current HPI
- 265.4288
- Rent YoY
- ▼ -0.82%
- Metro
- Vallejo, CA
- State GDP YoY
- ▲ 3.21%
- F500 in state
- 116
Industry mix (Fortune 500 HQ in CA)
| Industry | F500 HQs | Revenue |
|---|---|---|
| Technology | 27 | $1,492B |
|
||
| Financial Services | 3 | $174B |
|
||
| Retail | 3 | $44B |
|
||
| Insurance | 3 | $26B |
|
||
| Media / Entertainment | 2 | $115B |
|
||
| Pharmaceuticals / Biotech | 2 | $62B |
|
||
Price history
+246.1% since first listed11 events — show timeline
- 2026-05-24 Listed $190,000 BAREIS
- 2017-06-12 Sold (MLS) $150,000 BAREIS
- 2017-06-08 Pending — BAREIS
- 2017-05-16 Contingent — BAREIS
- 2017-05-12 Listed $159,000 BAREIS
- 2011-06-30 Sold (MLS) $52,000 bridgeMLS, Bay East AOR, or Contra Costa AOR
- 2011-06-28 Sold (MLS) $52,000 BAREIS
- 2011-06-22 Pending — bridgeMLS, Bay East AOR, or Contra Costa AOR
- 2011-06-22 Pending — BAREIS
- 2011-05-04 Listed $54,900 BAREIS
- 2011-05-04 Listed $54,900 bridgeMLS, Bay East AOR, or Contra Costa AOR
Cash-flow waterfall
monthlySold comps — $/sqft
last 12 mo · ≤1 miLoading sold comps…